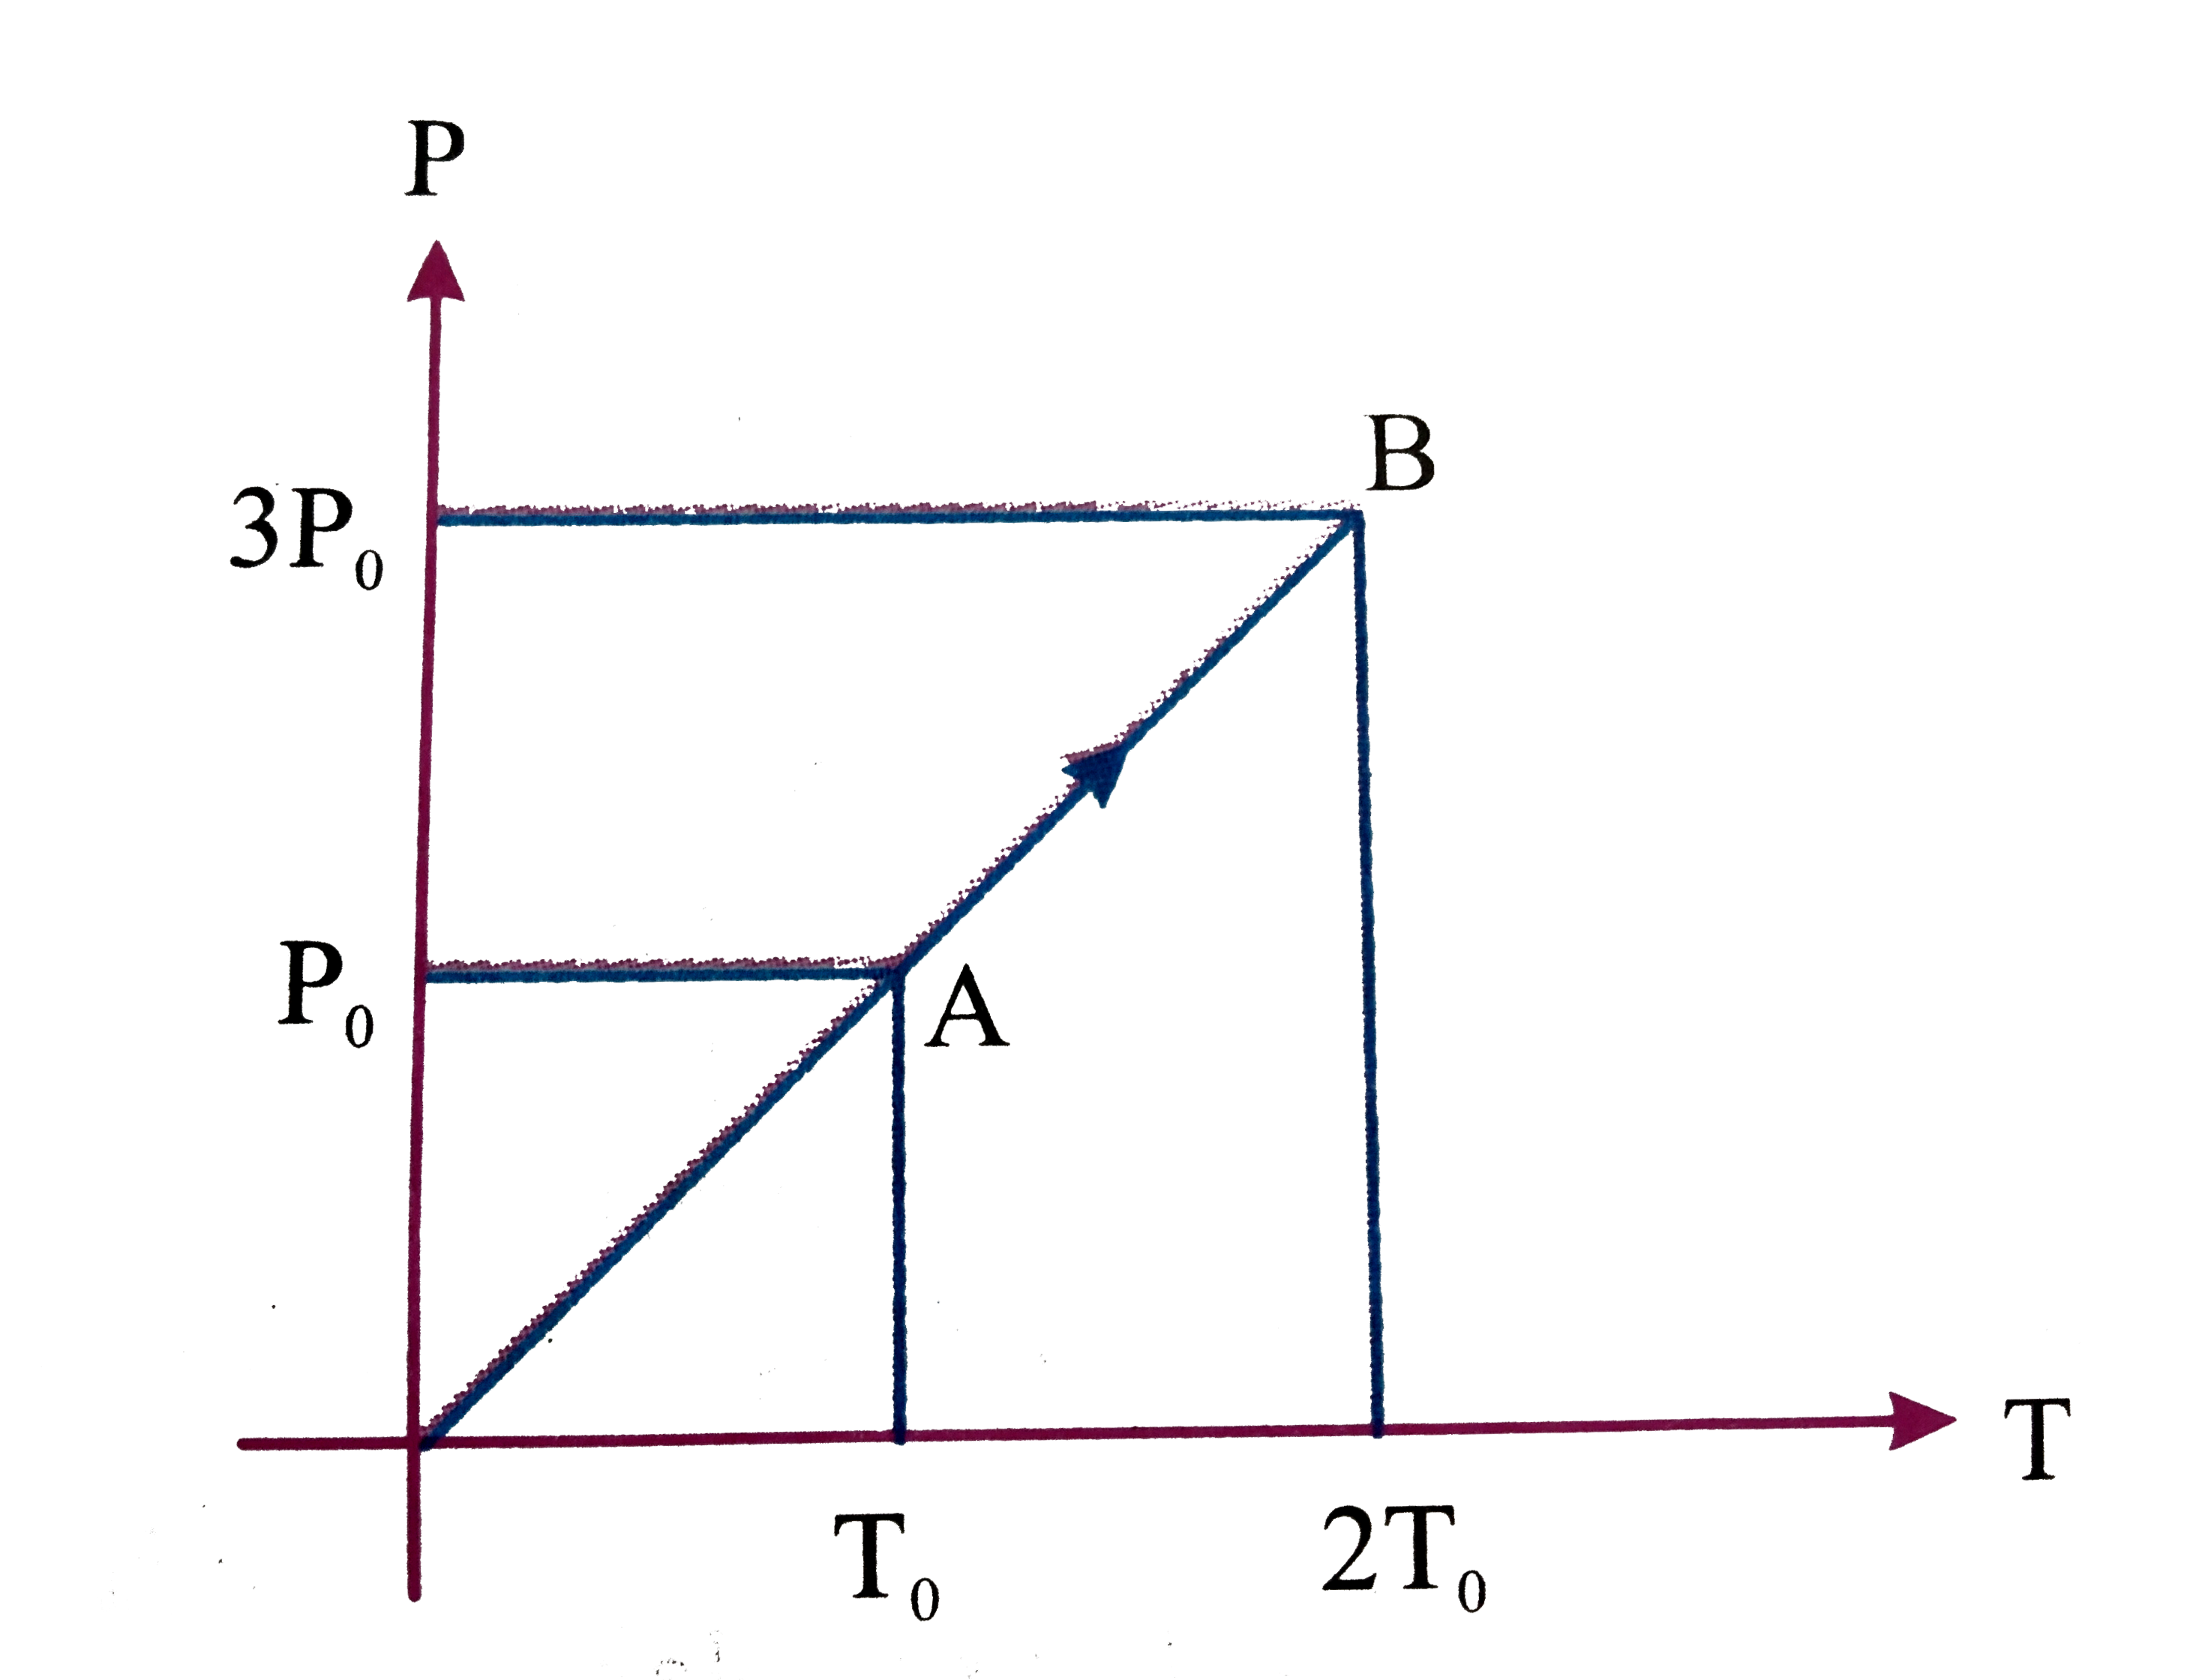
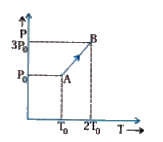
Pressure versus temperature graph of an ideal gas is shown in figure. Density of the gas at point A is . Density at B will be

or
and
Topper's Solved these Questions
- BOOK - NARAYNACHAPTER - KINETIC THEORY OF GASESEXERCISE - C.U.Q153videos
KINETIC THEORY OF GASES
- BOOK - NARAYNACHAPTER - KINETIC THEORY OF GASESEXERCISE - LEVEL-I(C.W)32videos
KINETIC THEORY OF GASES
- BOOK - NARAYNACHAPTER - KINETIC THEORY OF GASESEXERCISE - LEVEL-I (H.W)12videos
KINETIC THEORY OF GASES
- BOOK - NARAYNACHAPTER - GRAVITATIONEXERCISE - EXERCISE -IV40videos
GRAVITATION
- BOOK - NARAYNACHAPTER - LAW OF MOTIONEXERCISE - EXERCISE - IV35videos
LAW OF MOTION
Similar Questions
The root mean square speed of gas molecules
02:14View SolutionA piece of lead falls from a height of 100m on a fixed non-conducting slab which brings it to rest. If the specific heat of lead is 30.6 cal/kg .∘C, the increase in temperature of the slab immediately after collision is
01:39View SolutionGas at a pressure P0 in contained as a vessel. If the masses of all the molecules are halved and their speeds are doubles. The resulting pressure P will be equal to
01:47View SolutionThe earth is an approximate sphere. If the interior contained matter which is not of the same density every where, then on the surface of the earth, the acceleration due to gravity
01:52View SolutionWhen a body is stationary:
02:08View SolutionPressure versus temperature graph of an ideal gas as shown in Fig. Corresponding density (rho) versus volume (V) graph will be
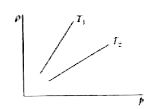
03:33View SolutionFigure shows graphs of pressure versus density for an ideal gas at two temperatures T_(1) and T_(2) Which is correct ? .
View SolutionPressure versus temperature graph of an ideal gas is shown in figure. Density of the gas at point A is P0. Density at B will be
 02:51View Solution
Pressure versus density graph of an ideal gas is shown in figure
01:36View SolutionFigure shows graphs of pressure versus density for an ideal gas at two temperatures T1 and T2 Then
 02:51View Solution
Pressure versus temperature graph of an ideal gas is as shown in figure. Density of the gas at point A is ρ0 . Density at point B will be ____
 03:51View Solution
P-V diagram of an ideal gas for a process ABC is as shown in the figure.

Plot pressure versus density graph of the gas for the process ABC.04:06View SolutionPressure versus temperature graph of an ideal gas is as shown in figure. Density of the gas at point A is rho_0 . Density at B will be:
05:03View SolutionPressure versus density graph of an ideal gas is shown in figure
View SolutionPressure versus temperature graph of an ideal gas is shown in figure. Density of the gas at point A is rho_(0) . Density at B will be
04:10View SolutionFigure shows graphs of pressure versus density for an ideal gas at two temperatures T_(1) and T_(2) Which is correct ? .
02:43View Solution

