Read the
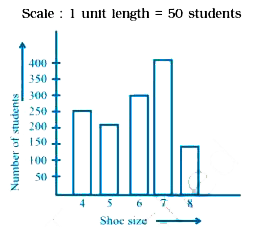
bar graph shown in Figure and answer the following questions:
What is the
information given by the bar graph?
What are the different number of the shoe-worn by the students?
What is the
number of students wearing shoe No.6?
Which shoe
number is worn by the maximum number of students? Also give its number
Which shoe
number is worn by the minimum number of students? Also given its number
State
whether true or false:
The number
of students wearing shoe no.10 is less than three times the number of
students wearing shoe no.9.
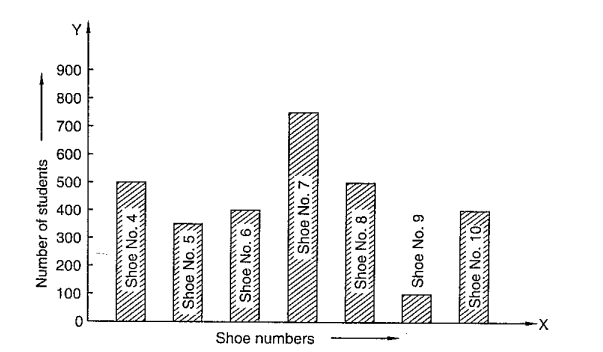
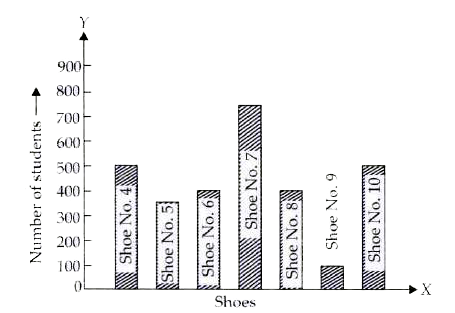
(i) The following bar graph gives information of different sizes of shoes worn by the number students in a school.
(ii)the students are wearing Shoes numbered 4,5,6,7,8,9&10
(iii)400 students are wearing shoe no. 6
(iv) Shoe no. 7 is worn by the maximum number of students i.e 750
(v)Shoe number 9 is worn by the minimum number of students i.e 100
(vi)The number of students wearing shoes of number 10 is 400. And the number of students wearing shoe number 9 is 100.
Clearly thrice the number of students wearing shoes of number size 9 is less than the number of students wearing shoes of number size 10. Hence the given statement is not correct.
Topper's Solved these Questions
Similar Questions
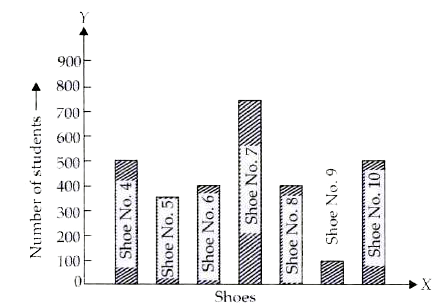
Read the bar graph shown in figure and answer the following questions.
Which shoe number is worn by the maximum number of students? Also give its number
 View Solution
Read the bar graph shown in figure and answer the following questions.
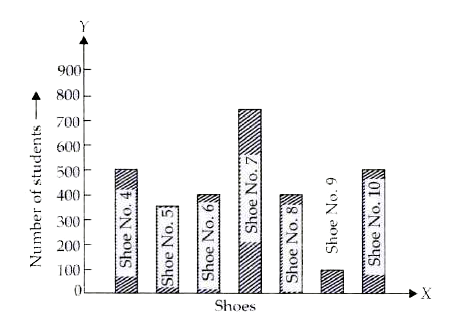
What are the different numbers of the shoesworn by the students?View SolutionRead the bar graph shown in figure and answer the following questions.
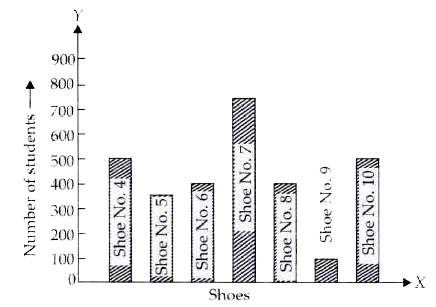
The number of students wearing shoe No. 10 is less than three times the number of students wearing shoe No. 9. Is it true ?View SolutionRead the bar graph shown in Figure and answer the following questions: What is the information given by the bar graph? What is the order of the change of number of students over several years? State whether true or false. The enrolment during 1996-97 is twice that of 1995-96
View SolutionRead the bar graph given below and answer the following questions:
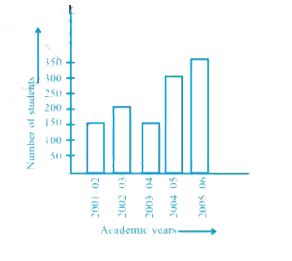
In which year is the number of students maximum?View SolutionRead the bar graph shown in figure and answer the following questions.
Which shoe number is worn by the minimum number of students? Also give its frequency.View SolutionThe following bar graph represents the data for different sizes of shoes worn by the students in a school. Read the graph and answer the following questions.
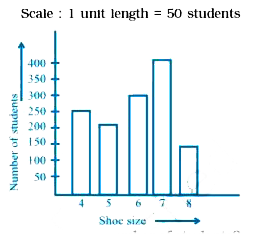
Which shoe size is worn by the maximum number of students?View SolutionRead the bar graph given below and answer the following questions:
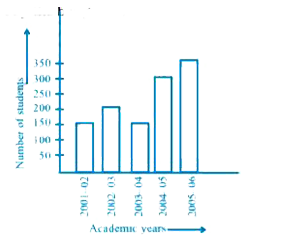
In which year is the number of students twice as that of 2001-02?View SolutionThe following bar graph represents the data for different sizes of shoes worn by the students in a school. Read the graph and answer the following questions.
Which shoe size is worn by minimum number of students?View SolutionStudy the given graph the question that follows
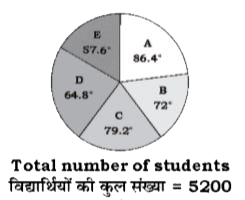
The number of students is school C is what percentage more than the number of students in school B?View Solution

