Given below Figure in the bar graph indicating
the marks obtained out of 50 in mathematics paper by 100 students. Read the
bar graph and answer the following questions:
It is decided to distribute work books on
mathematics to the students obtaining less than 20 marks, giving one workbook
to each of such students. If a work book costs Rs. 5, what sum is required to
buy the work books?
Every student belonging to the highest mark
group is entitled to get a prize of Rs. 10. How much amount of money is
required for distributing the prize money?
Every student belonging to the lowest
mark-group has to solve 5 problems per day. How many problems, in all, will
be solved by the students of this group per day?
State whether true or false.
17% students have obtained marks ranging from
40 to 49.
59% students have obtained marks ranging from
10 to 29.
What is the number of students getting less
than 20 marks?
What is the number of students getting more
than 29 marks?
What is the number of students getting marks
between 9 and 40?
What is the number of students belonging to the
highest mark group?
What is the number of students obtaining more
than 19 marks?
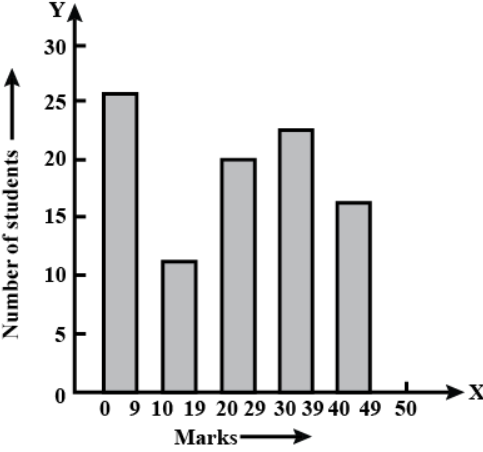
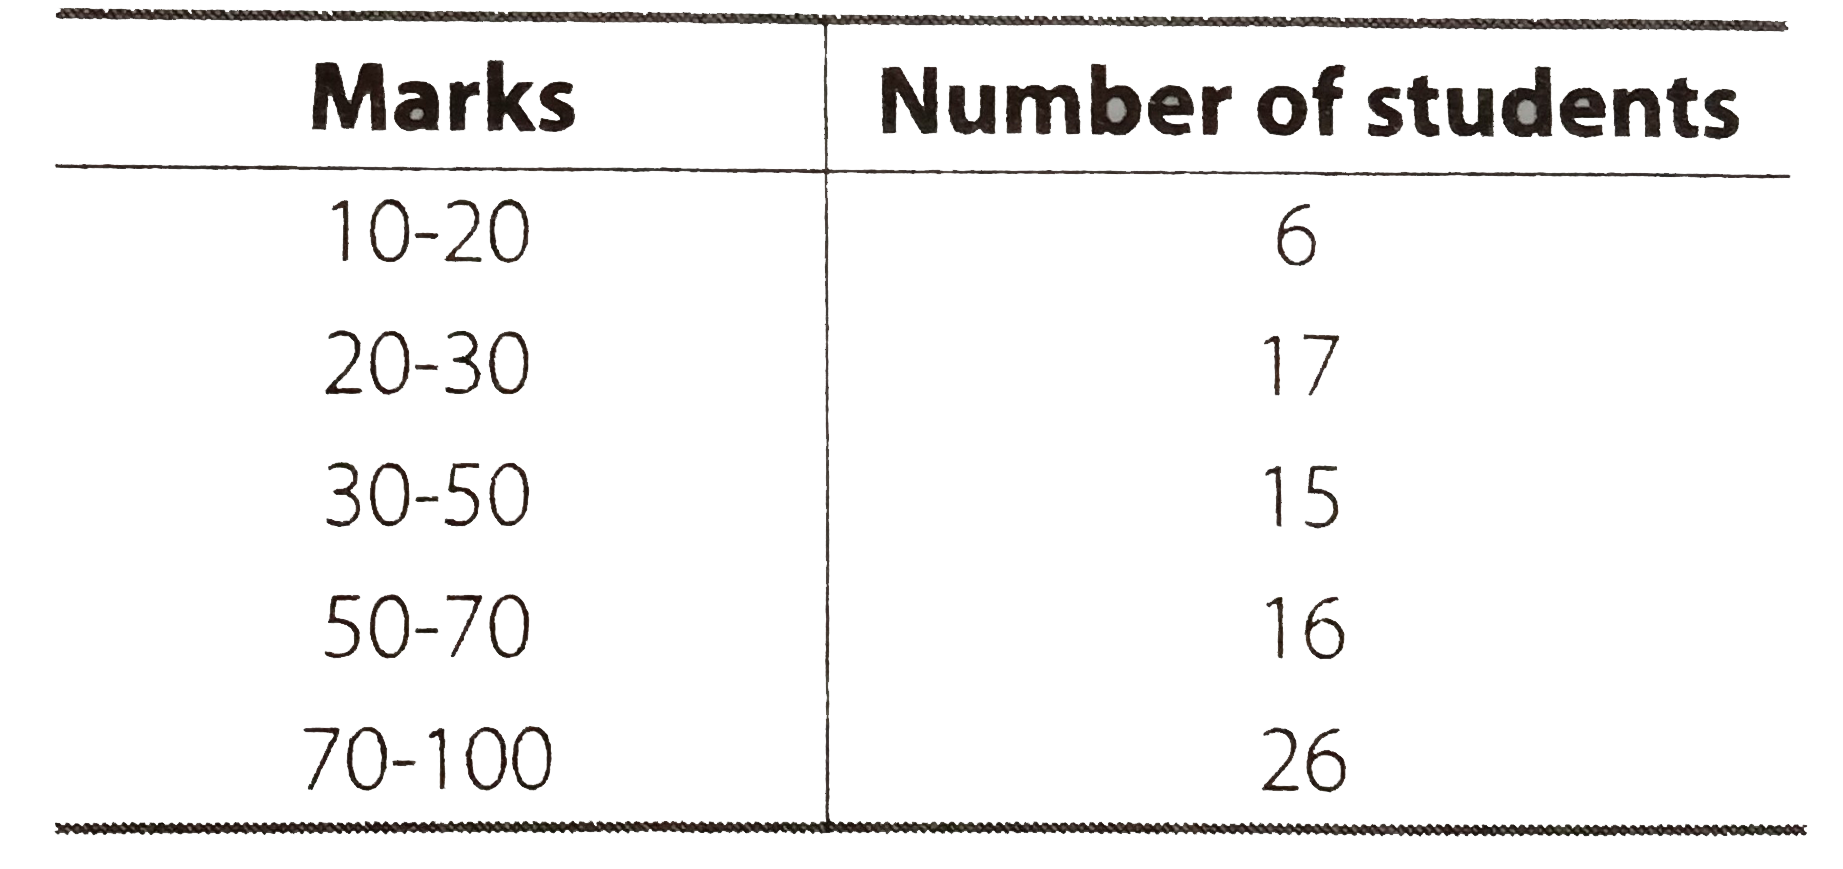
(i)Total number of students obtaining less than 20 marks
Cost of one work book
Cost of 30 Work books =
(ii)Number of students belonging to the Highest Mark group
Cost incurred for 17 prizes=
(iii)Number of students belonging to the Lowest Mark group
Problems solved by 1 student=
Total problems solved by 27 students =
(iv)a)Total number of students
Number of students in the range
percentage of students obtaining marks ranging from 40-49 . Hence the given statement is true.
(iv)b)Number of students in the range
percentage of students obtaining marks ranging from 10 - 29 . Hence the given statement is False.
(v)Number of students scoring less than 20 marks = Number of students in the marks group 0−9+ Number of students in the marks group 10−19
(vi) Number of students getting more than 29 marks = Number of students in the marks group 30−39+ Number of students in the marks group 40−49
(vii) Number of students getting marks between 9 and 40 =
(viii) Number of students belonging to the highest mark group
(ix) Number of students obtaining more than 19 marks
Topper's Solved these Questions
Similar Questions
Knowledge Check
- Question 1 - Select One
Study the given histogram that shows the marks obtained by students in examination and answer the question that follows
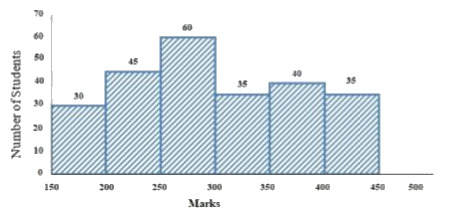
The number of students who obtained less than 200 marks is :AA)45BB)135CC)30DD)75 - Question 2 - Select One
Study the histogram of marks (in Mathematics) distribution of 50 students of class IX and answer the following questions.
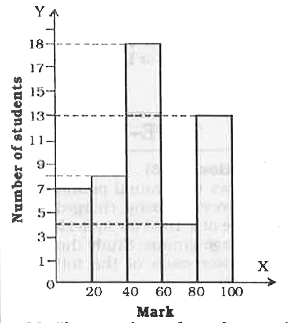
The percentage of students who have secured marks more than 59 is :A13B17C34D26
Read the bar graph given below and answer the following questions:

In which year is the number of students twice as that of 2001-02?View SolutionRead the bar graph shown in figure and answer the following questions.
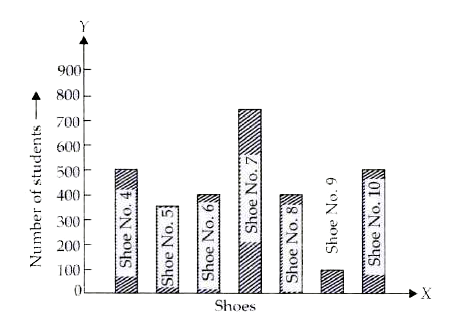
What are the different numbers of the shoesworn by the students?View SolutionStudy the given graph and answer the question that follows
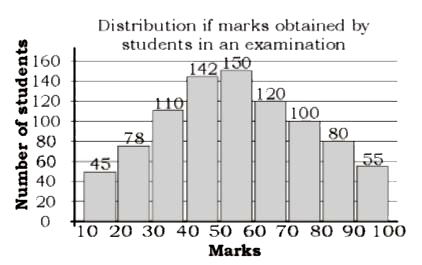
The total marks of students obtaining less than 50 marks is what percentage more than the total number of students obtaining 60 marks or moreView SolutionThe given graph shows the marks obtained by students in an examination
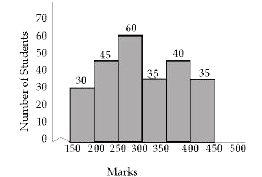
The number of students who obtained less than 300 marks is what percent more than the number of students who obtained 350 or more marksView SolutionThe given graph shows the marks obtained by students in an examination.
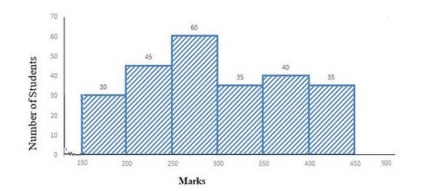 The number of students who obtained less than 300 marks is what percent more than the number of students who obtained 350 or more marks?View Solution
Read the bar graph shown in figure and answer the following questions.
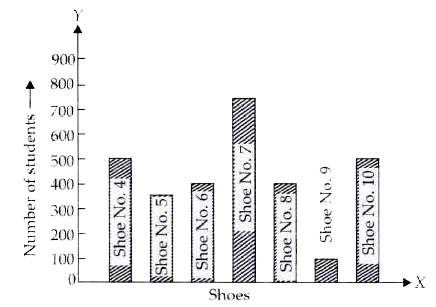
The number of students wearing shoe No. 10 is less than three times the number of students wearing shoe No. 9. Is it true ?View Solution


