The
following table shows the number of Maruti cars
sold by five dealers in a particular month:

Represent
the above information by a pictograph.
Topper's Solved these Questions
Similar Questions
The following table shows the number of fruits in a fruit shop. Represent the above data by a bar graph
View SolutionThe following table represents income of a Gram Panchayat from different sources in a particular year:

Draw a bar graph to represent the above informationView SolutionThe given table shows the number of tourists who visited Taj Mahal during different months. Month

Draw a bar graph to represent the above information by using appropriate scale.View SolutionThe table represents number of tourists visiting a zoo for 5 months.

Make a bar graph representing the above information.View SolutionThe following data shows the number of students born in different months of a particular year of class VI. Make the bar graph based on the given information.
 View Solution
Following is the pictograph of the number of wrist watches manufactured by a factory in a particular week.
(i) On which day were least number of wrist watches manufactured?
(ii) On which day were maximum number of wrist watches manufactured?
(iii) Find out the appropriate number of wrist watches manufactured in this particular week?
View SolutionThe following table shows the marks obtained by Sumit in the annual examination.

Draw a bar graph to show the above information.View SolutionThe following table shows the percentage of buyers of four different brands of bathing soaps.

Represent the above data by a pie chart.View SolutionThe following table shows the expenditure of a family whose monthly income is * 22,000.Represent the above data by a pie chart.
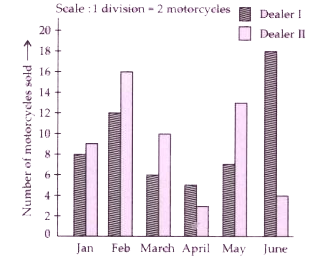
View SolutionThe data given below shows the number motorcycles of the same brand sold by two dealers in the first six months of a year

Find the total number of motorcycles sold by dealer IIView Solution

