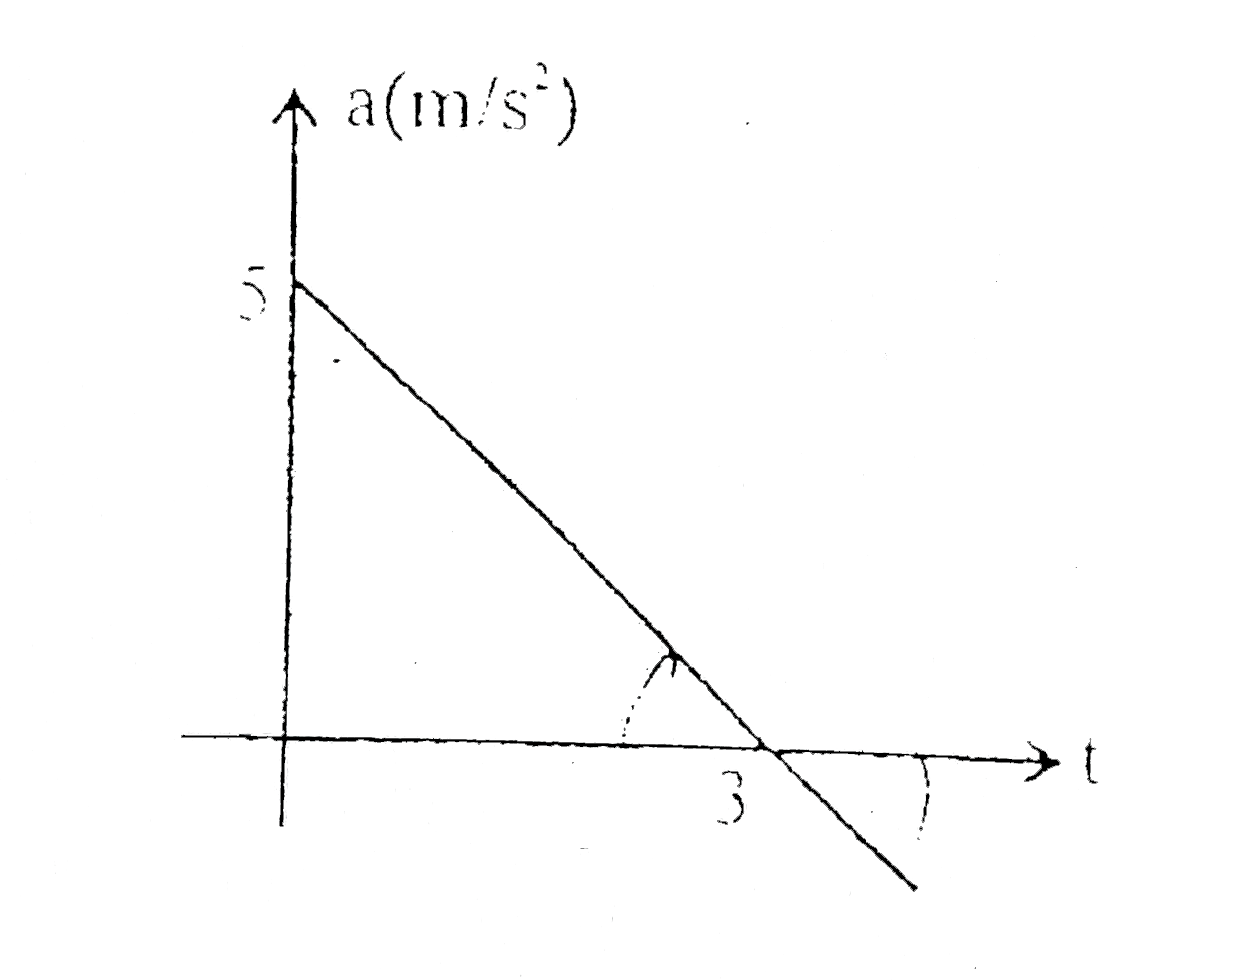
The acceleration-time graph of a particle moving along a straight line is as shown in figure. At what time the particle acquires its initial velcoity ?
3 sec
5 sec
6 sec
16 sec
The correct Answer is:C
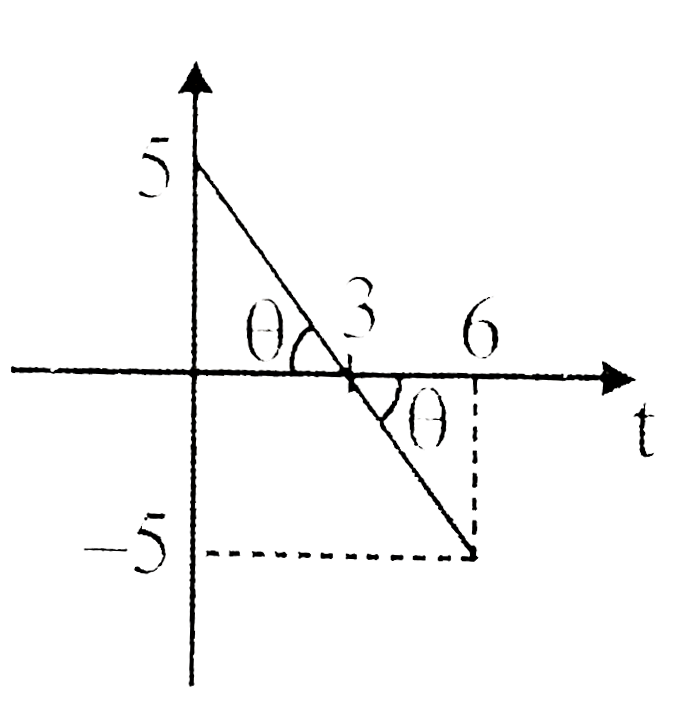
Area of a−t graph gives Δ→V, i.e., change in velocity. If vf=vi, as mentioned in the question then , Δv=0⇒area=0
Topper's Solved these Questions
- BOOK - BANSALCHAPTER - TEST PAPERSEXERCISE - PHYSICS PART (A)32videos
TEST PAPERS
- BOOK - BANSALCHAPTER - TEST PAPERSEXERCISE - PHYSICS PART (B)3videos
TEST PAPERS
- BOOK - BANSALCHAPTER - TEST PAPERSEXERCISE - PHYSICS PART- C4videos
TEST PAPERS
- BOOK - BANSALCHAPTER - SEMICONDUCTORSEXERCISE - CBSE Question32videos
SEMICONDUCTORS
Similar Questions
The acceleration time graph of a particle moving along a straight line is as shown in Fig.At what time the particle acquires its initial velocity?
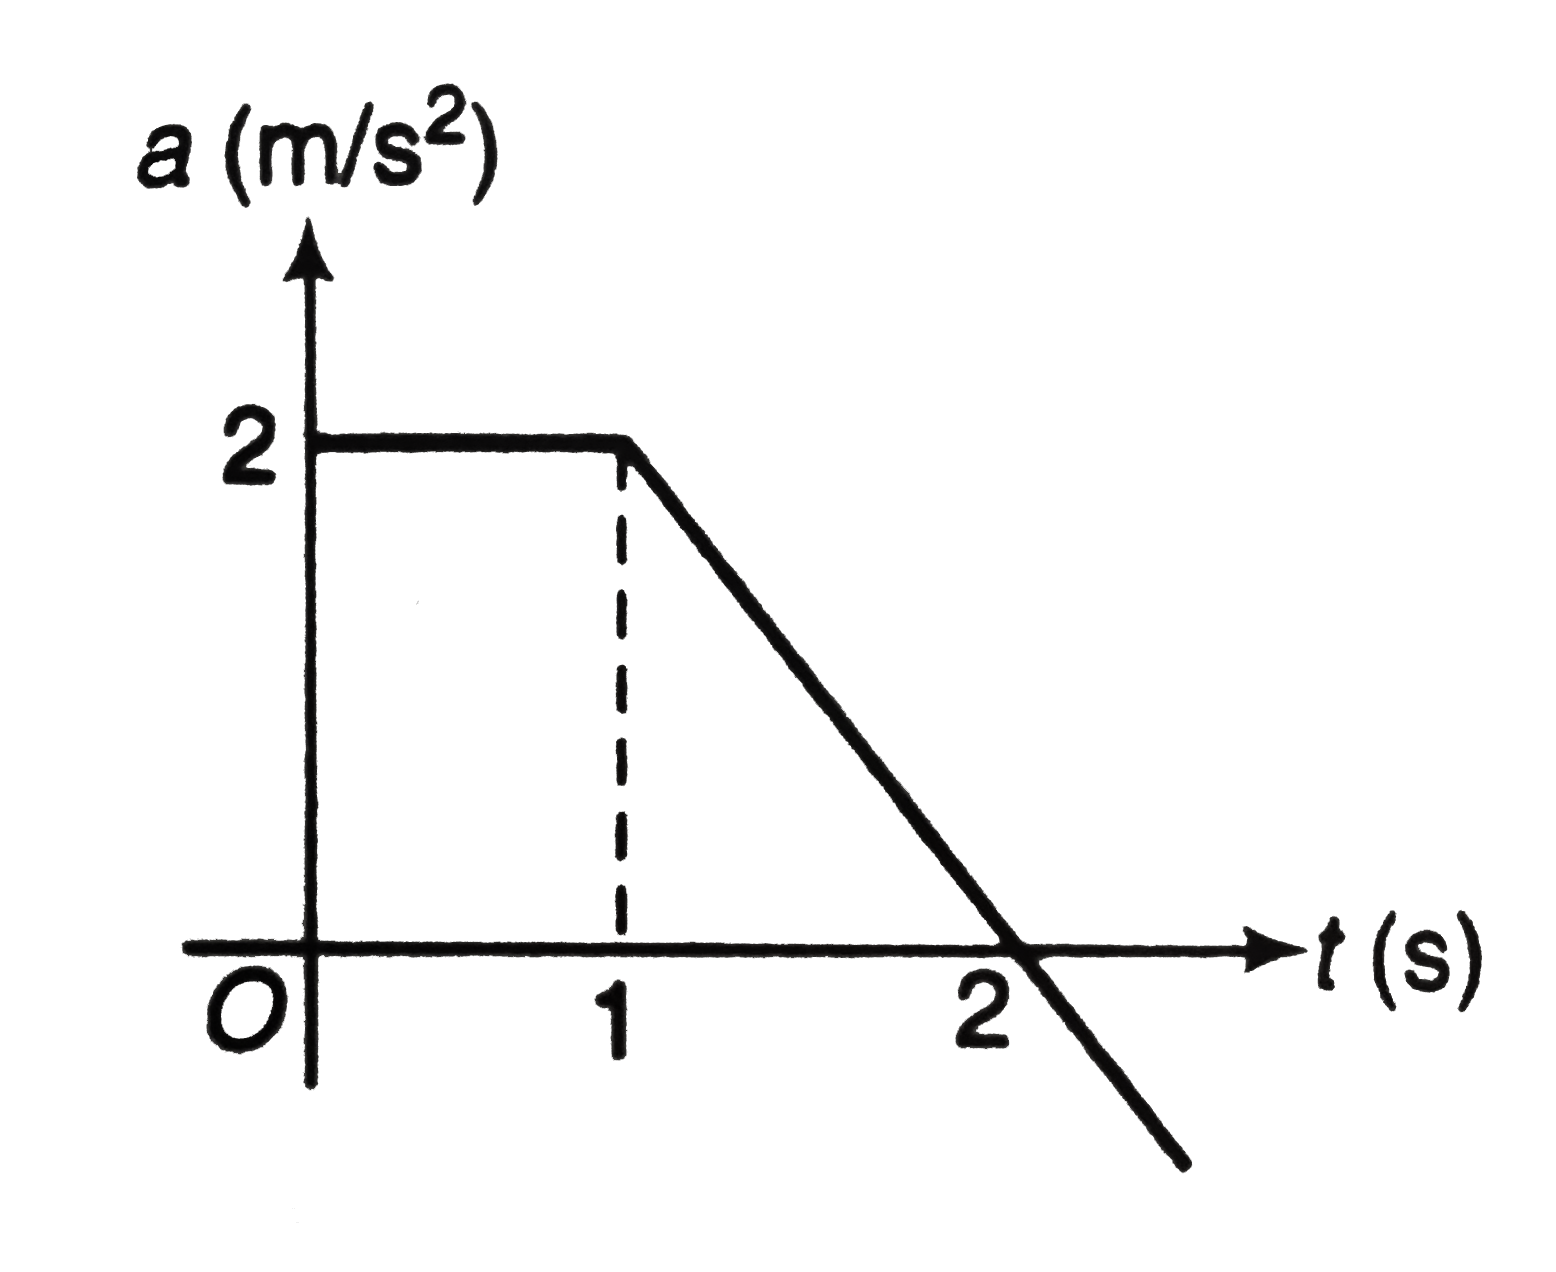
View SolutionFigure shows the acceleration-time graph of a particle moving along a straight line. After what time the particle acquires its initial velocity?
 View Solution
Knowledge Check
- Question 1 - Select One
The acceleration-time graph of a particle moving along a straight line is as shown in figure. At what time the particle acquires its initial velocity ?
 A12 sec.B6 sec.C8 sec.D16 sec.
 - Question 2 - Select One
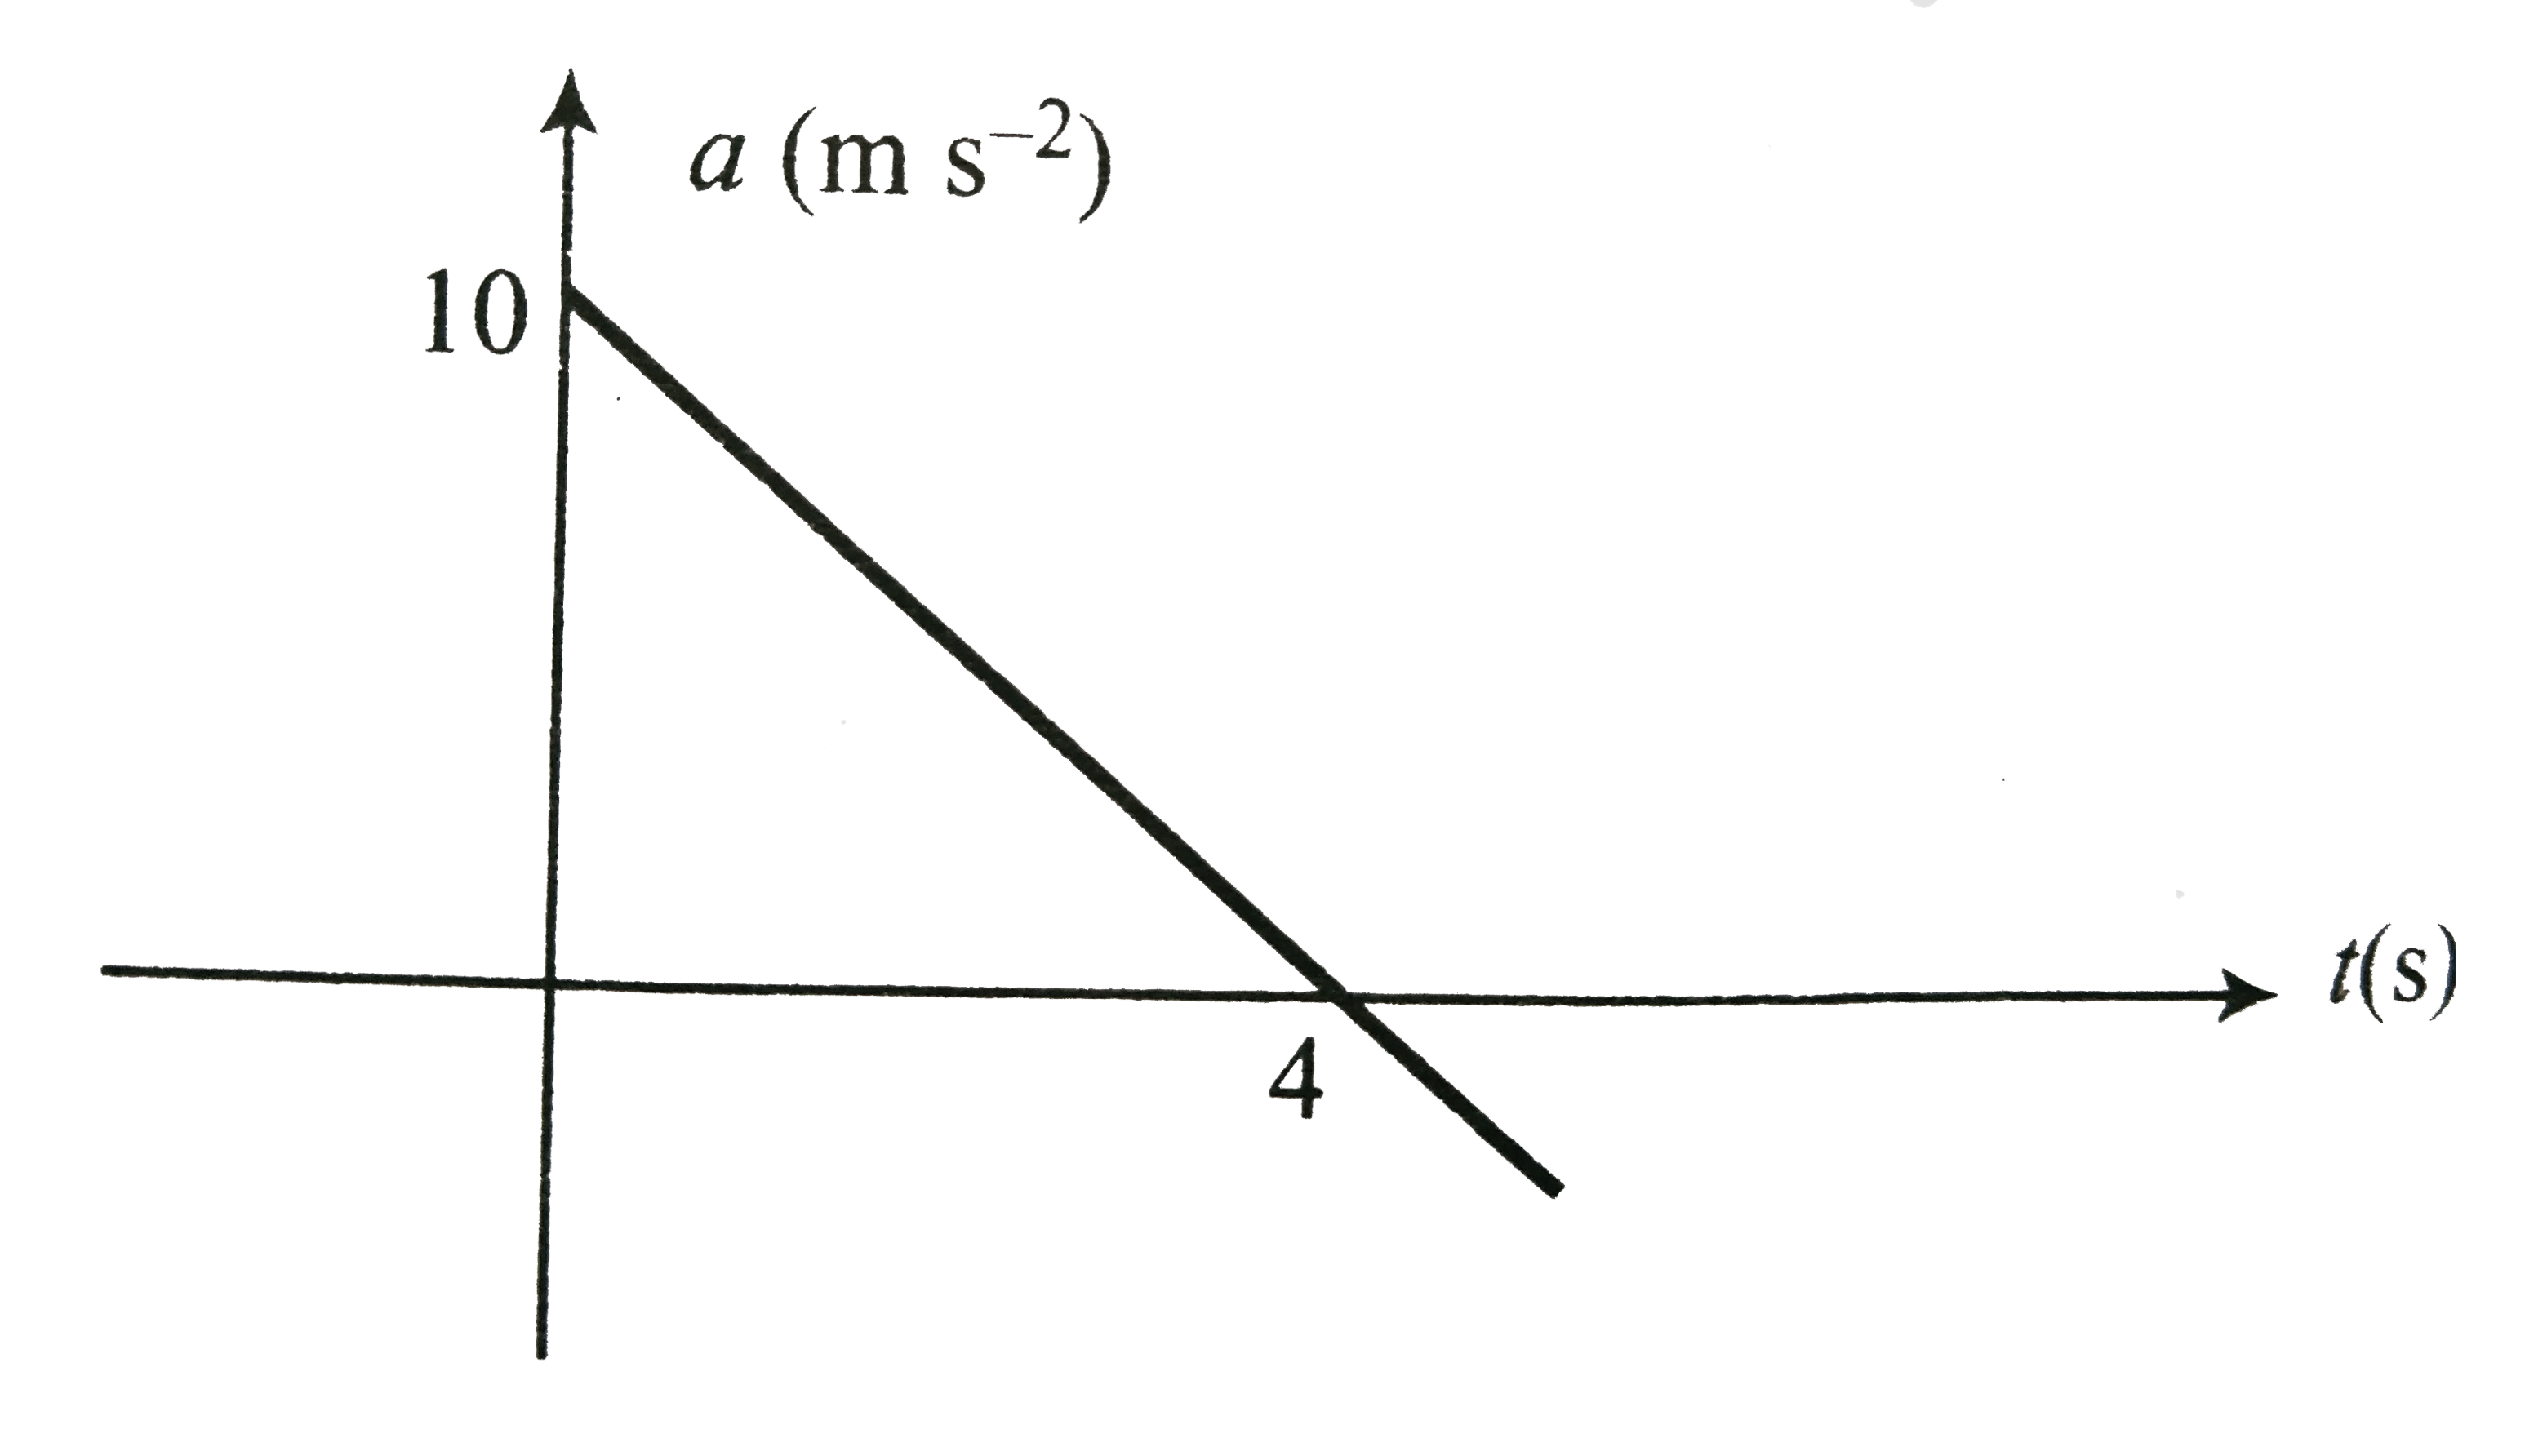
The acceleration-time graph of a particle moving along a straight line is as shown in. At what time the particle acquires its initial velocity?
 .A12sB5sC8sD16s
 - Question 3 - Select One or More
Displacement time graph of a particle moving in a straight line is a shown in figure.
 Ain region A acceleration is positiveBin region B acceleration is negativeCin region C acceleration is positiveDin region D acceleration is negative
The acceleration time graph of a particle moving along a straight line is as shown. The time at which the particle will have the velocity same as initial velocity (in s) is?
View SolutionThe velocity-time plot for a particle moving on a straight line is shown in the figure, then
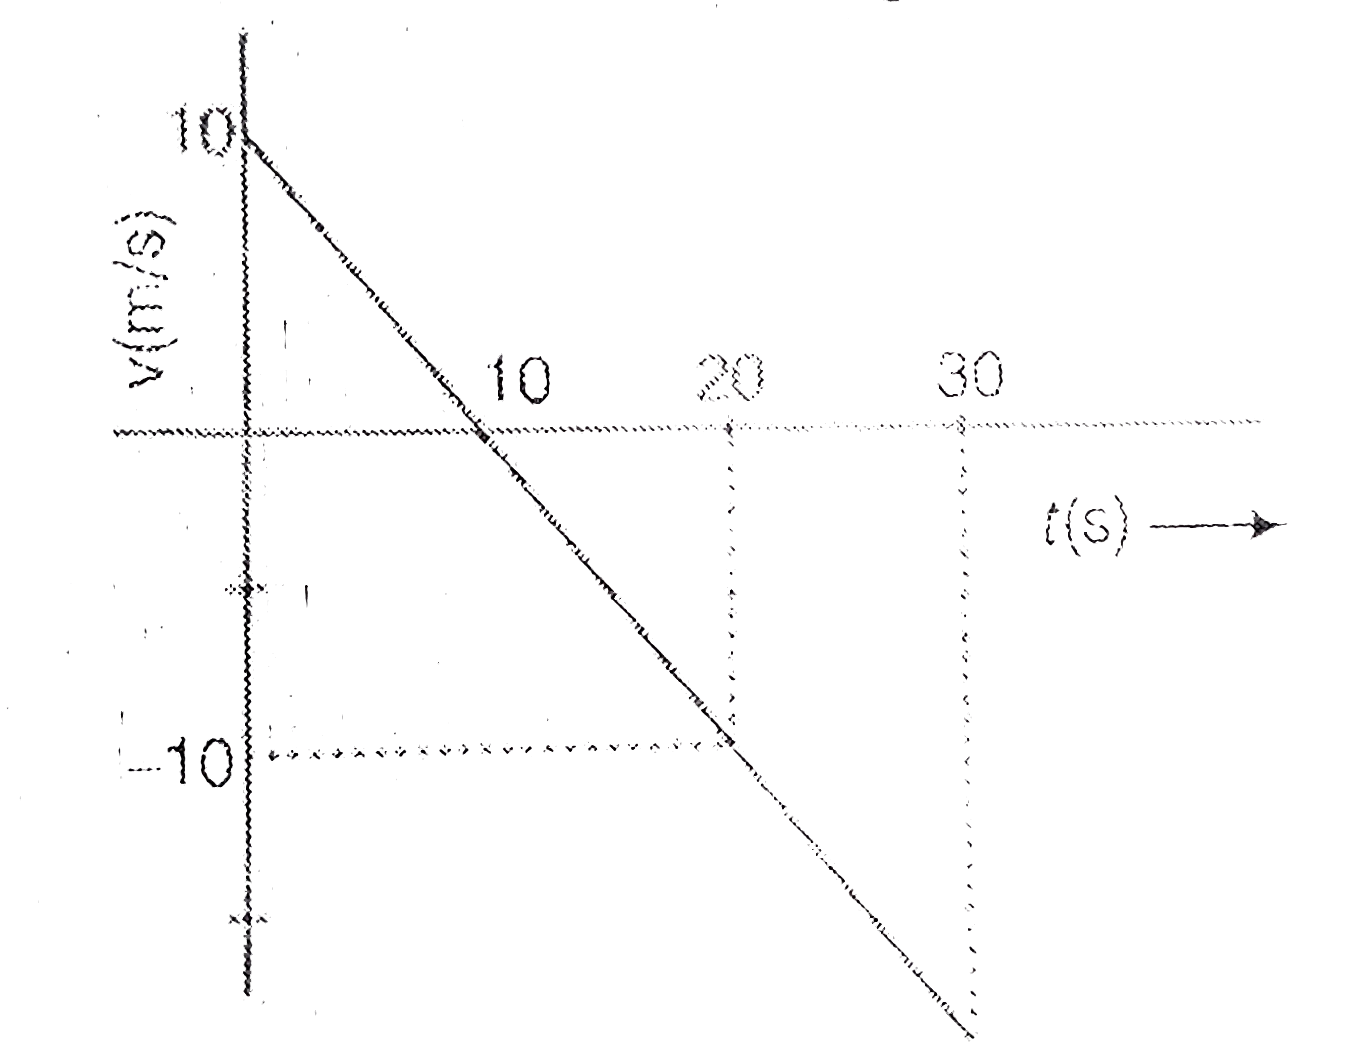 View Solution
The velocity-time graph of a particle moving along a straight line is shown in Figure 2.W7.Is the motion uniform?
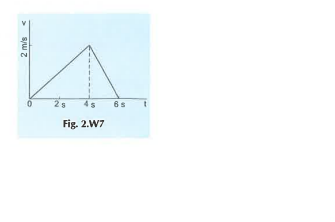 View Solution
The velocity-time plot for a particle moving on a straight line is shown in figure.
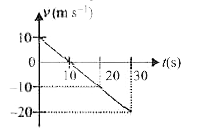 View Solution
The velocity- time plot for a particle moving on a straight line is shown in the figure
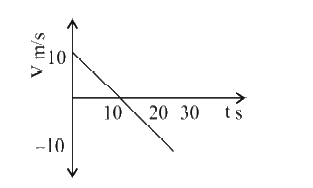 View Solution

