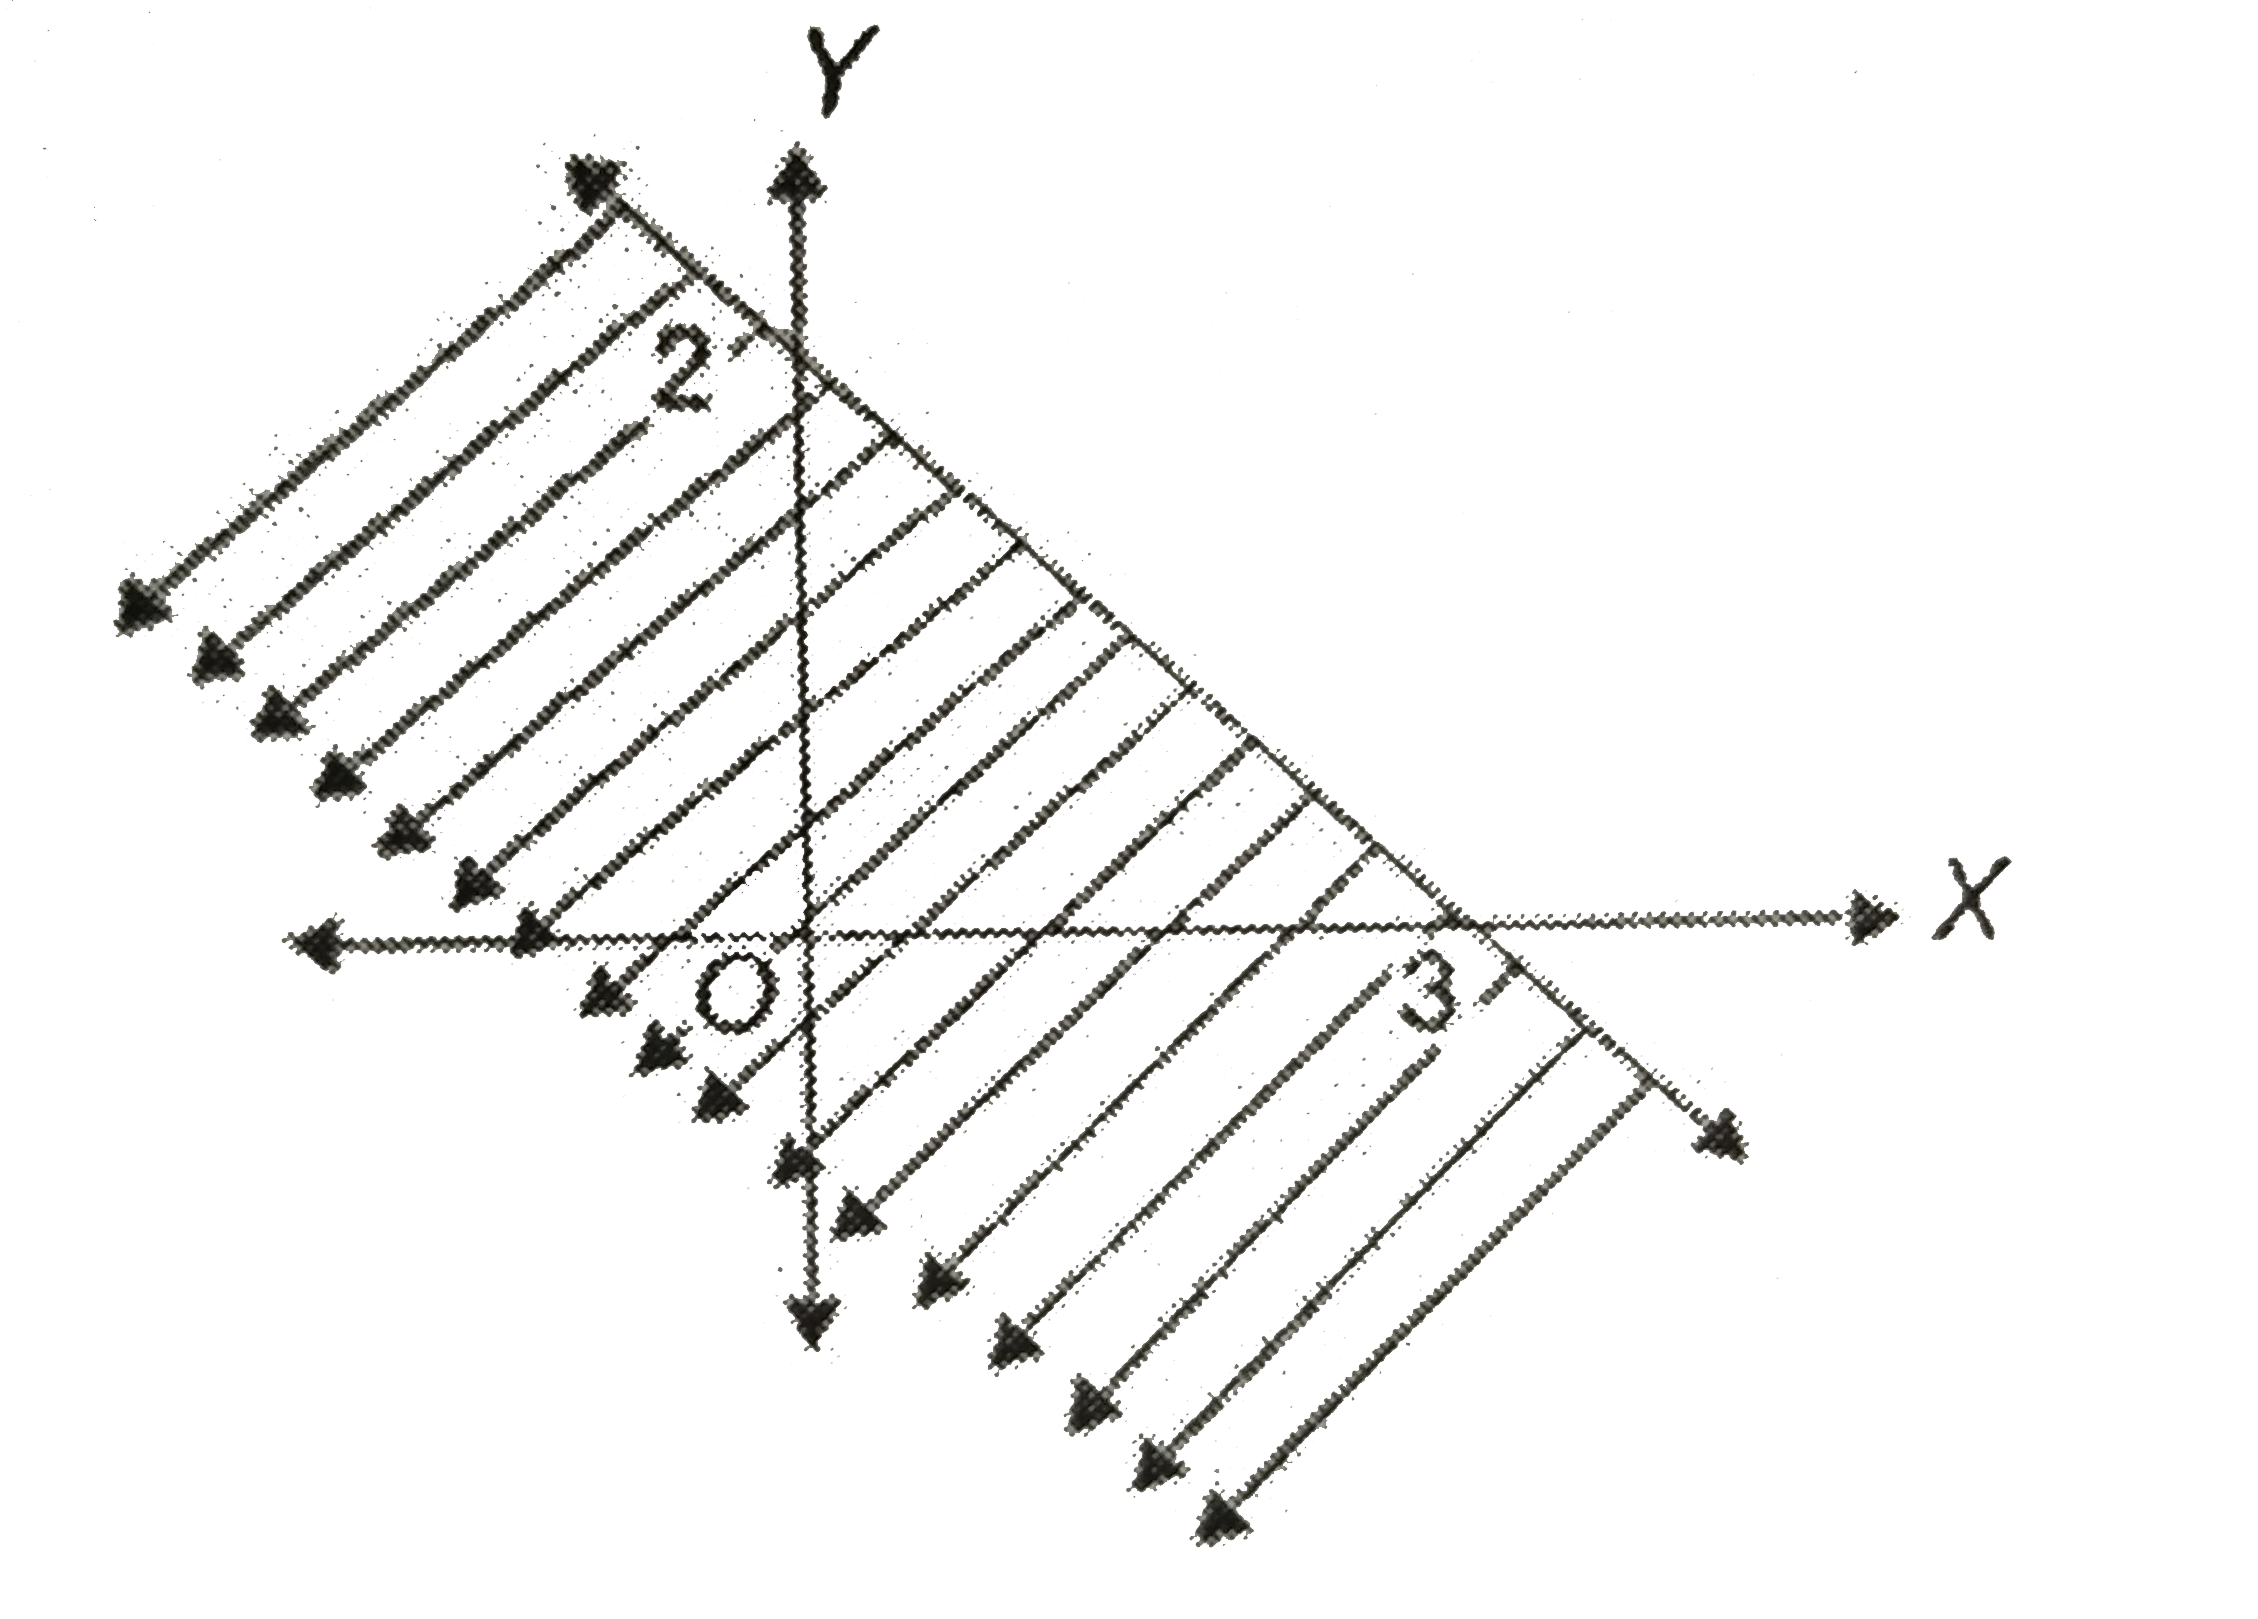
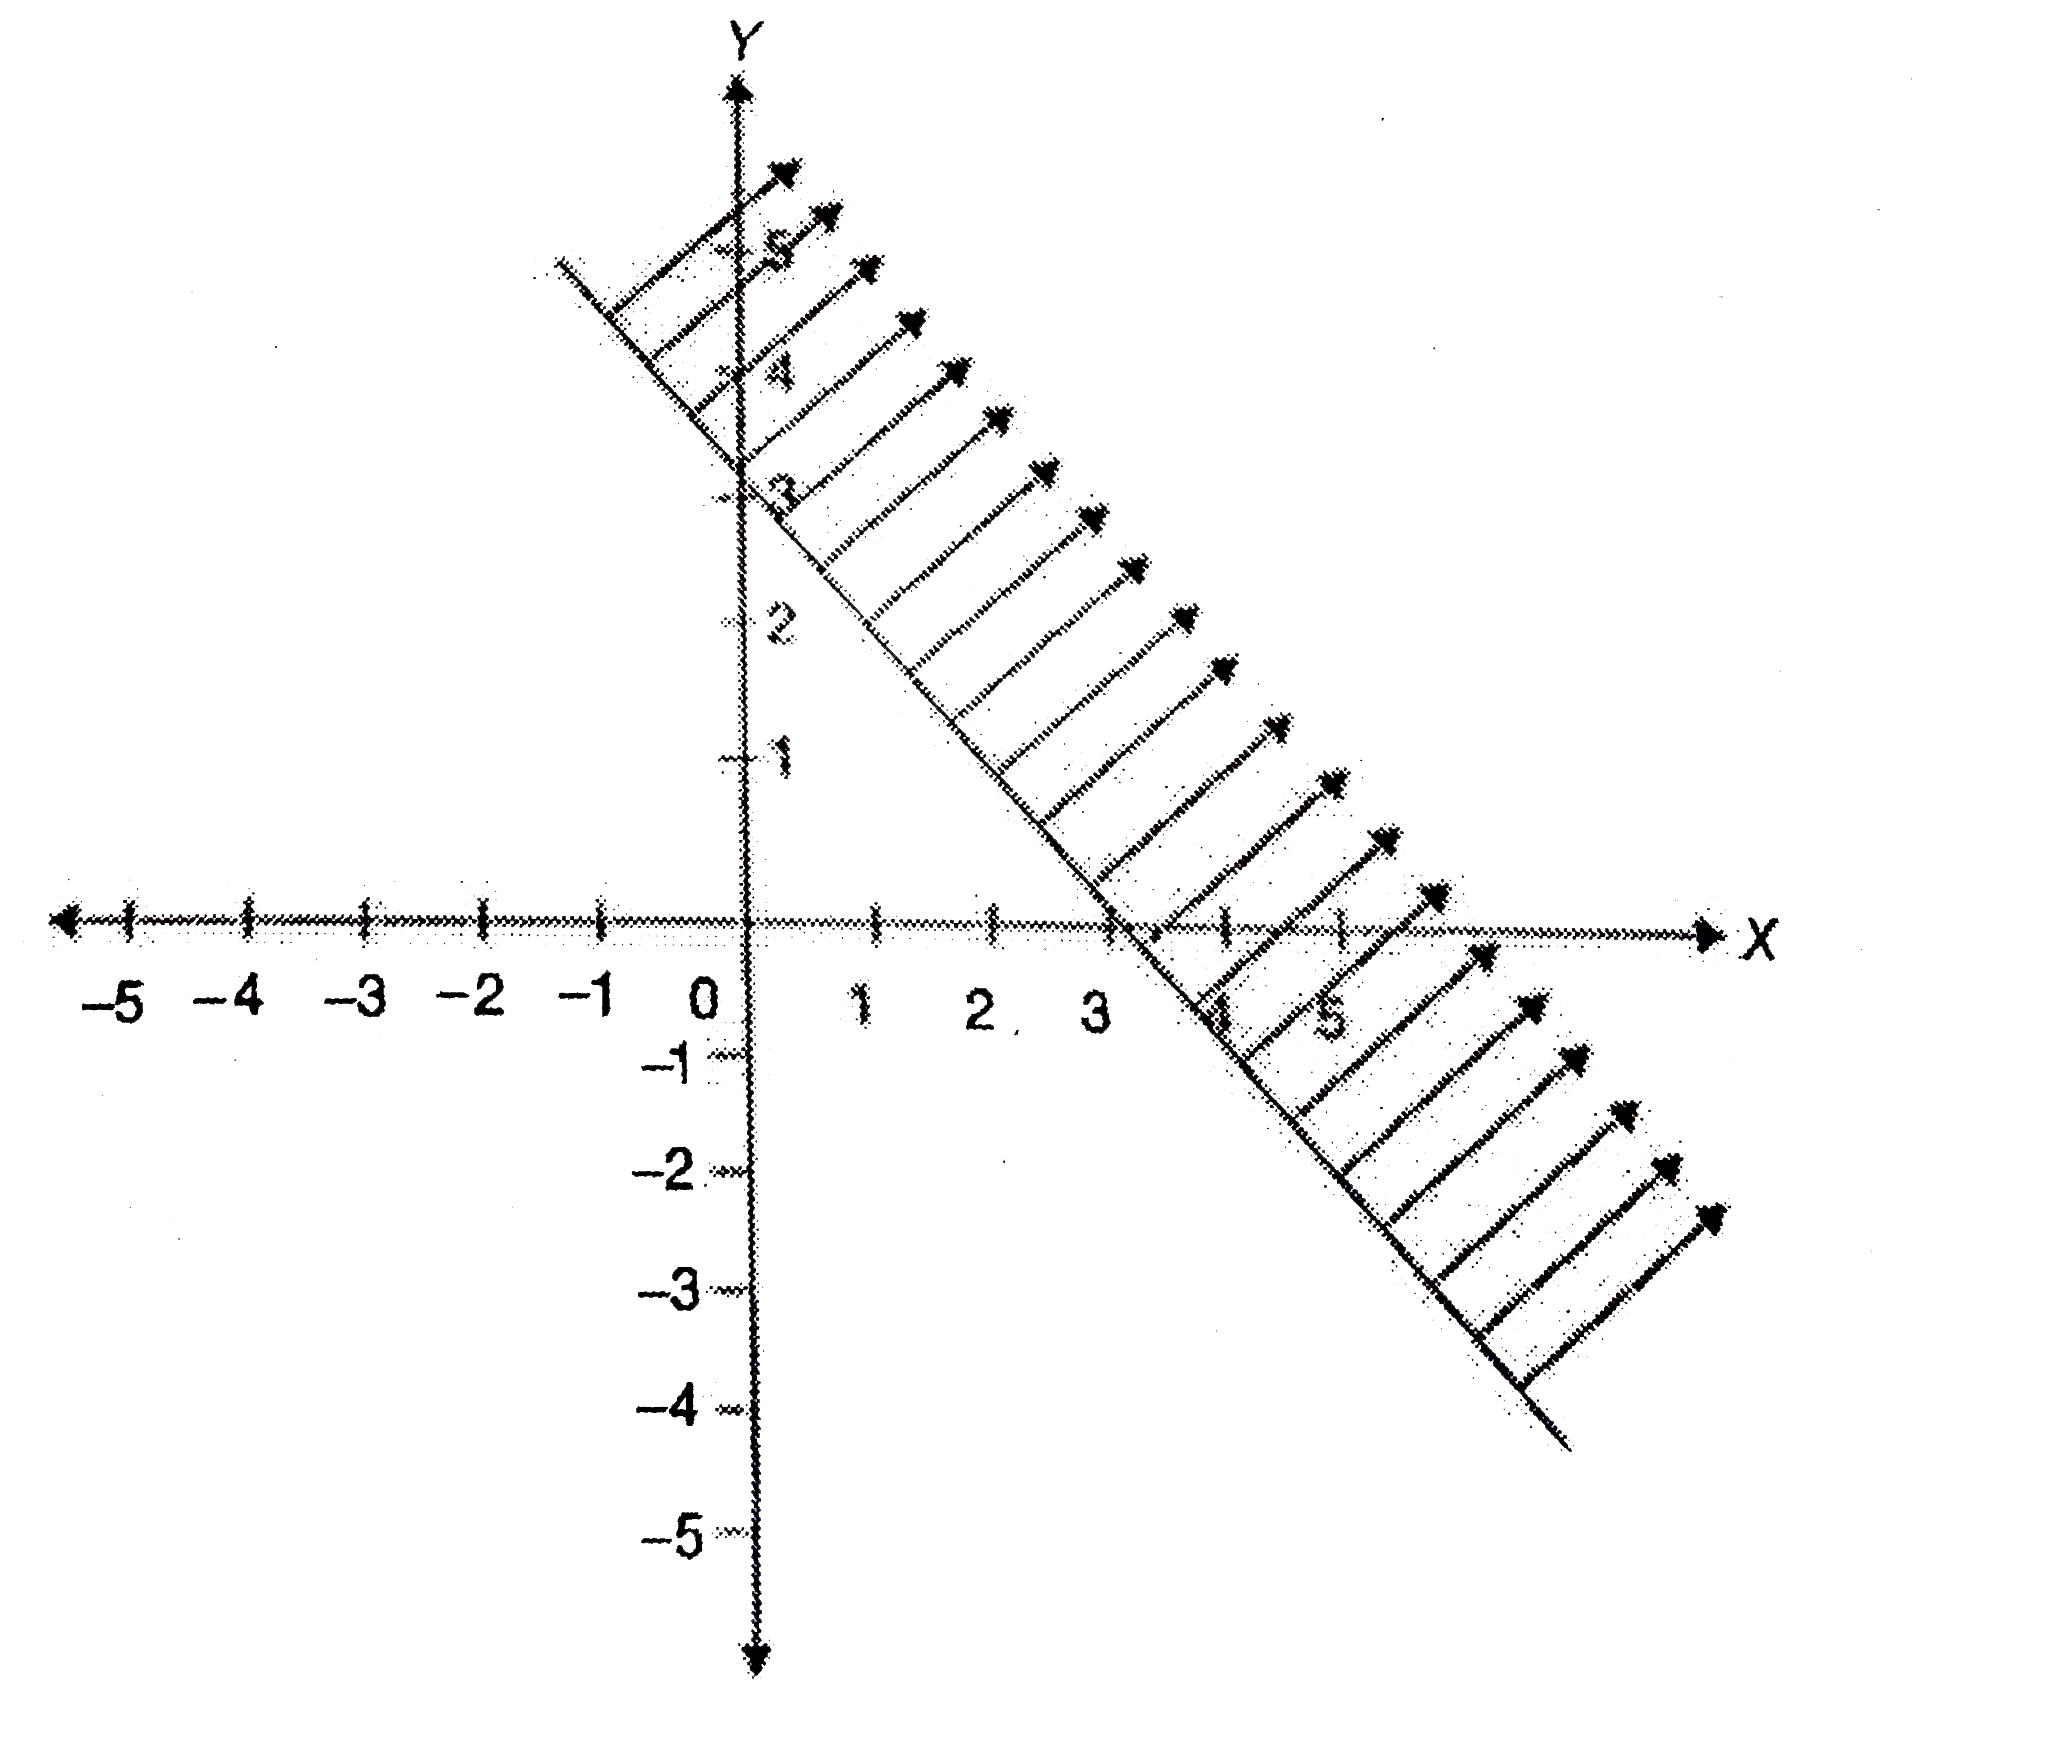
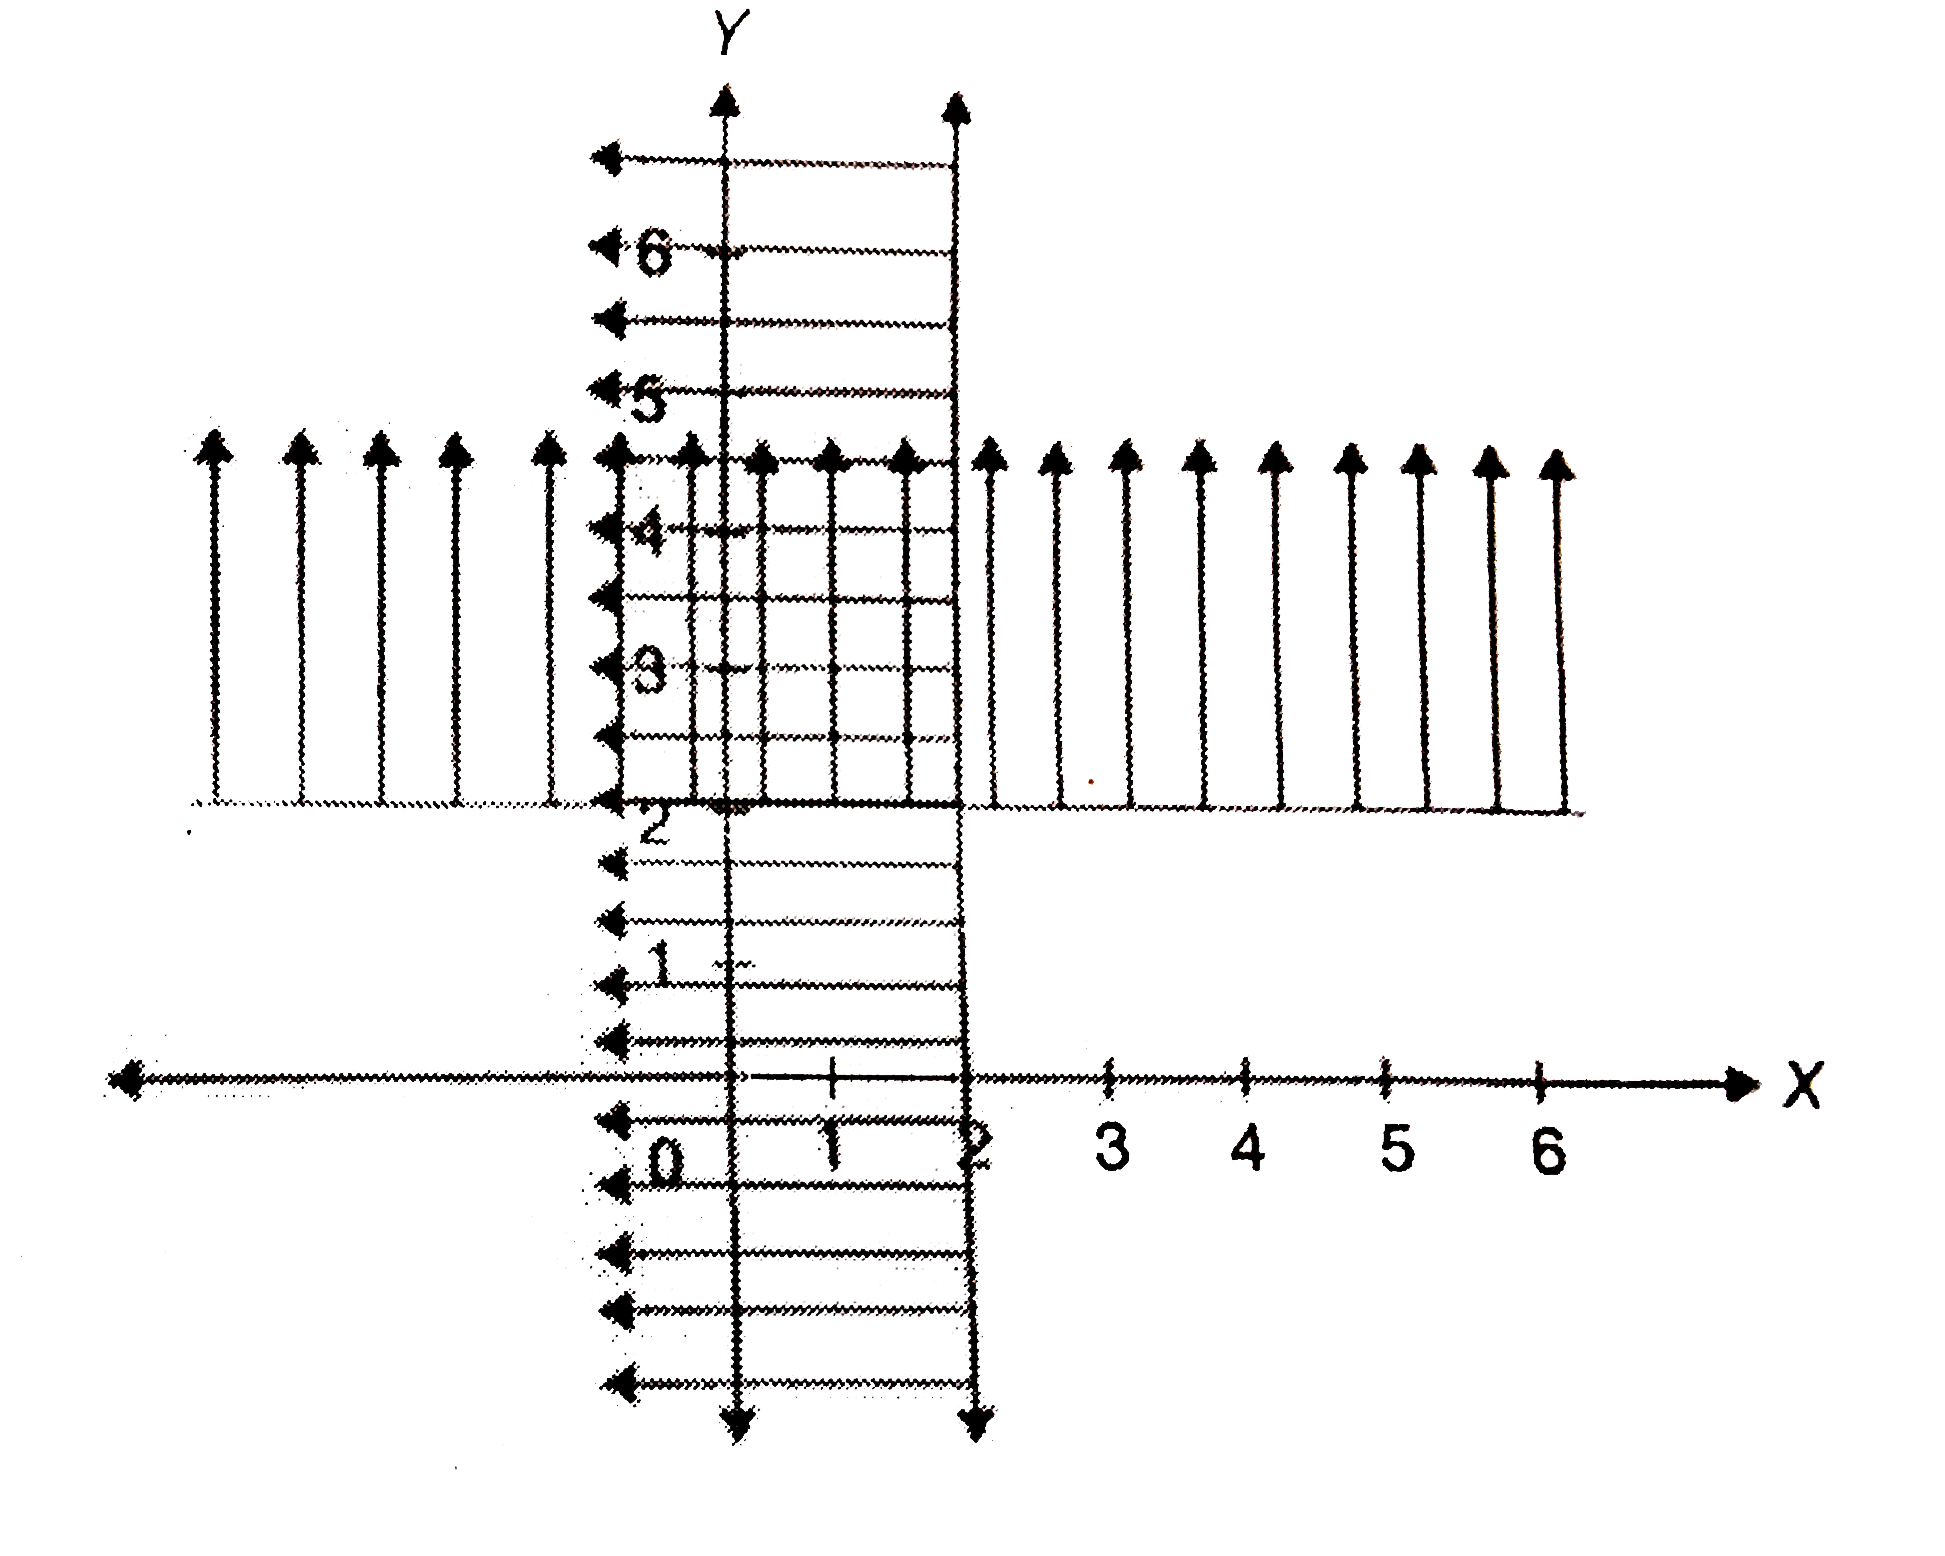
The inequality representing the following graph is |x|<3 b. |x|≤3 c. |x|>3 d. |x|≥3
Step by step video & image solution for The inequality representing the following graph is |x|<3 b. |x|lt=3 c. |x|>3 d. |x|geq3 by Maths experts to help you in doubts & scoring excellent marks in Class 11 exams.
Updated on:21/07/2023Similar Questions
The inequality representing the following graph is |x|<3 b. |x|≤3 c. |x|>3 d. |x|≥3
View SolutionThe inequation represent by the following graph is

View SolutionInequation that represents the following graph is _____

View SolutionInequations that represents the shaded region of the following graph is ____

View SolutionRepresent the following inequations graphically:
y+8≥2x.
View SolutionRepresent the following inequations graphically:
x−2y≤−1
View SolutionSolve the inequalities and represent the solution graphically on number line. 3x−7>2(x−6),6−x>11−2x.
View SolutionState true or false for the following.
The inequality |z−4|<|z−2| represents the region given by x>3.
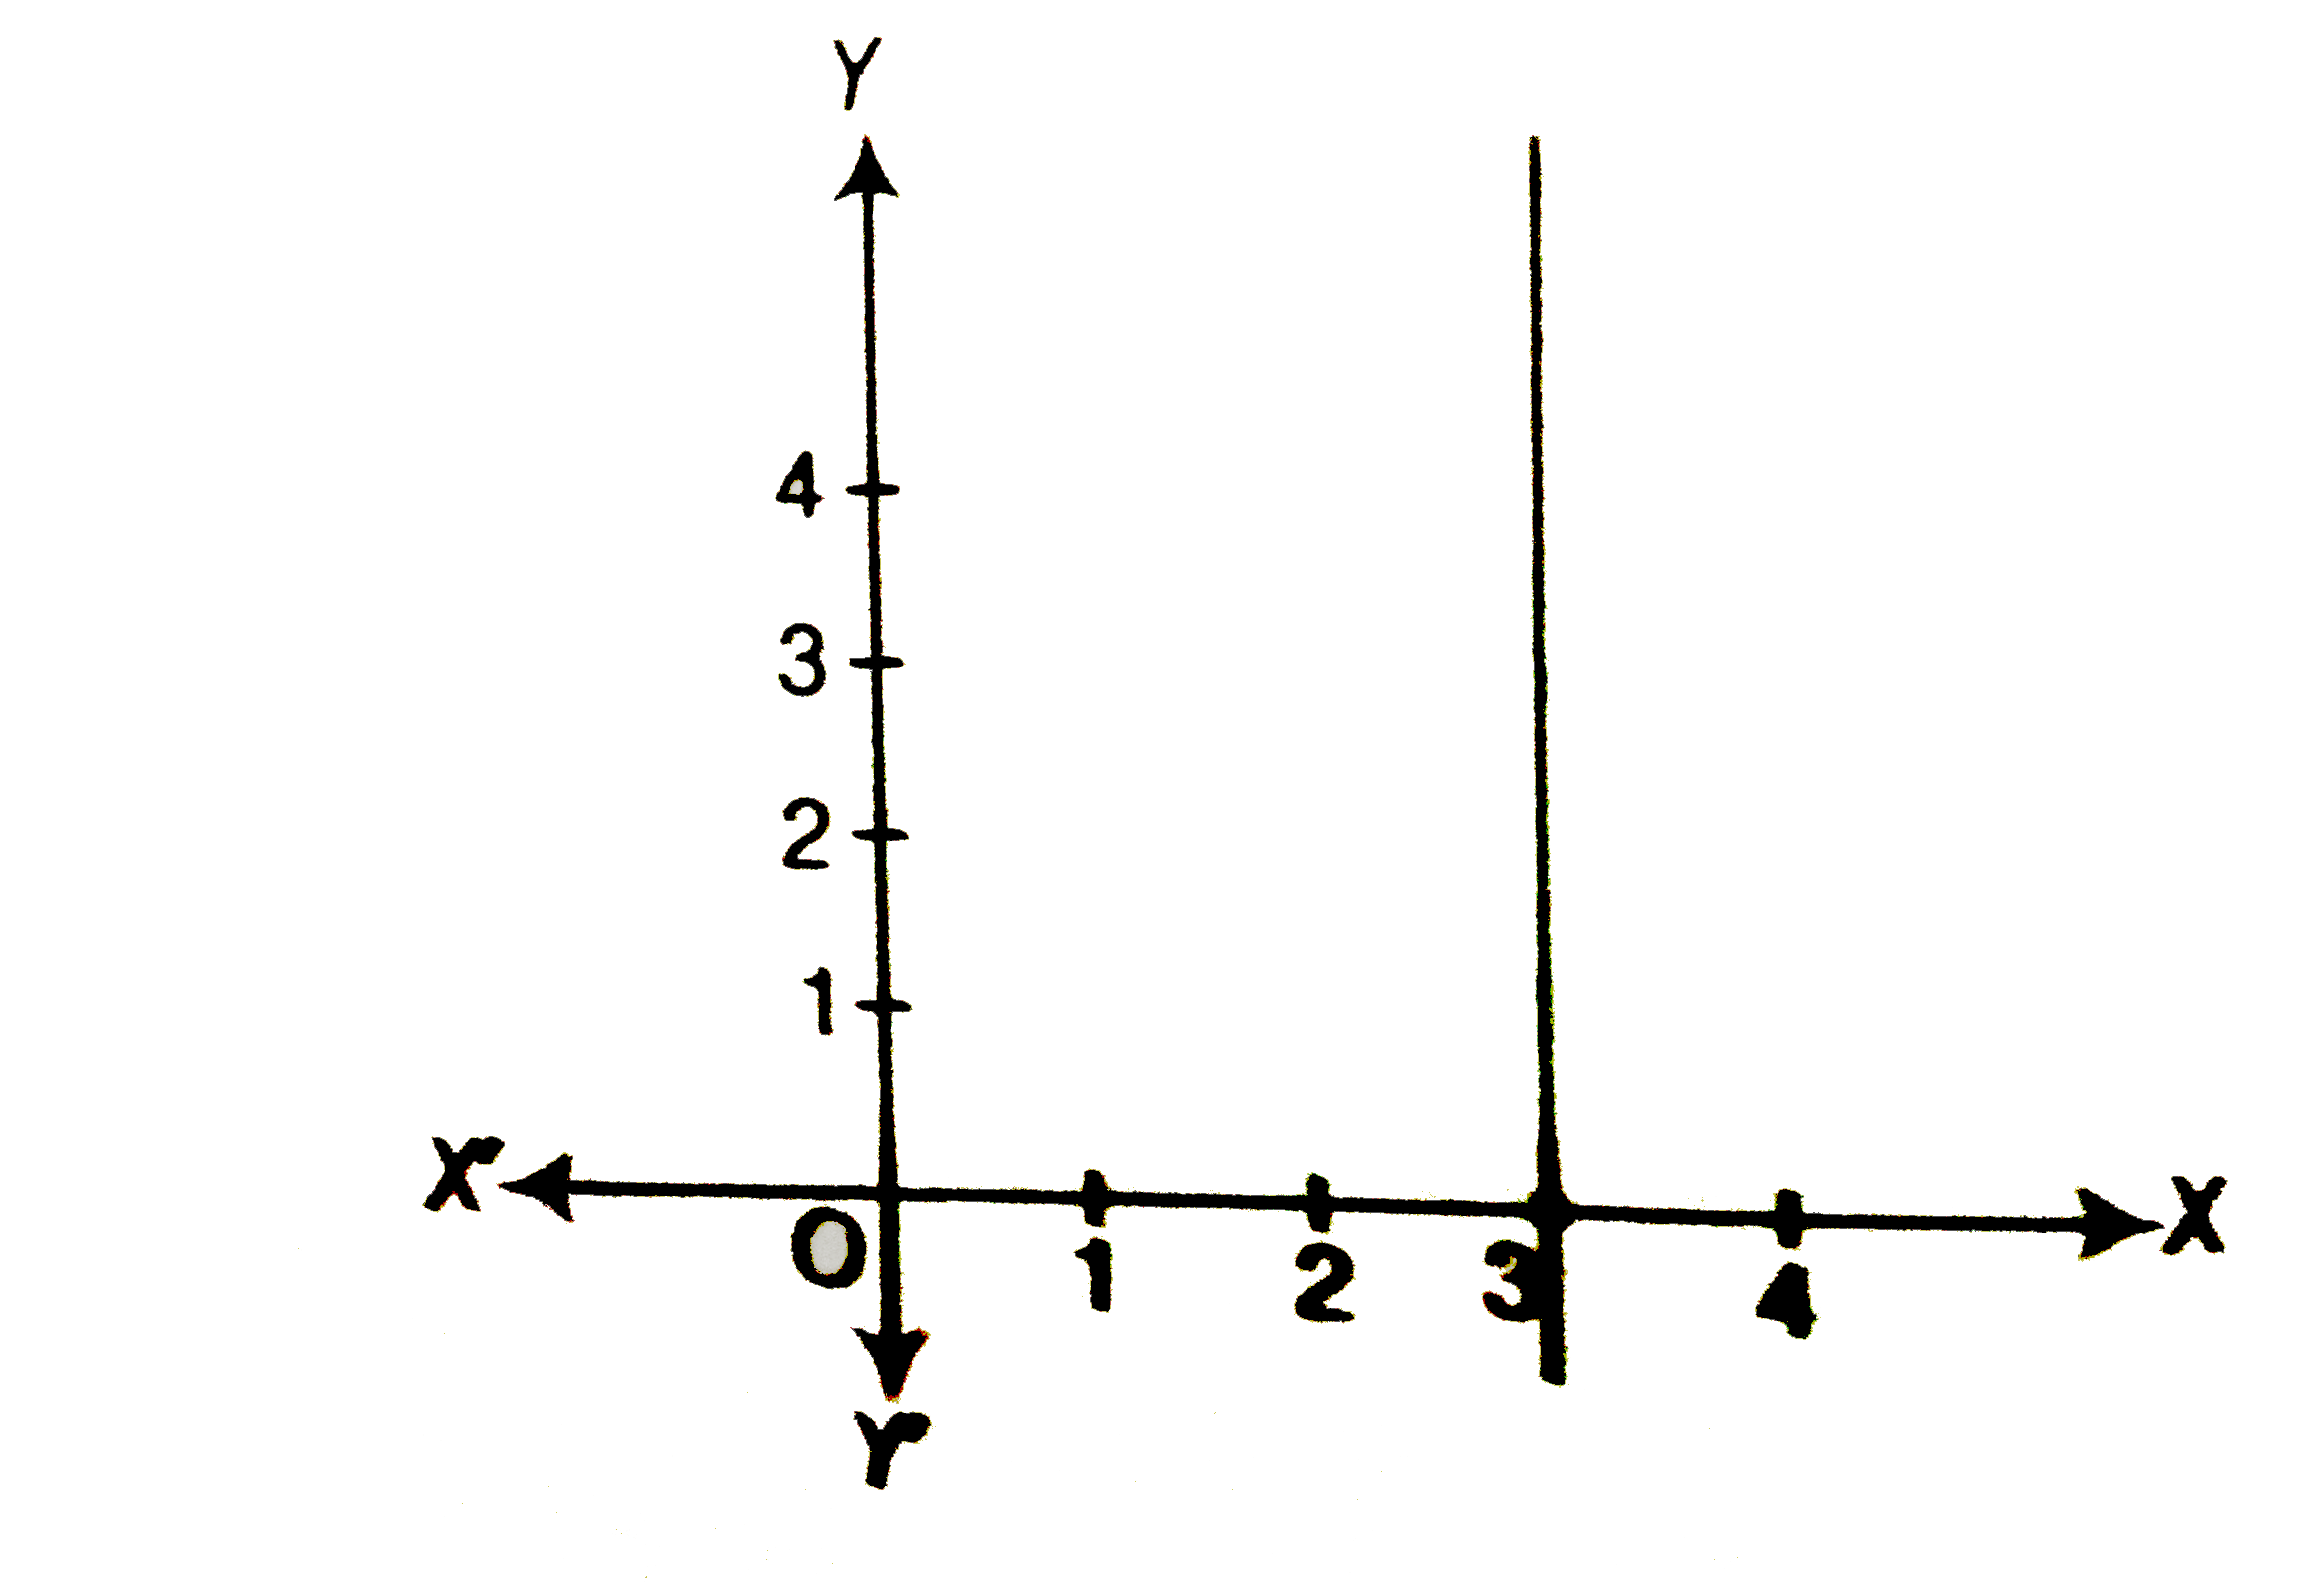
View SolutionThe graph given below represents the linear equation x=3.

View SolutionRepresent the following inequations on the number line
x≤3
View Solution
