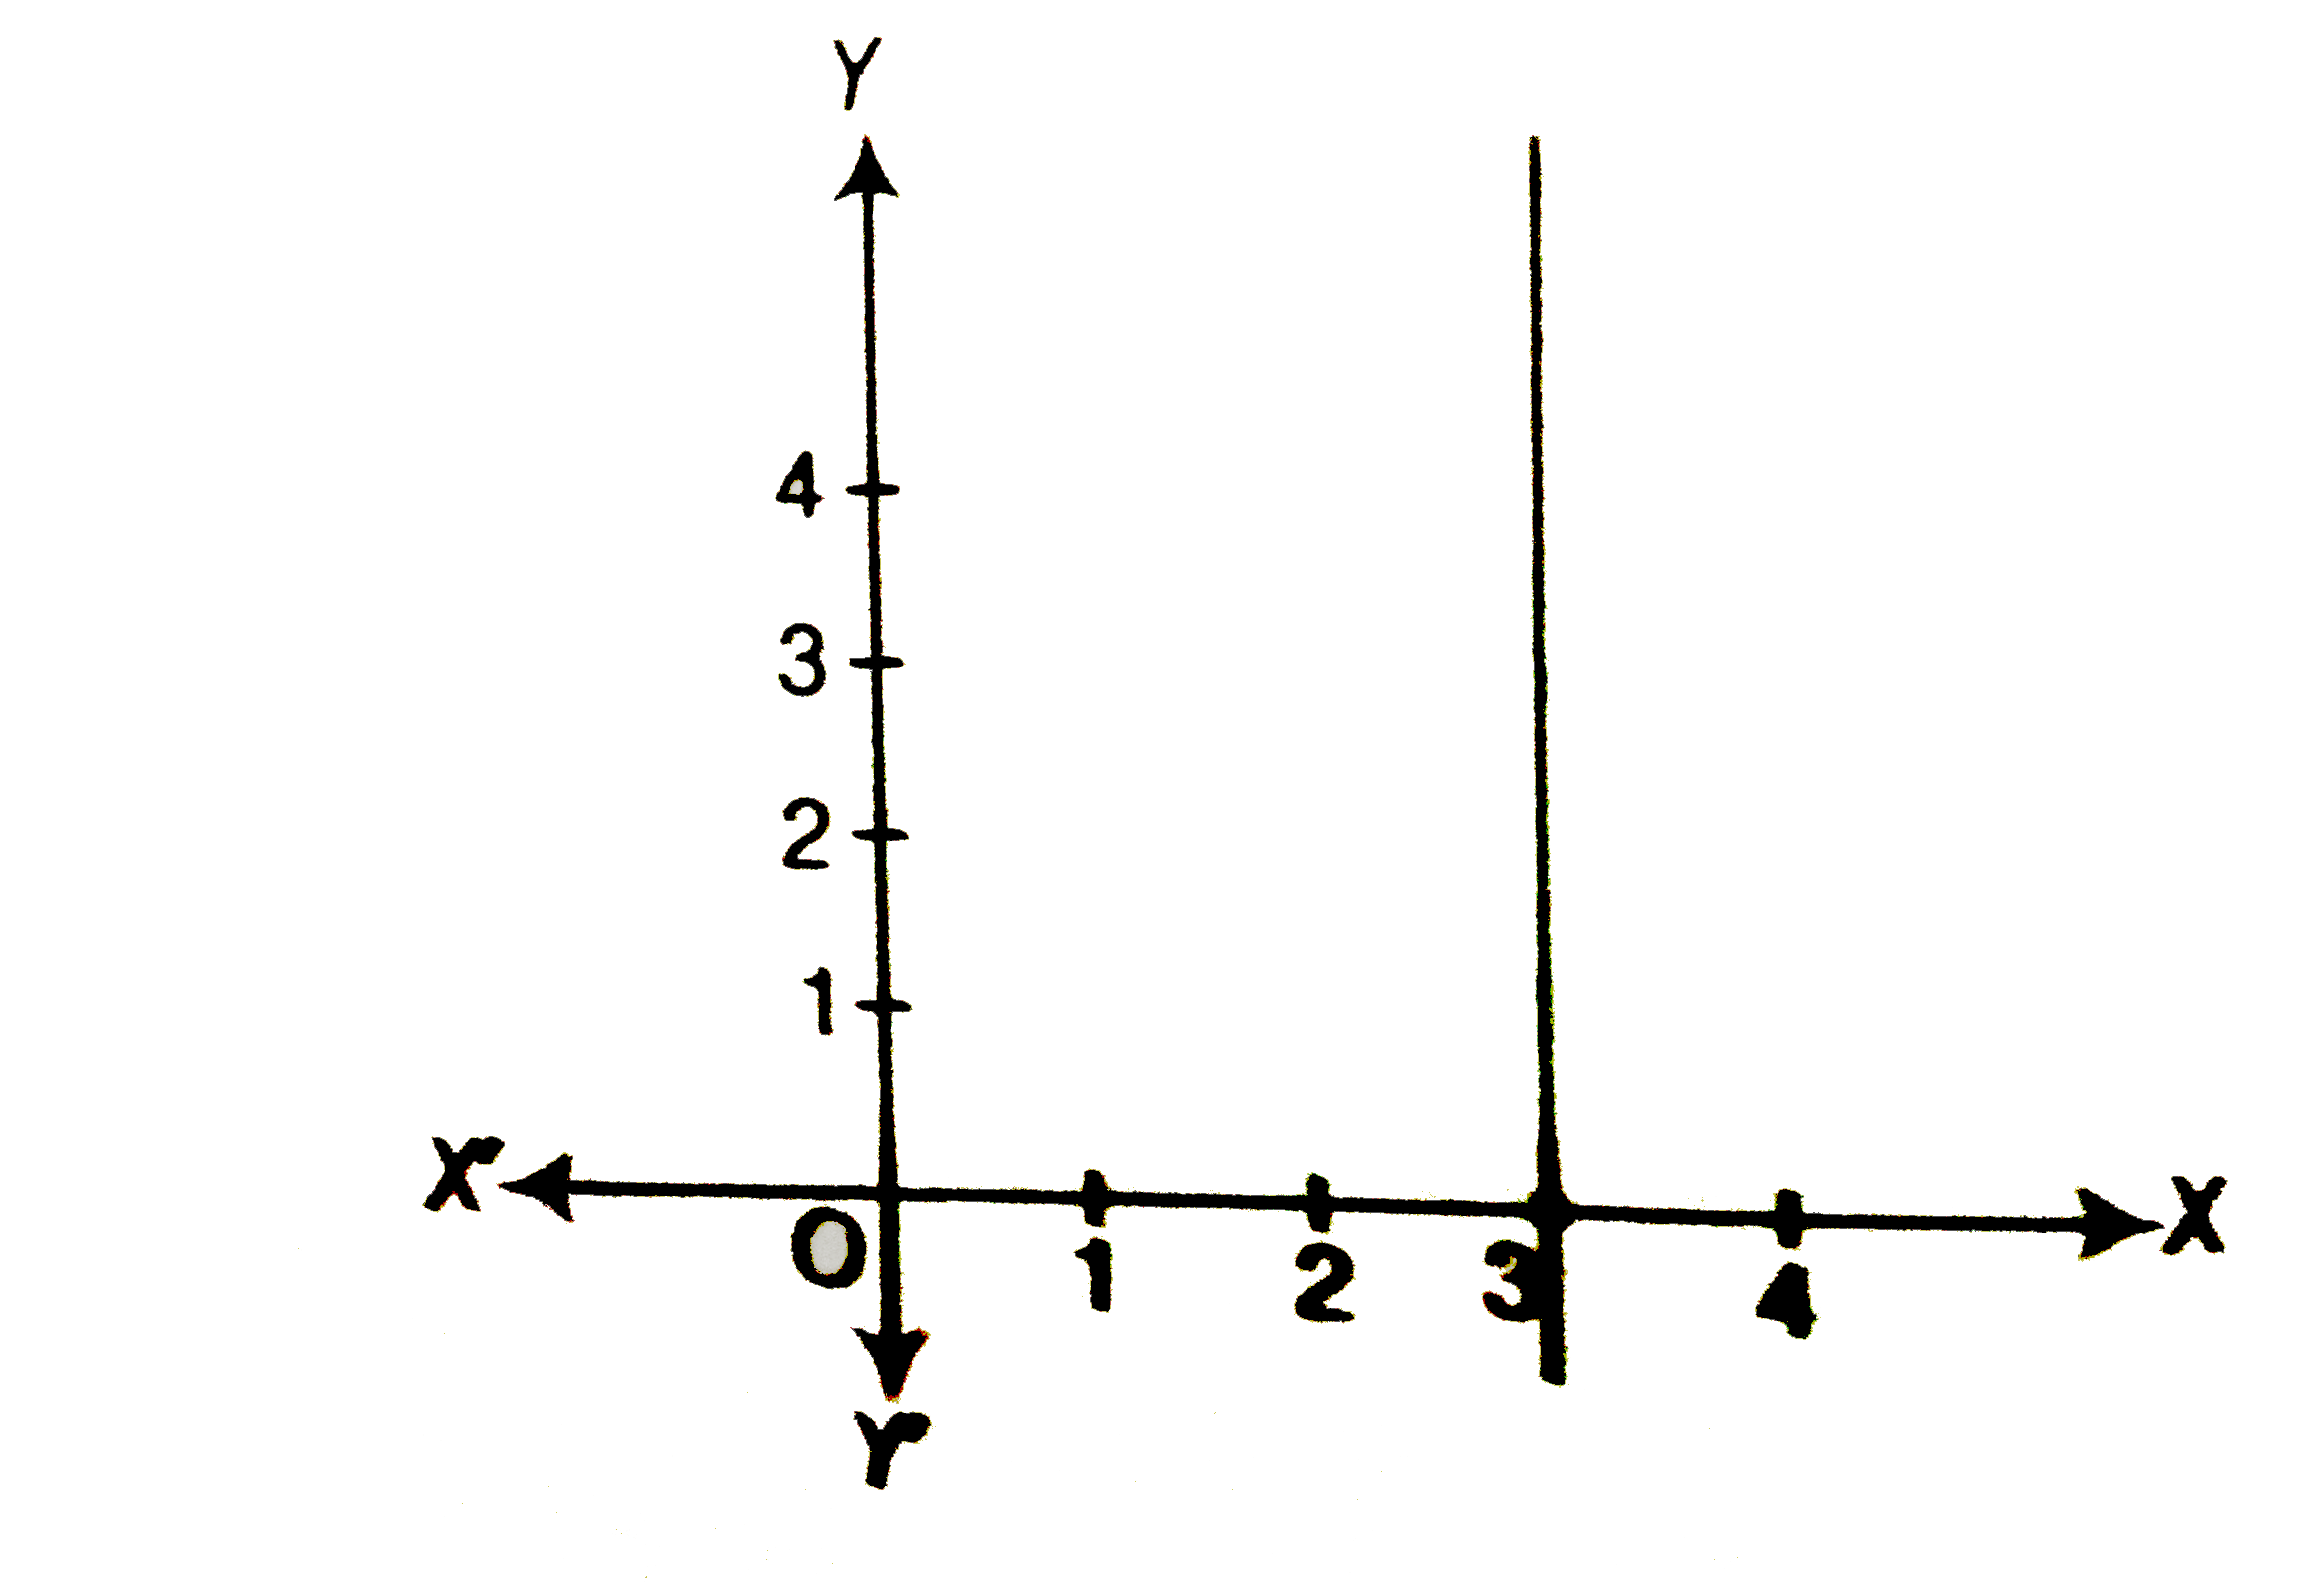
The graph given below represents the linear equation x=3.
Video Solution
Text Solution
True
Since, given graph is a line parallel to Y-axis at a distance 3 units to thr right of the orgin. Hence, it represents a linear equation x=3.
|
Updated on:21/07/2023
Topper's Solved these Questions
Similar Questions
Knowledge Check
- Question 1 - Select One
The graph given below represents the interconversion of ice to water vapour. Identify the point in the curve which indicates the boiling point of water.
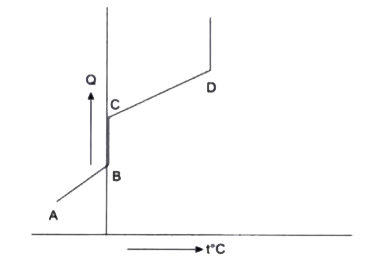 ABBACCDD
 - Question 2 - Select One
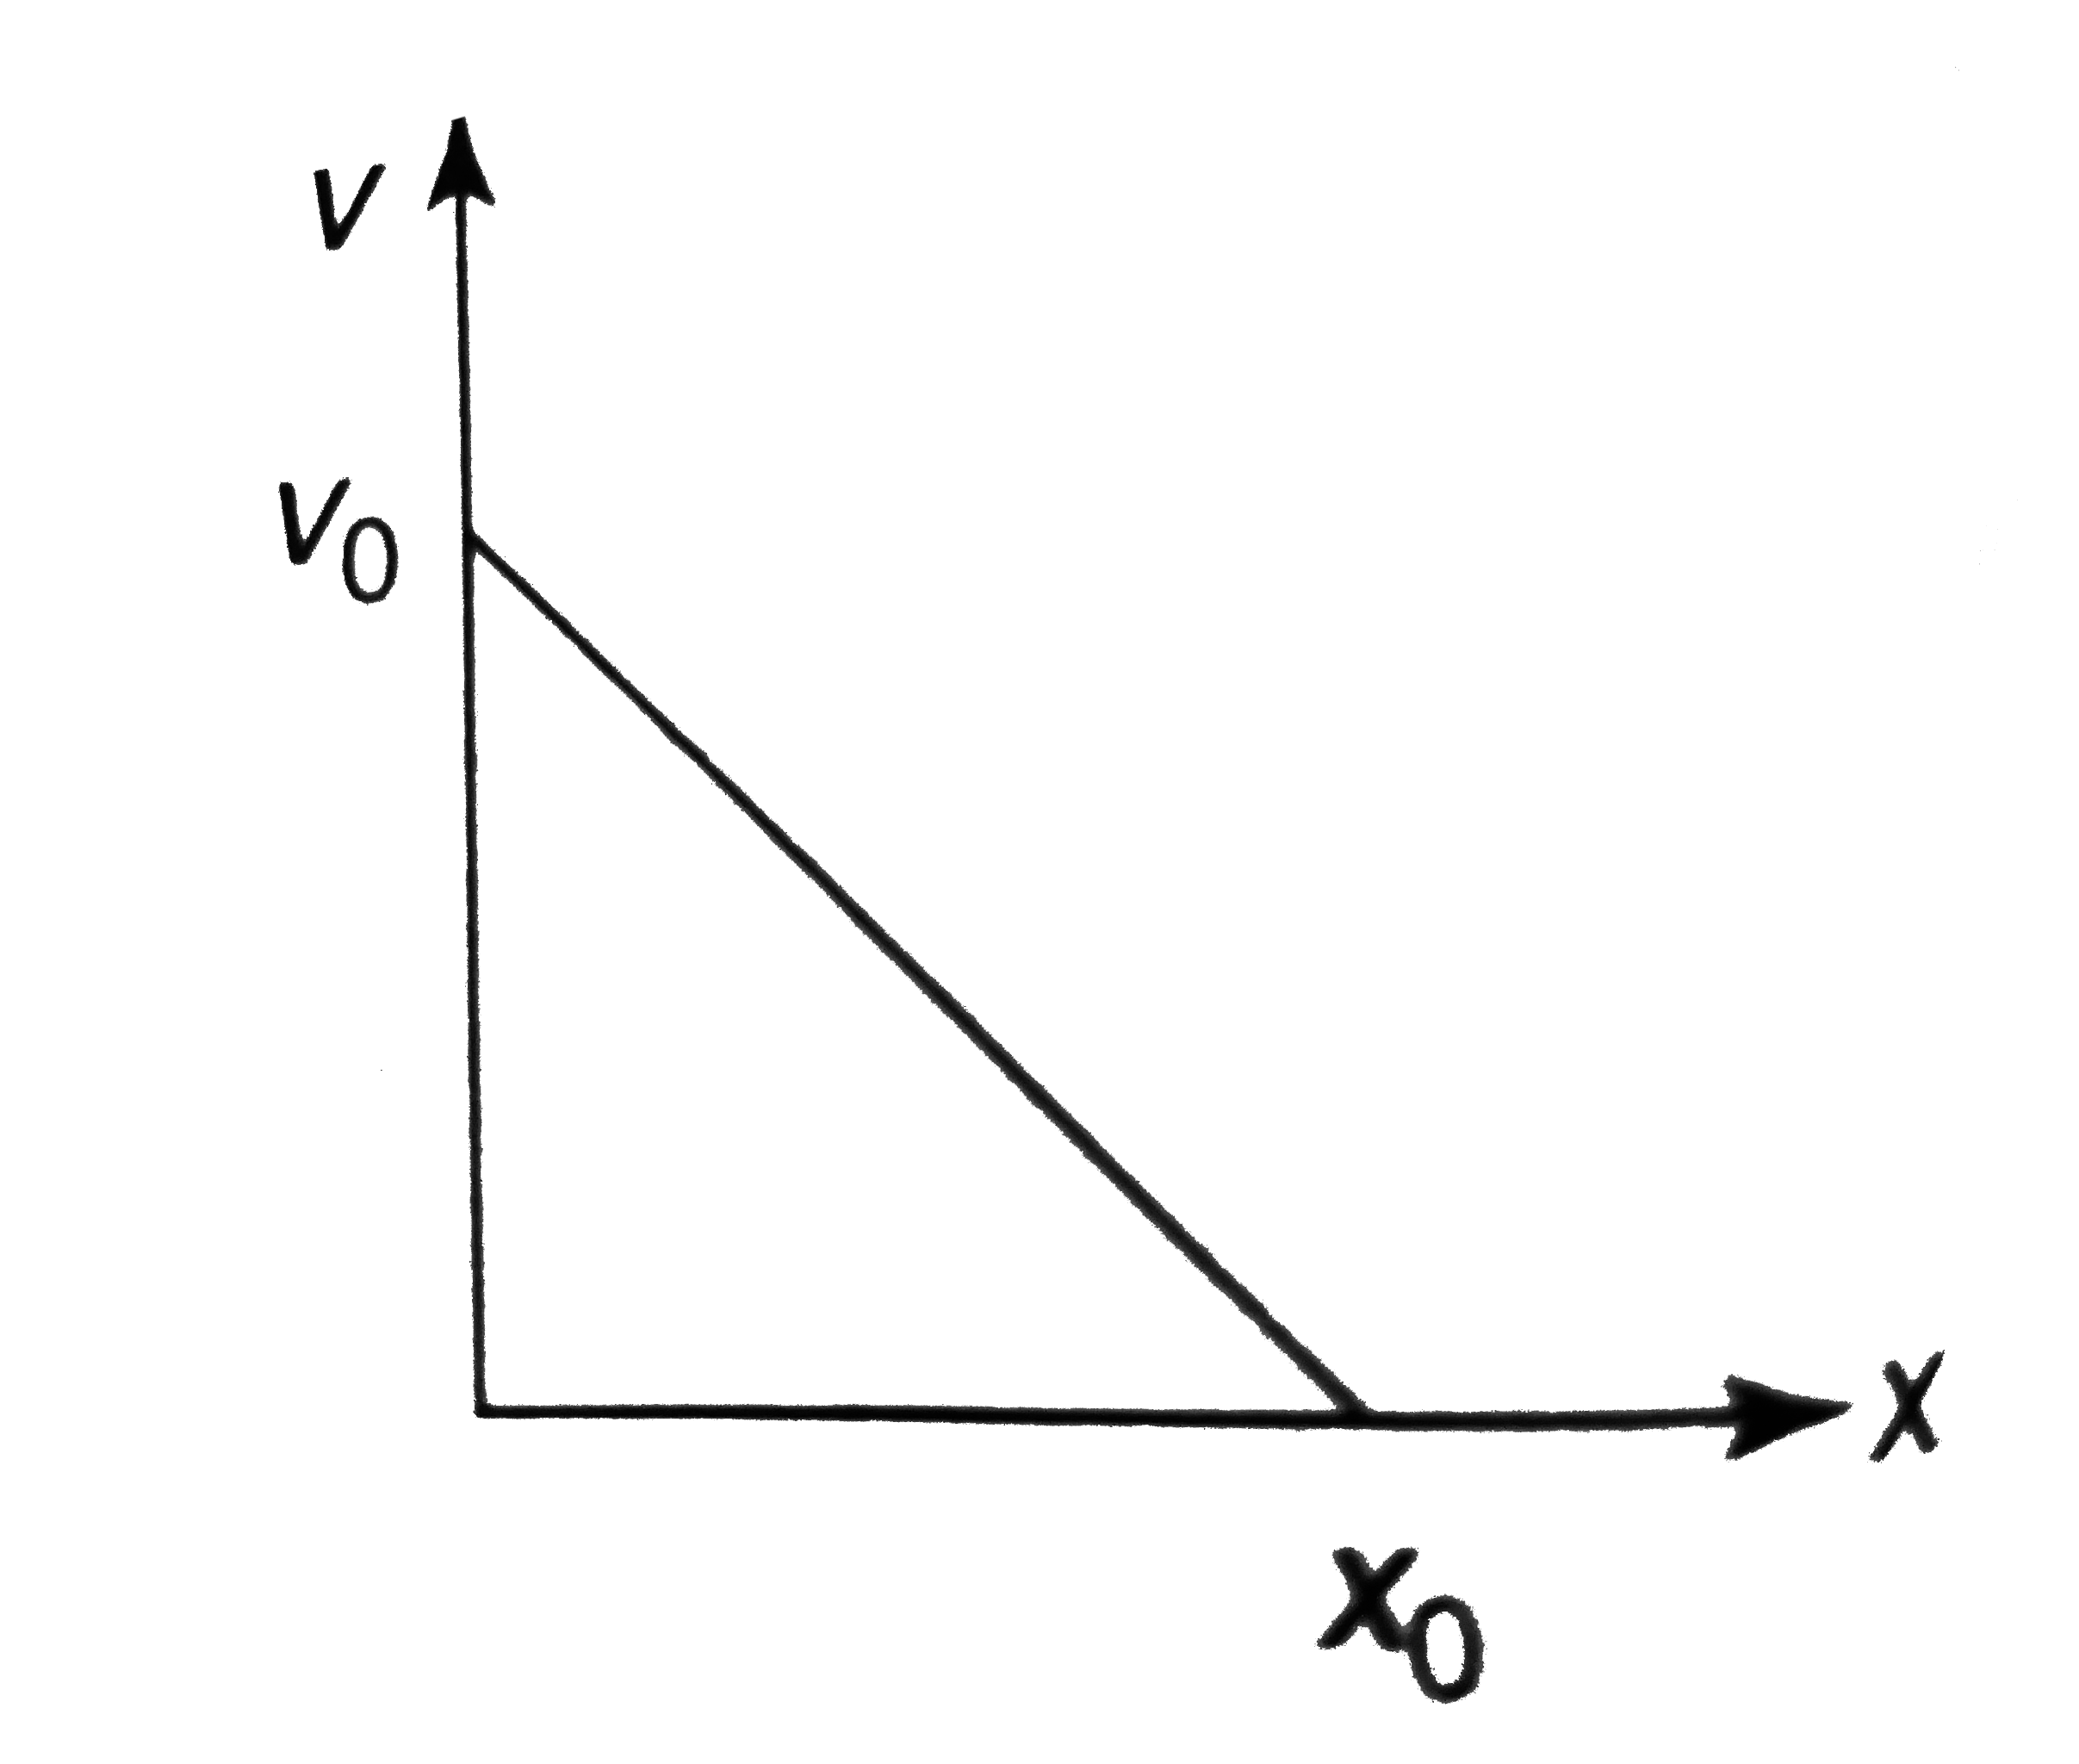
The given graph shows the variation of velocity with displacement. Which one of the graphs given below correctly represents the variation of acceleration with displacement ?
 A
A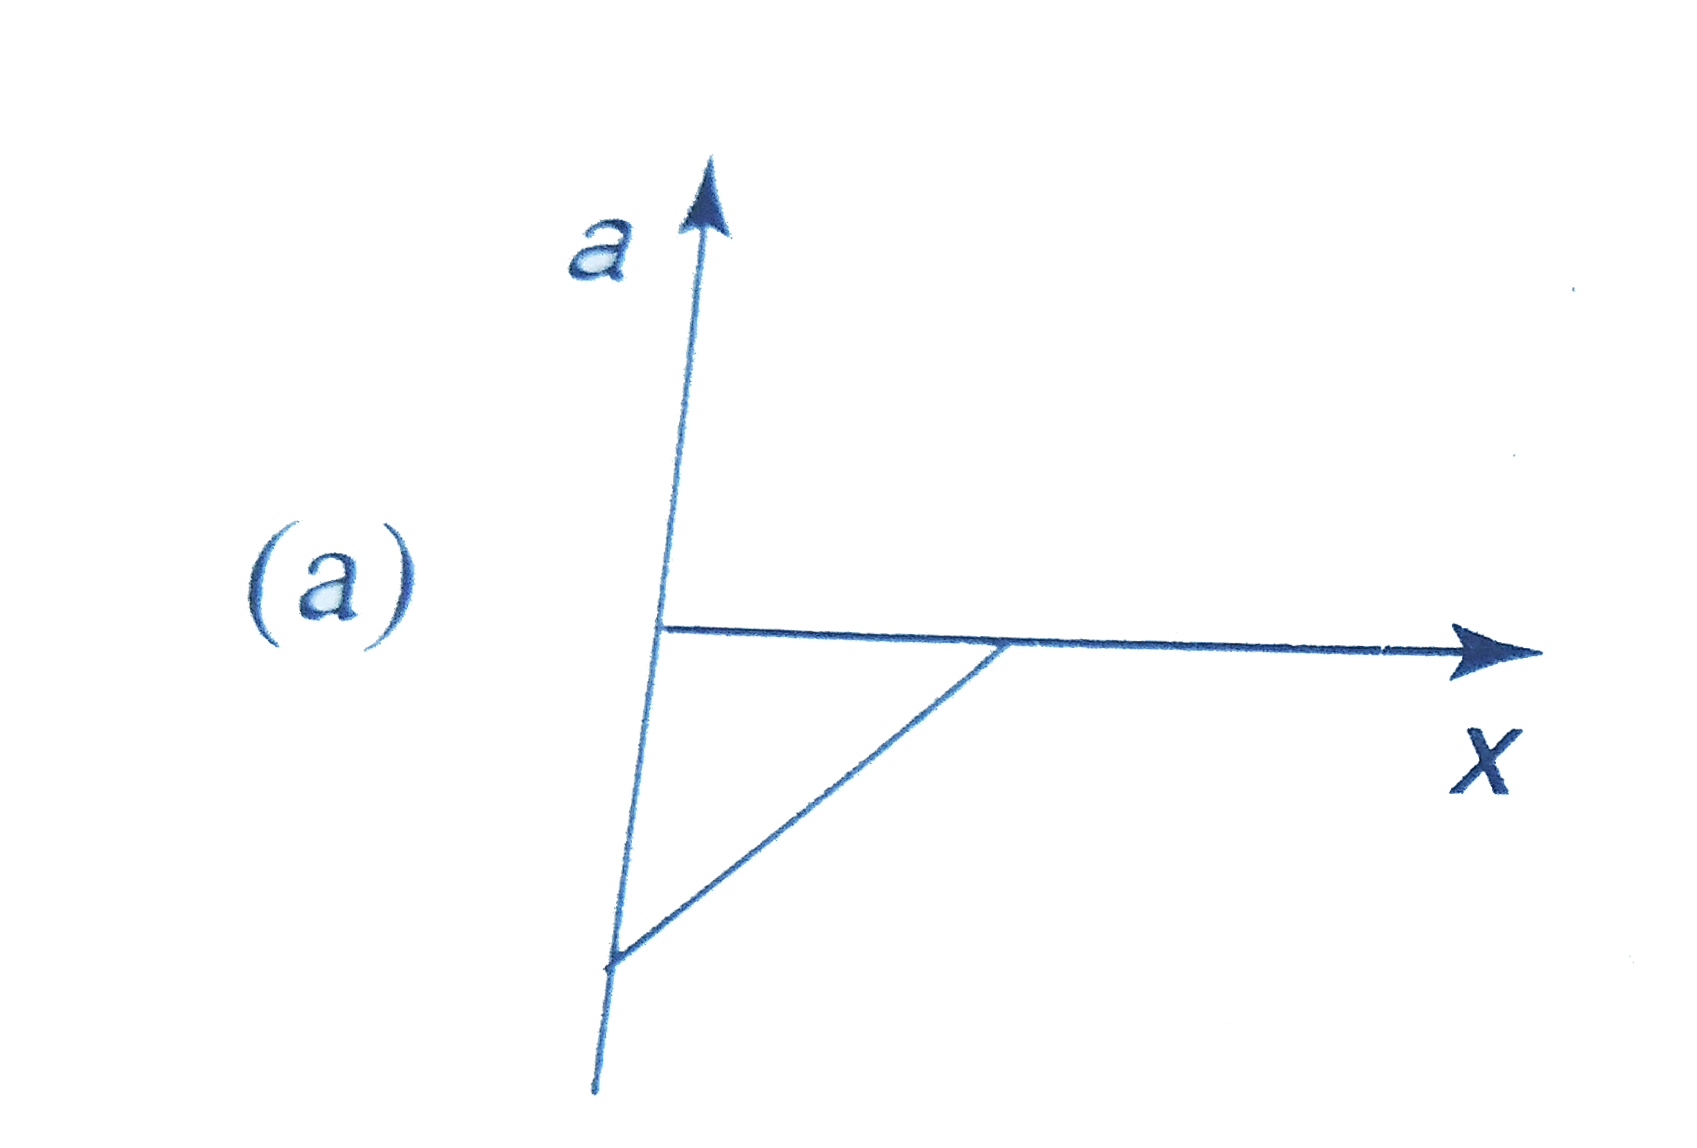 B
B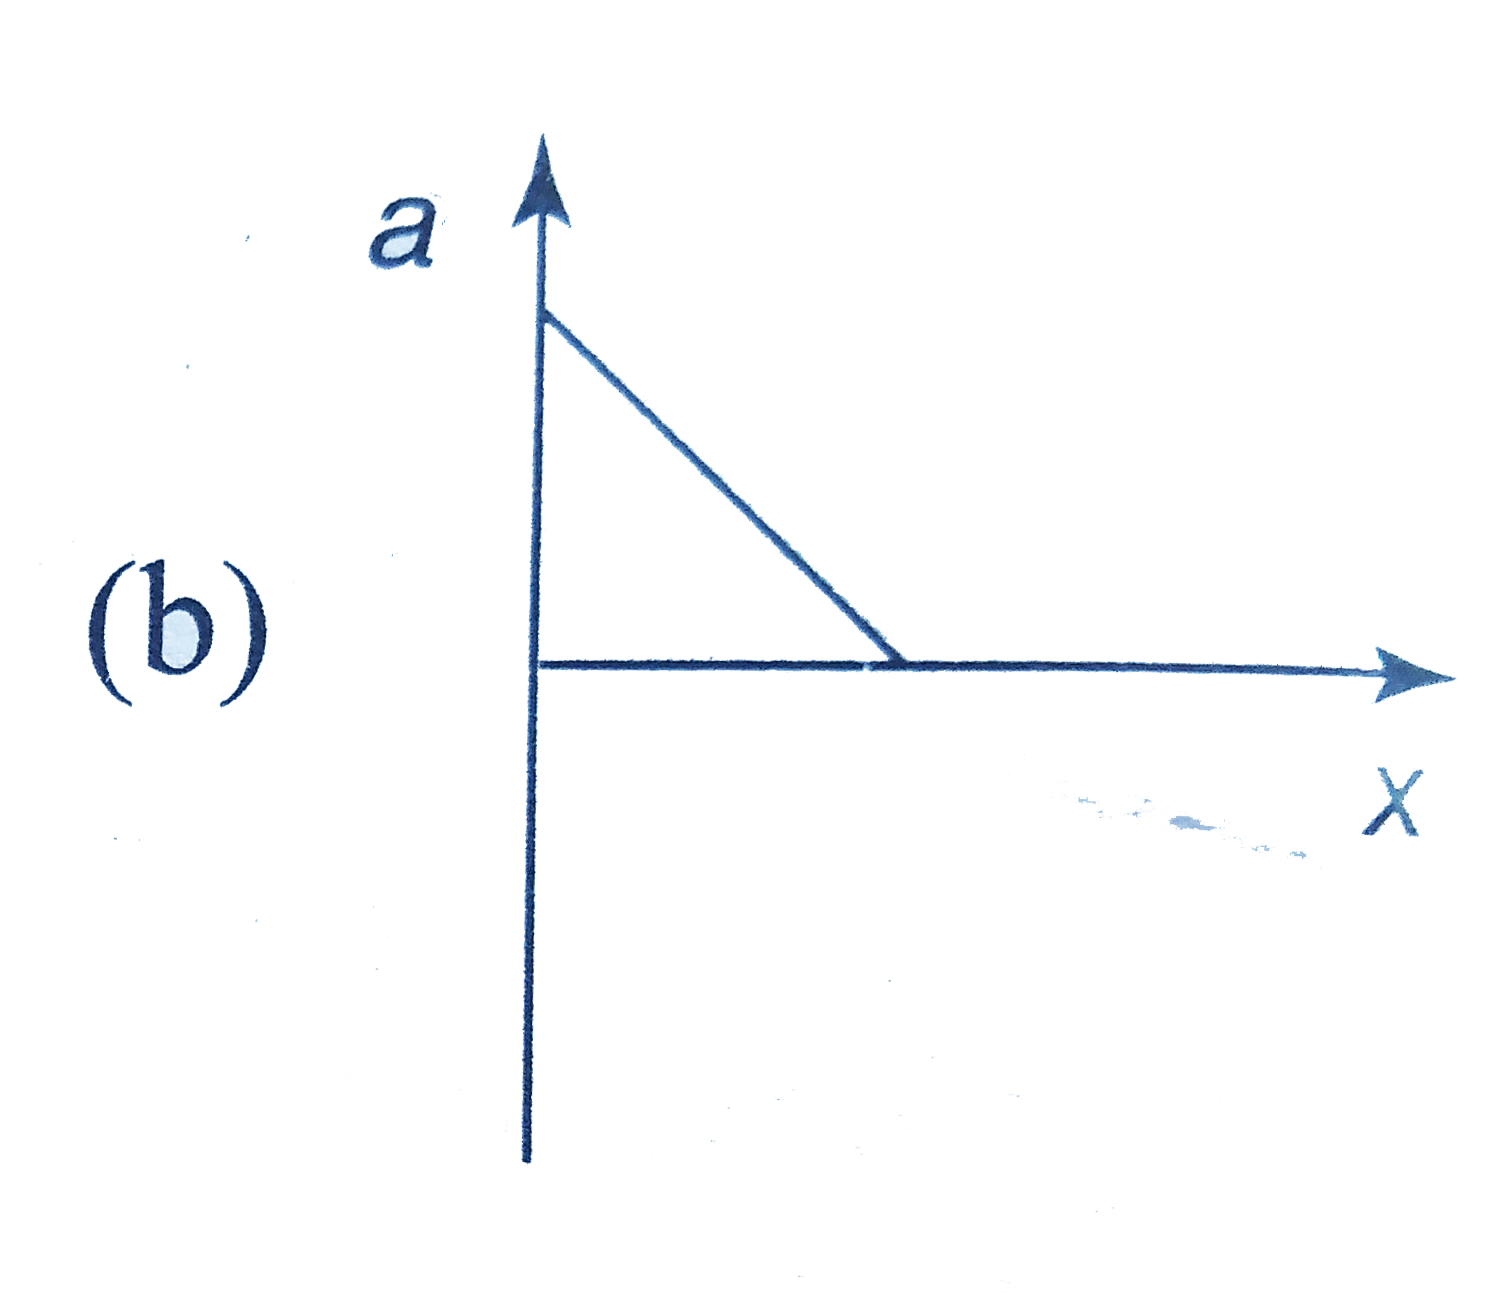 .C
.C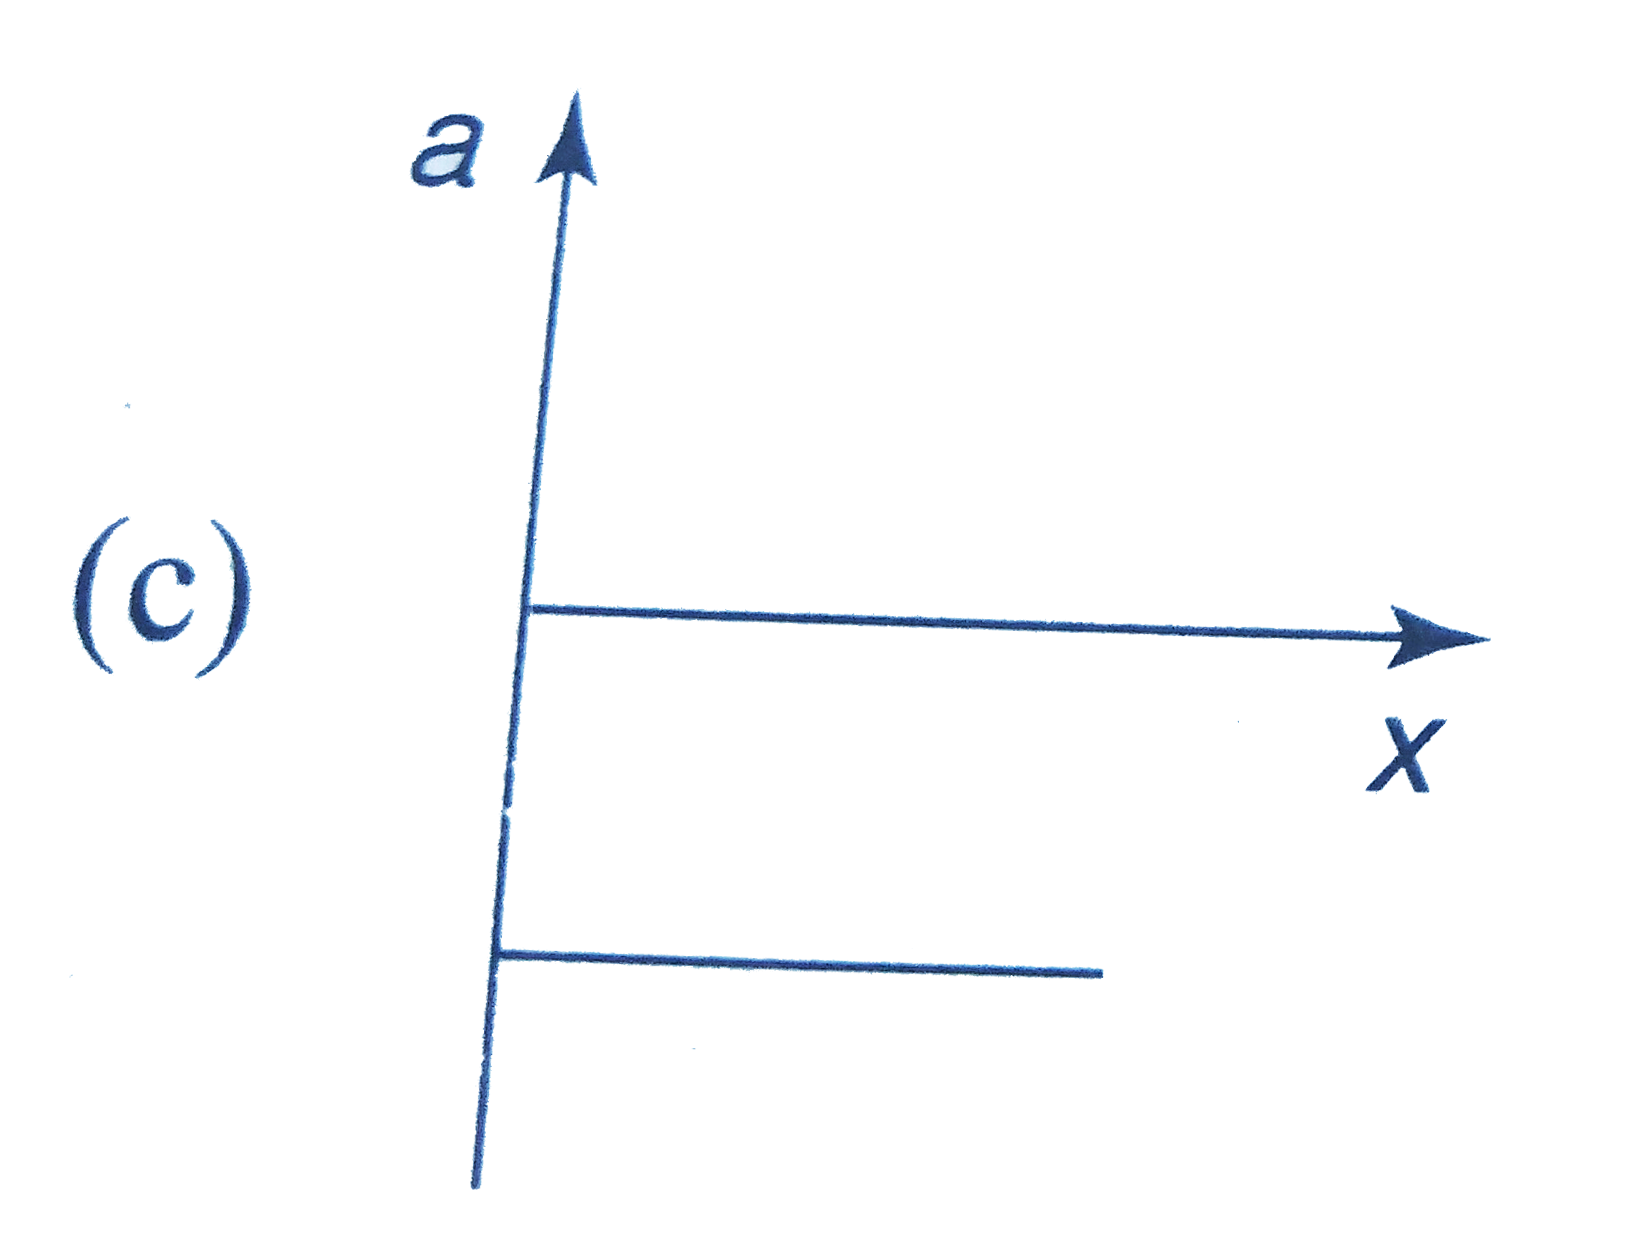 .D
.D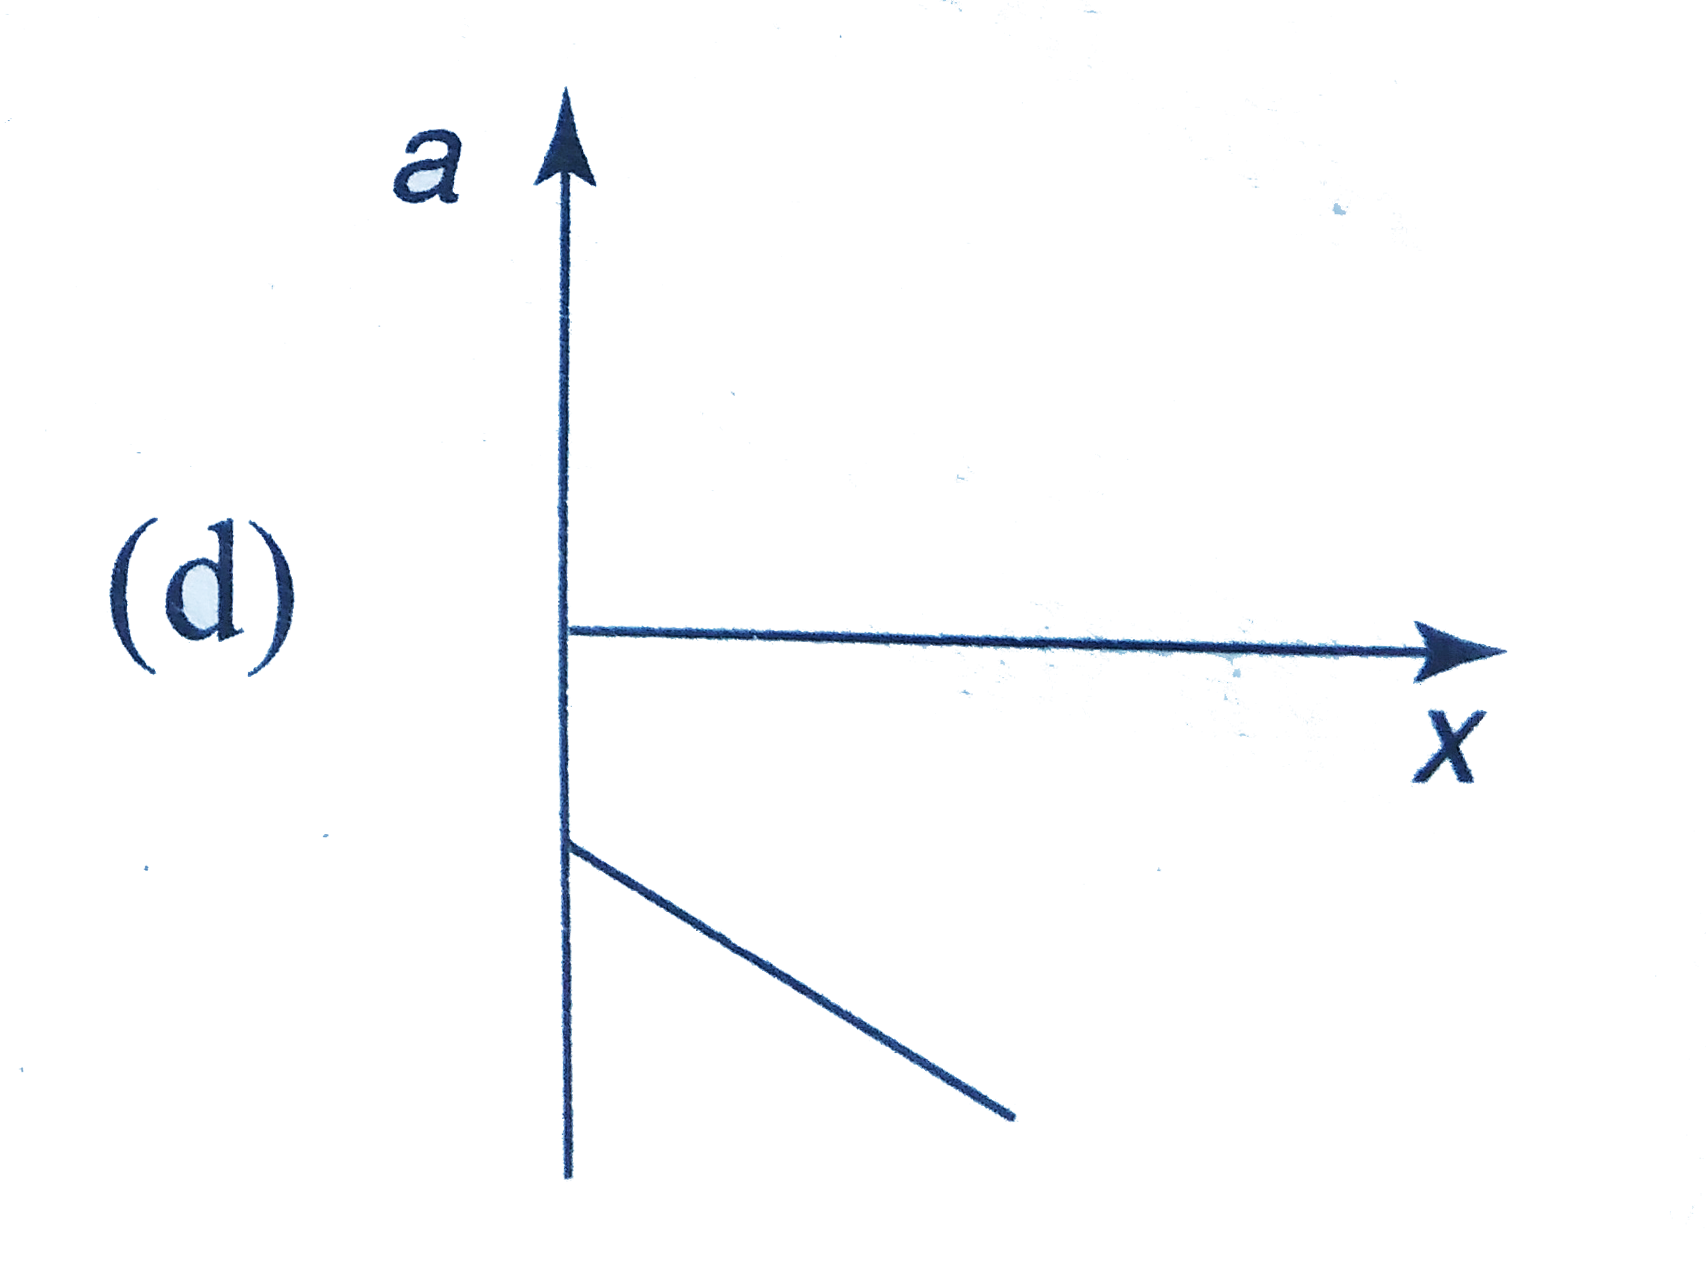 .
. - Question 3 - Select One
The angle between the graph of the linear equation 239x−239y+5=0 and the x - axis is
A0∘B60∘C30∘D45∘
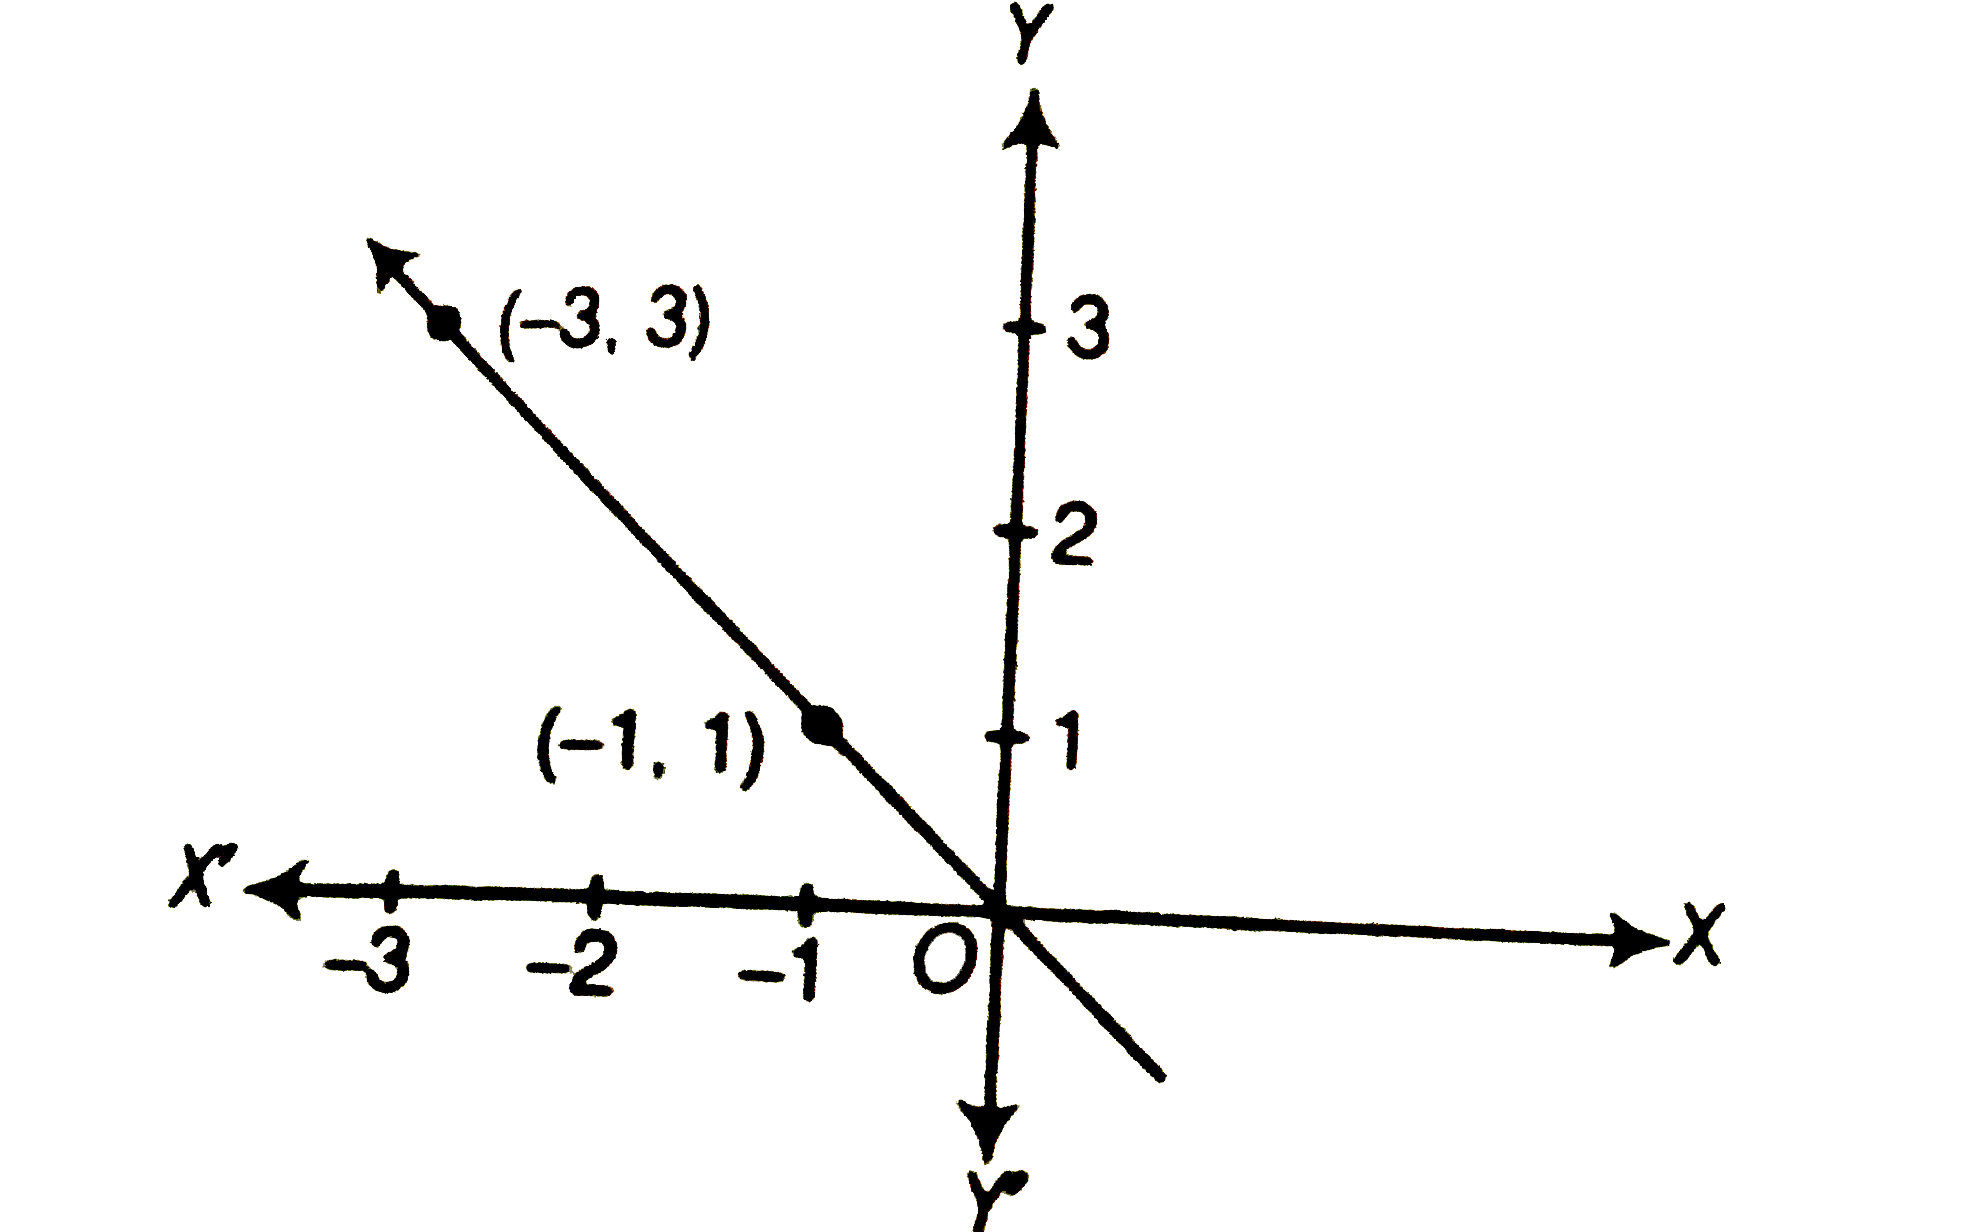
For the graphs given below, write down their x−y equations
 View Solution
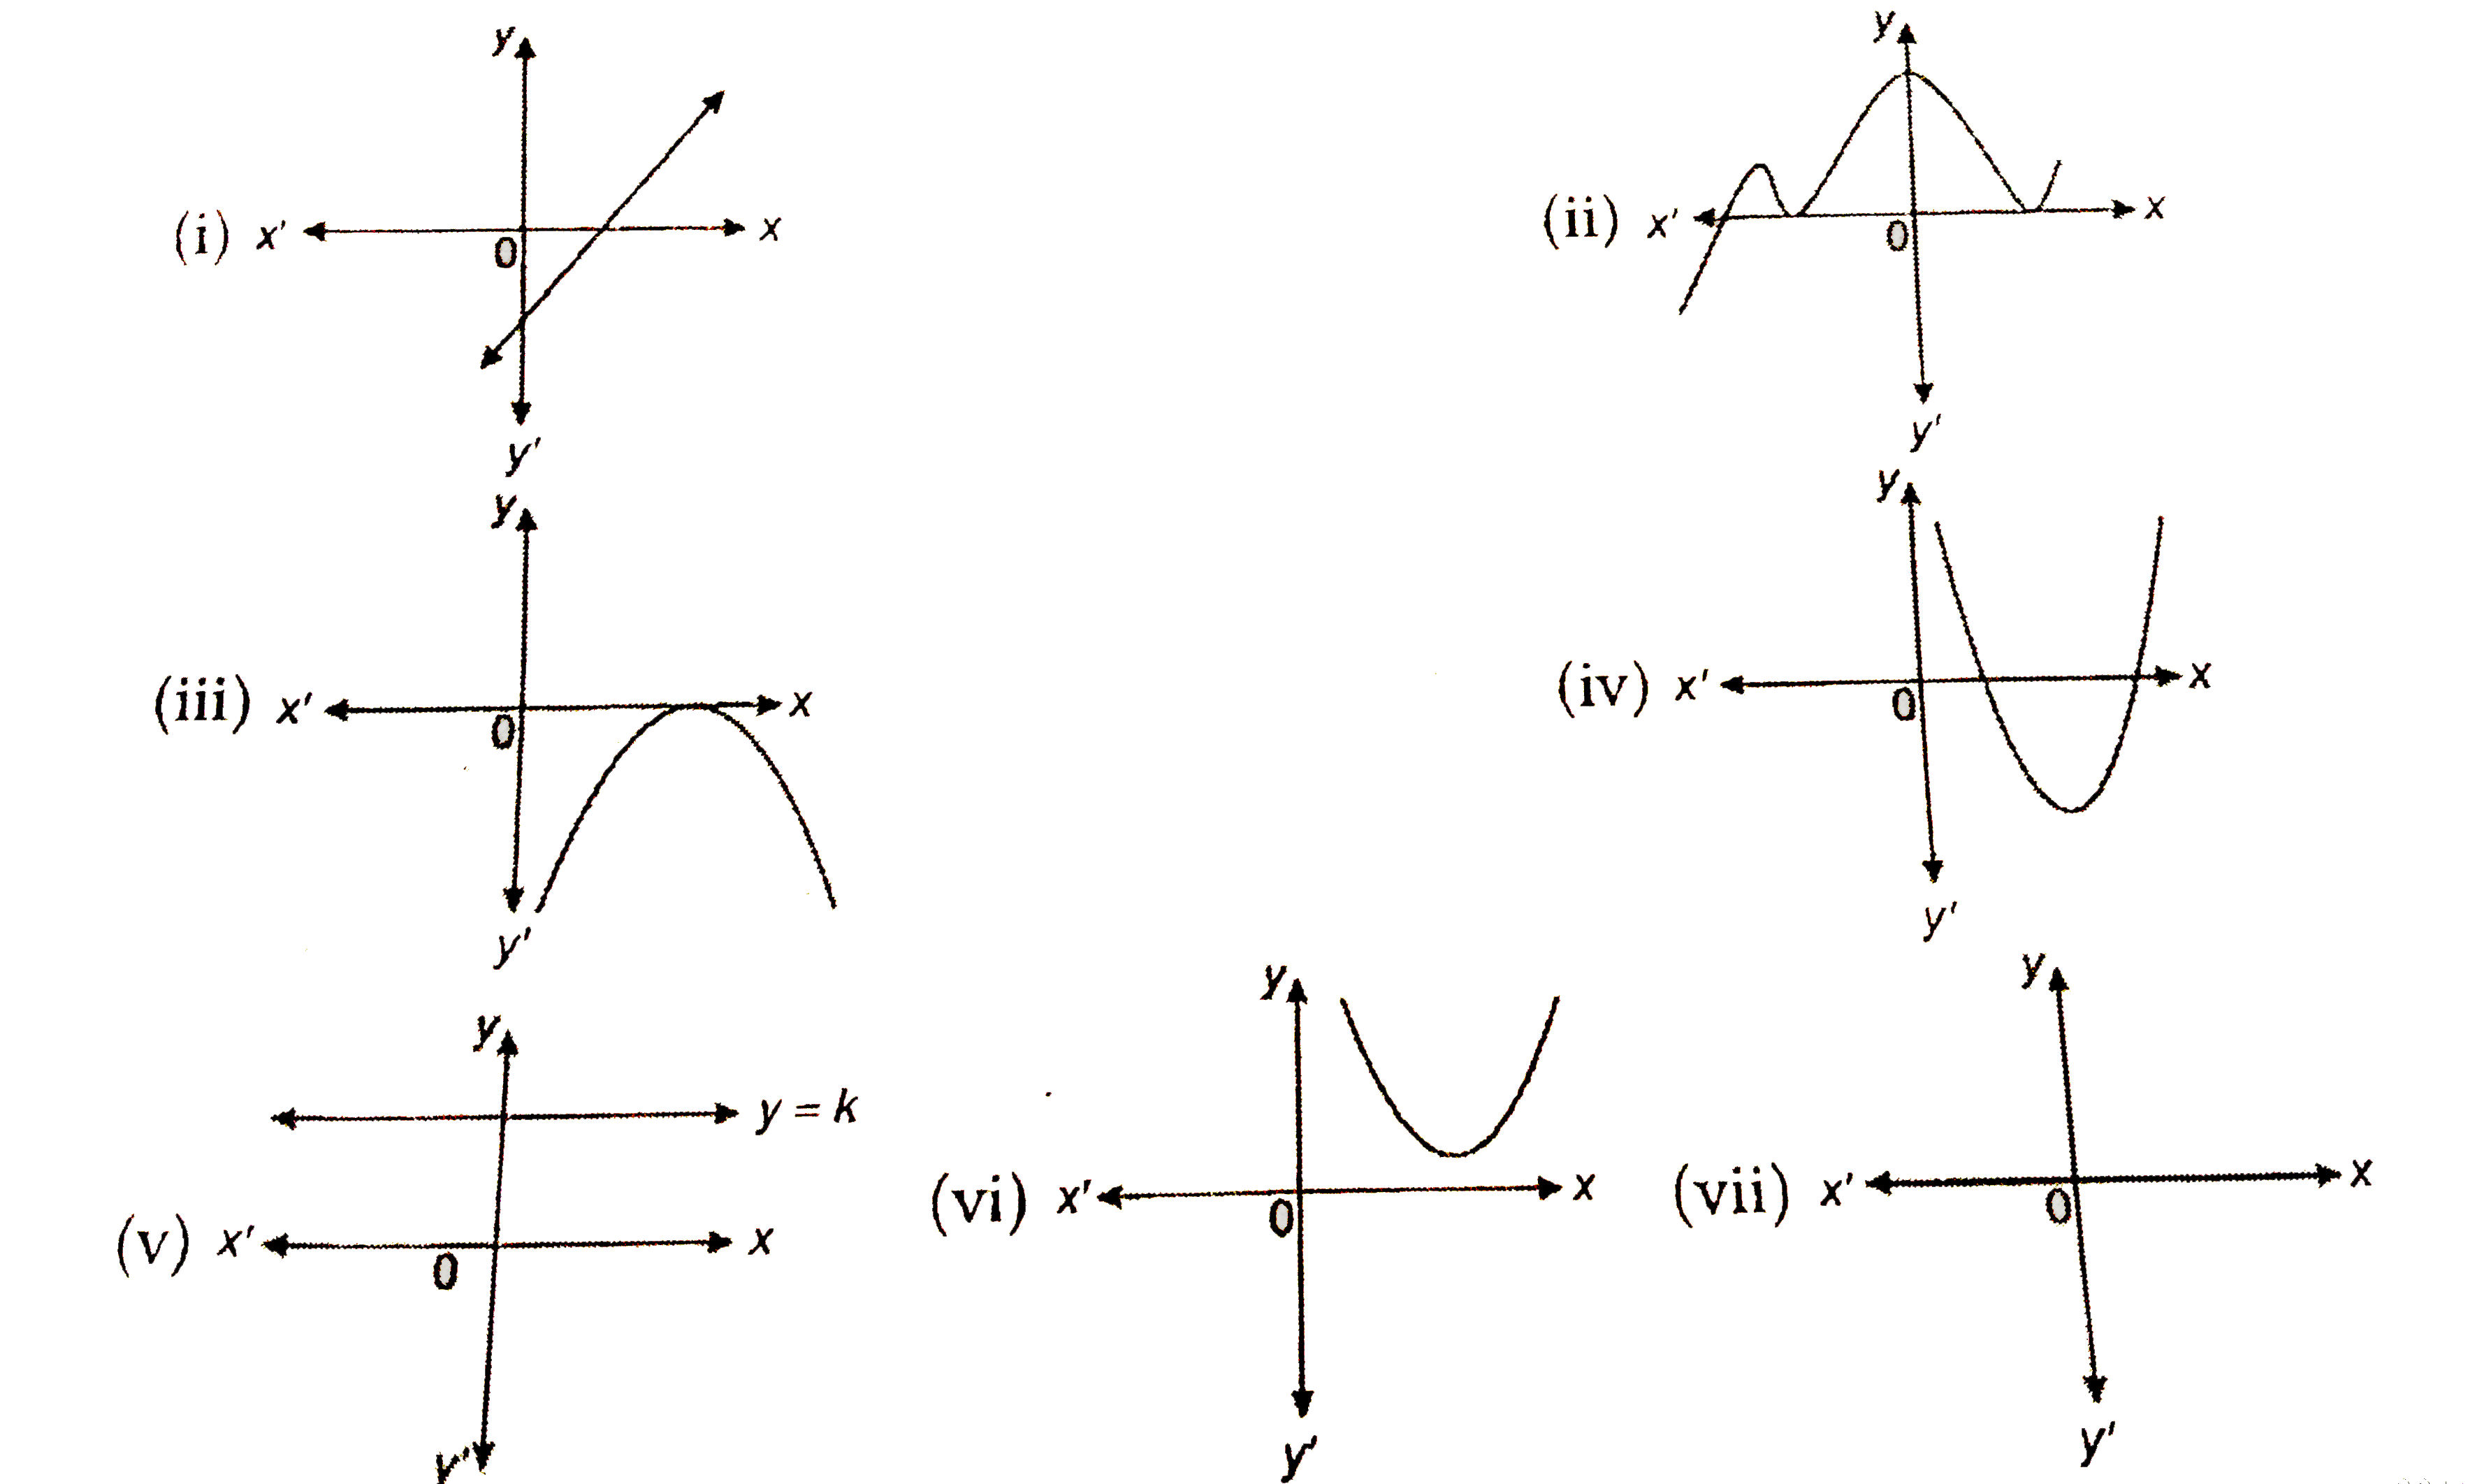
Which of the graphs given below corresponds to linear polynomial or a quadratic polynomial ? Also, find the number of zeroes of the polynomial in each case.
 View Solution
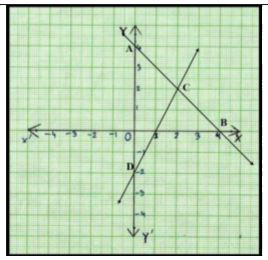
Given below is the graph representing two linear equations by lines AB and CD respectively. What is the area of the triangle formed by these two lines and the line x=0?
 View Solution
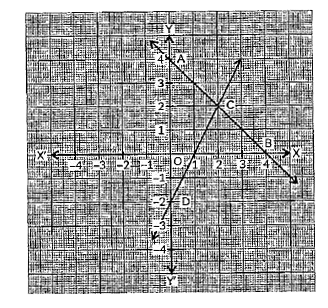
Given below is the graph representing two linear equations by lines AB and CD respectively. What is the area of the triangle formed by these two lines and the line is x=0 ?
 View Solution
Every point on the graph of a linear equation in two variables does not represent a solution of the linear equation.
View Solution

