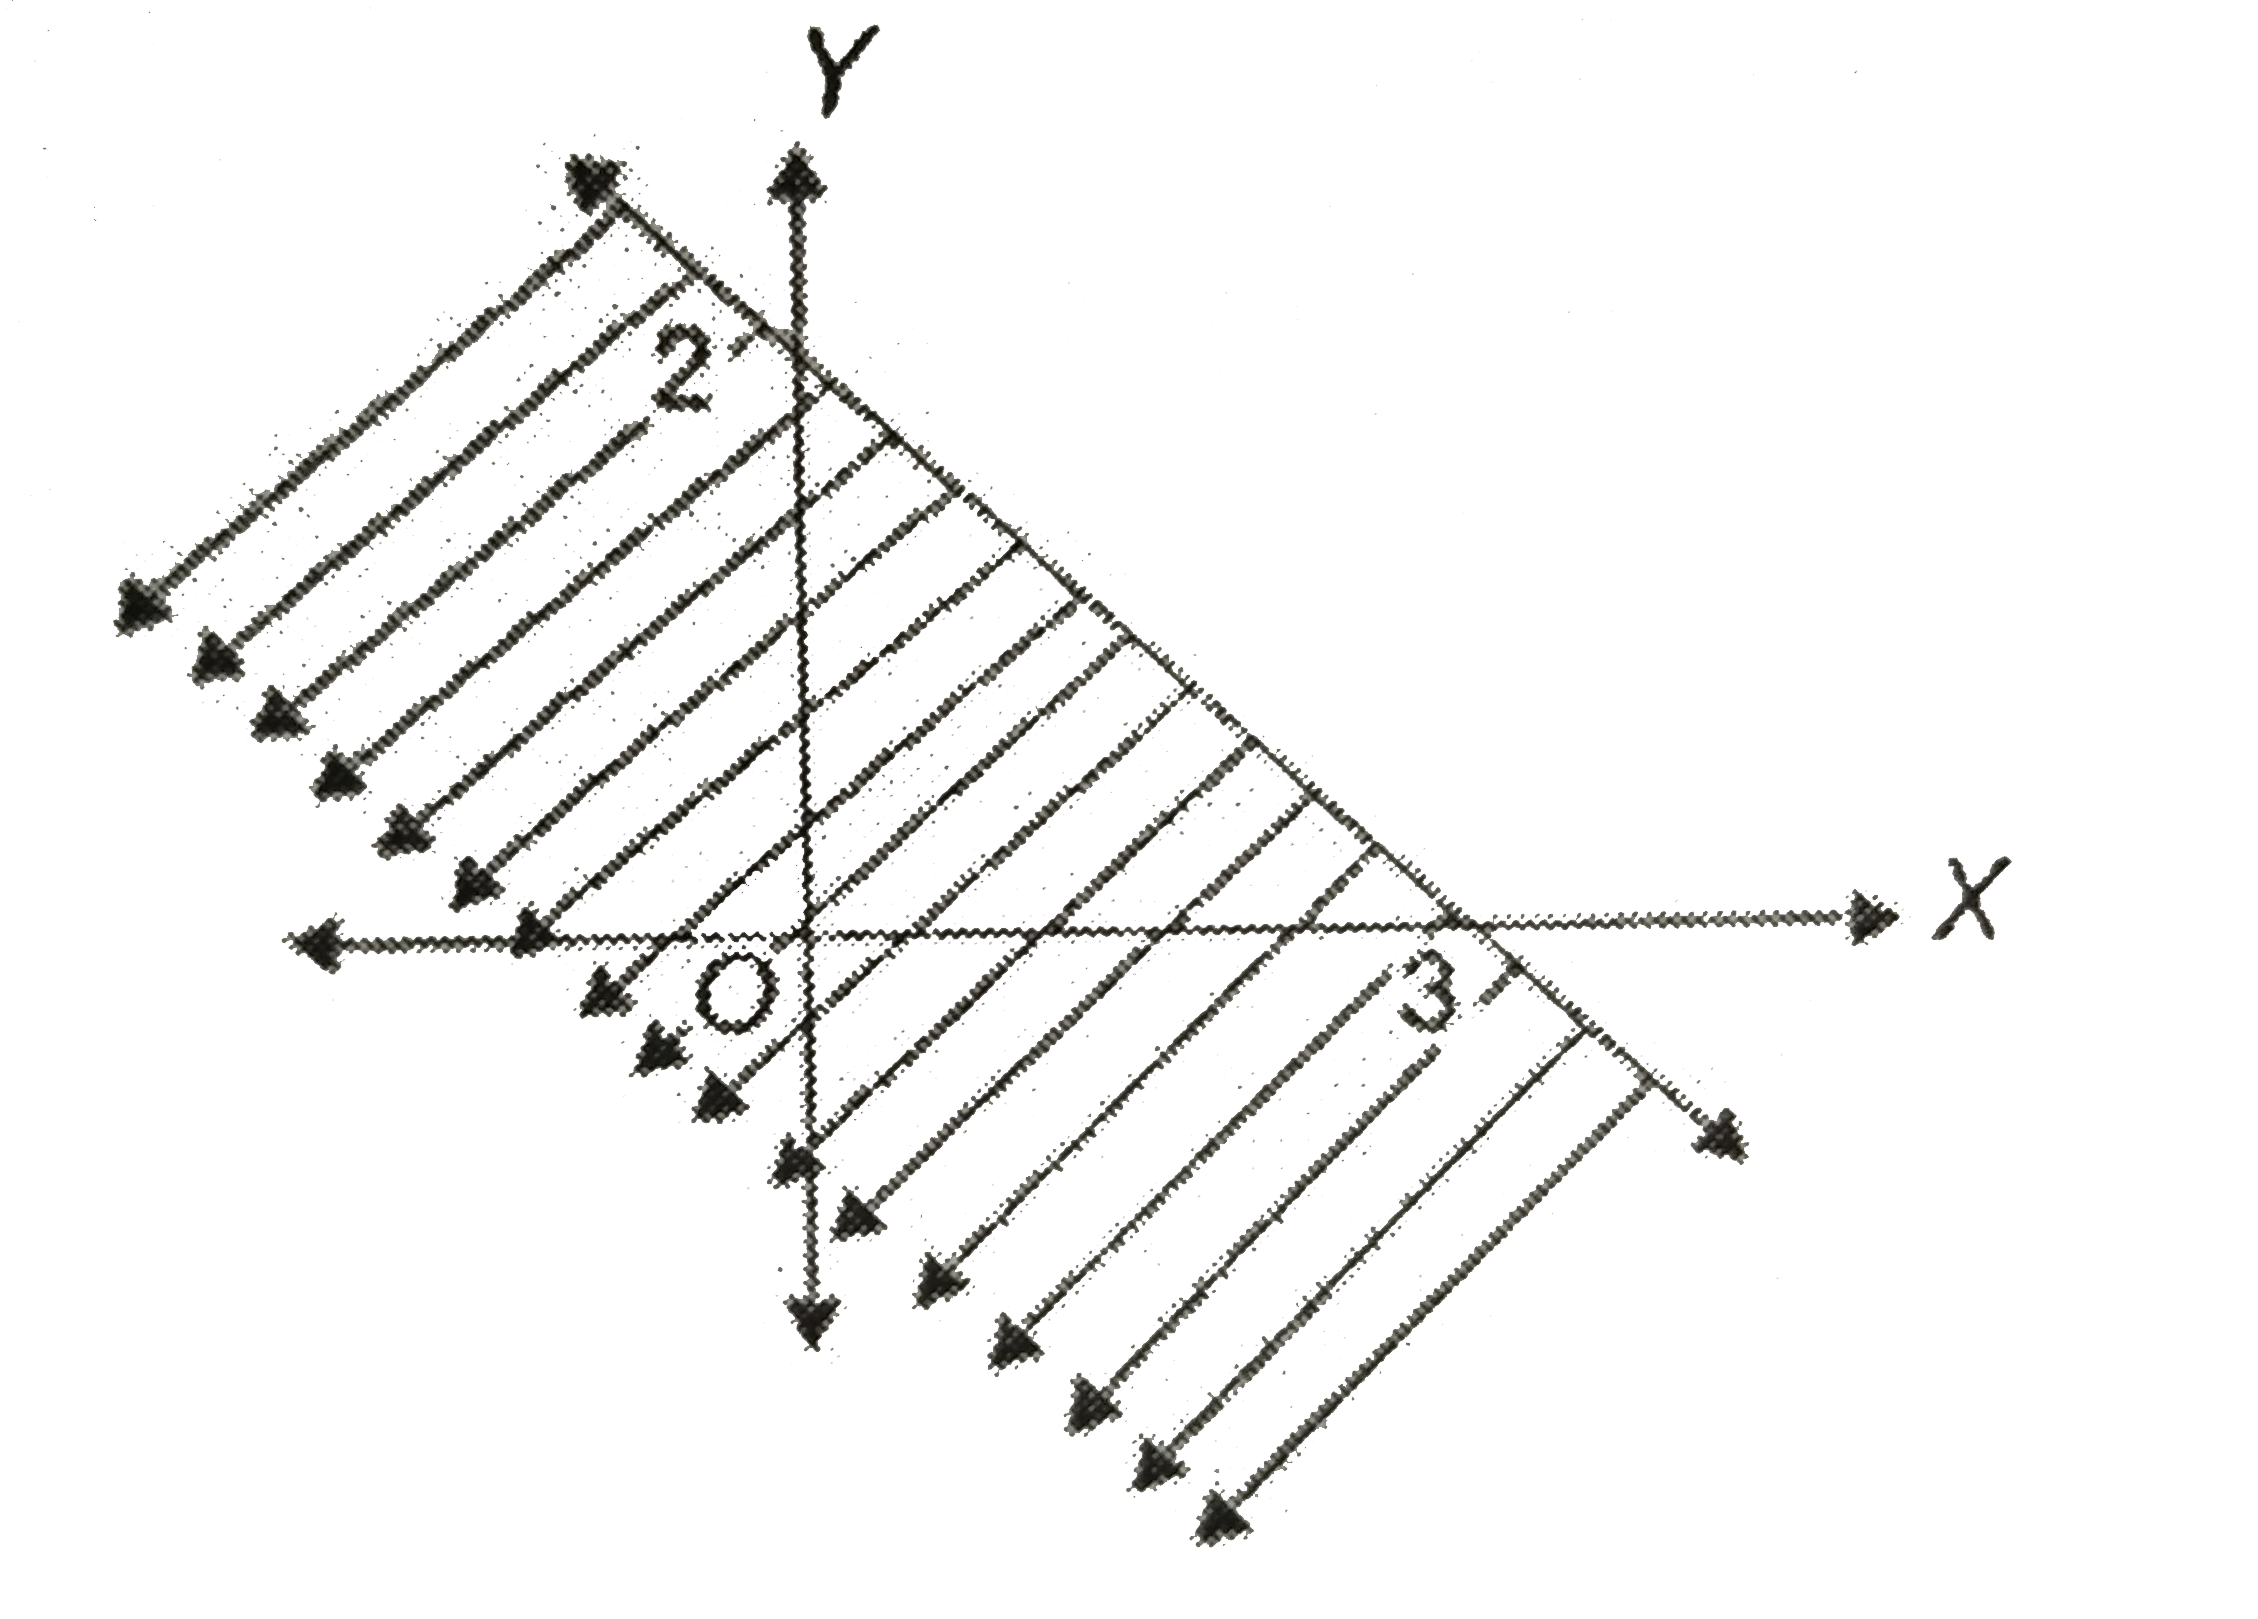
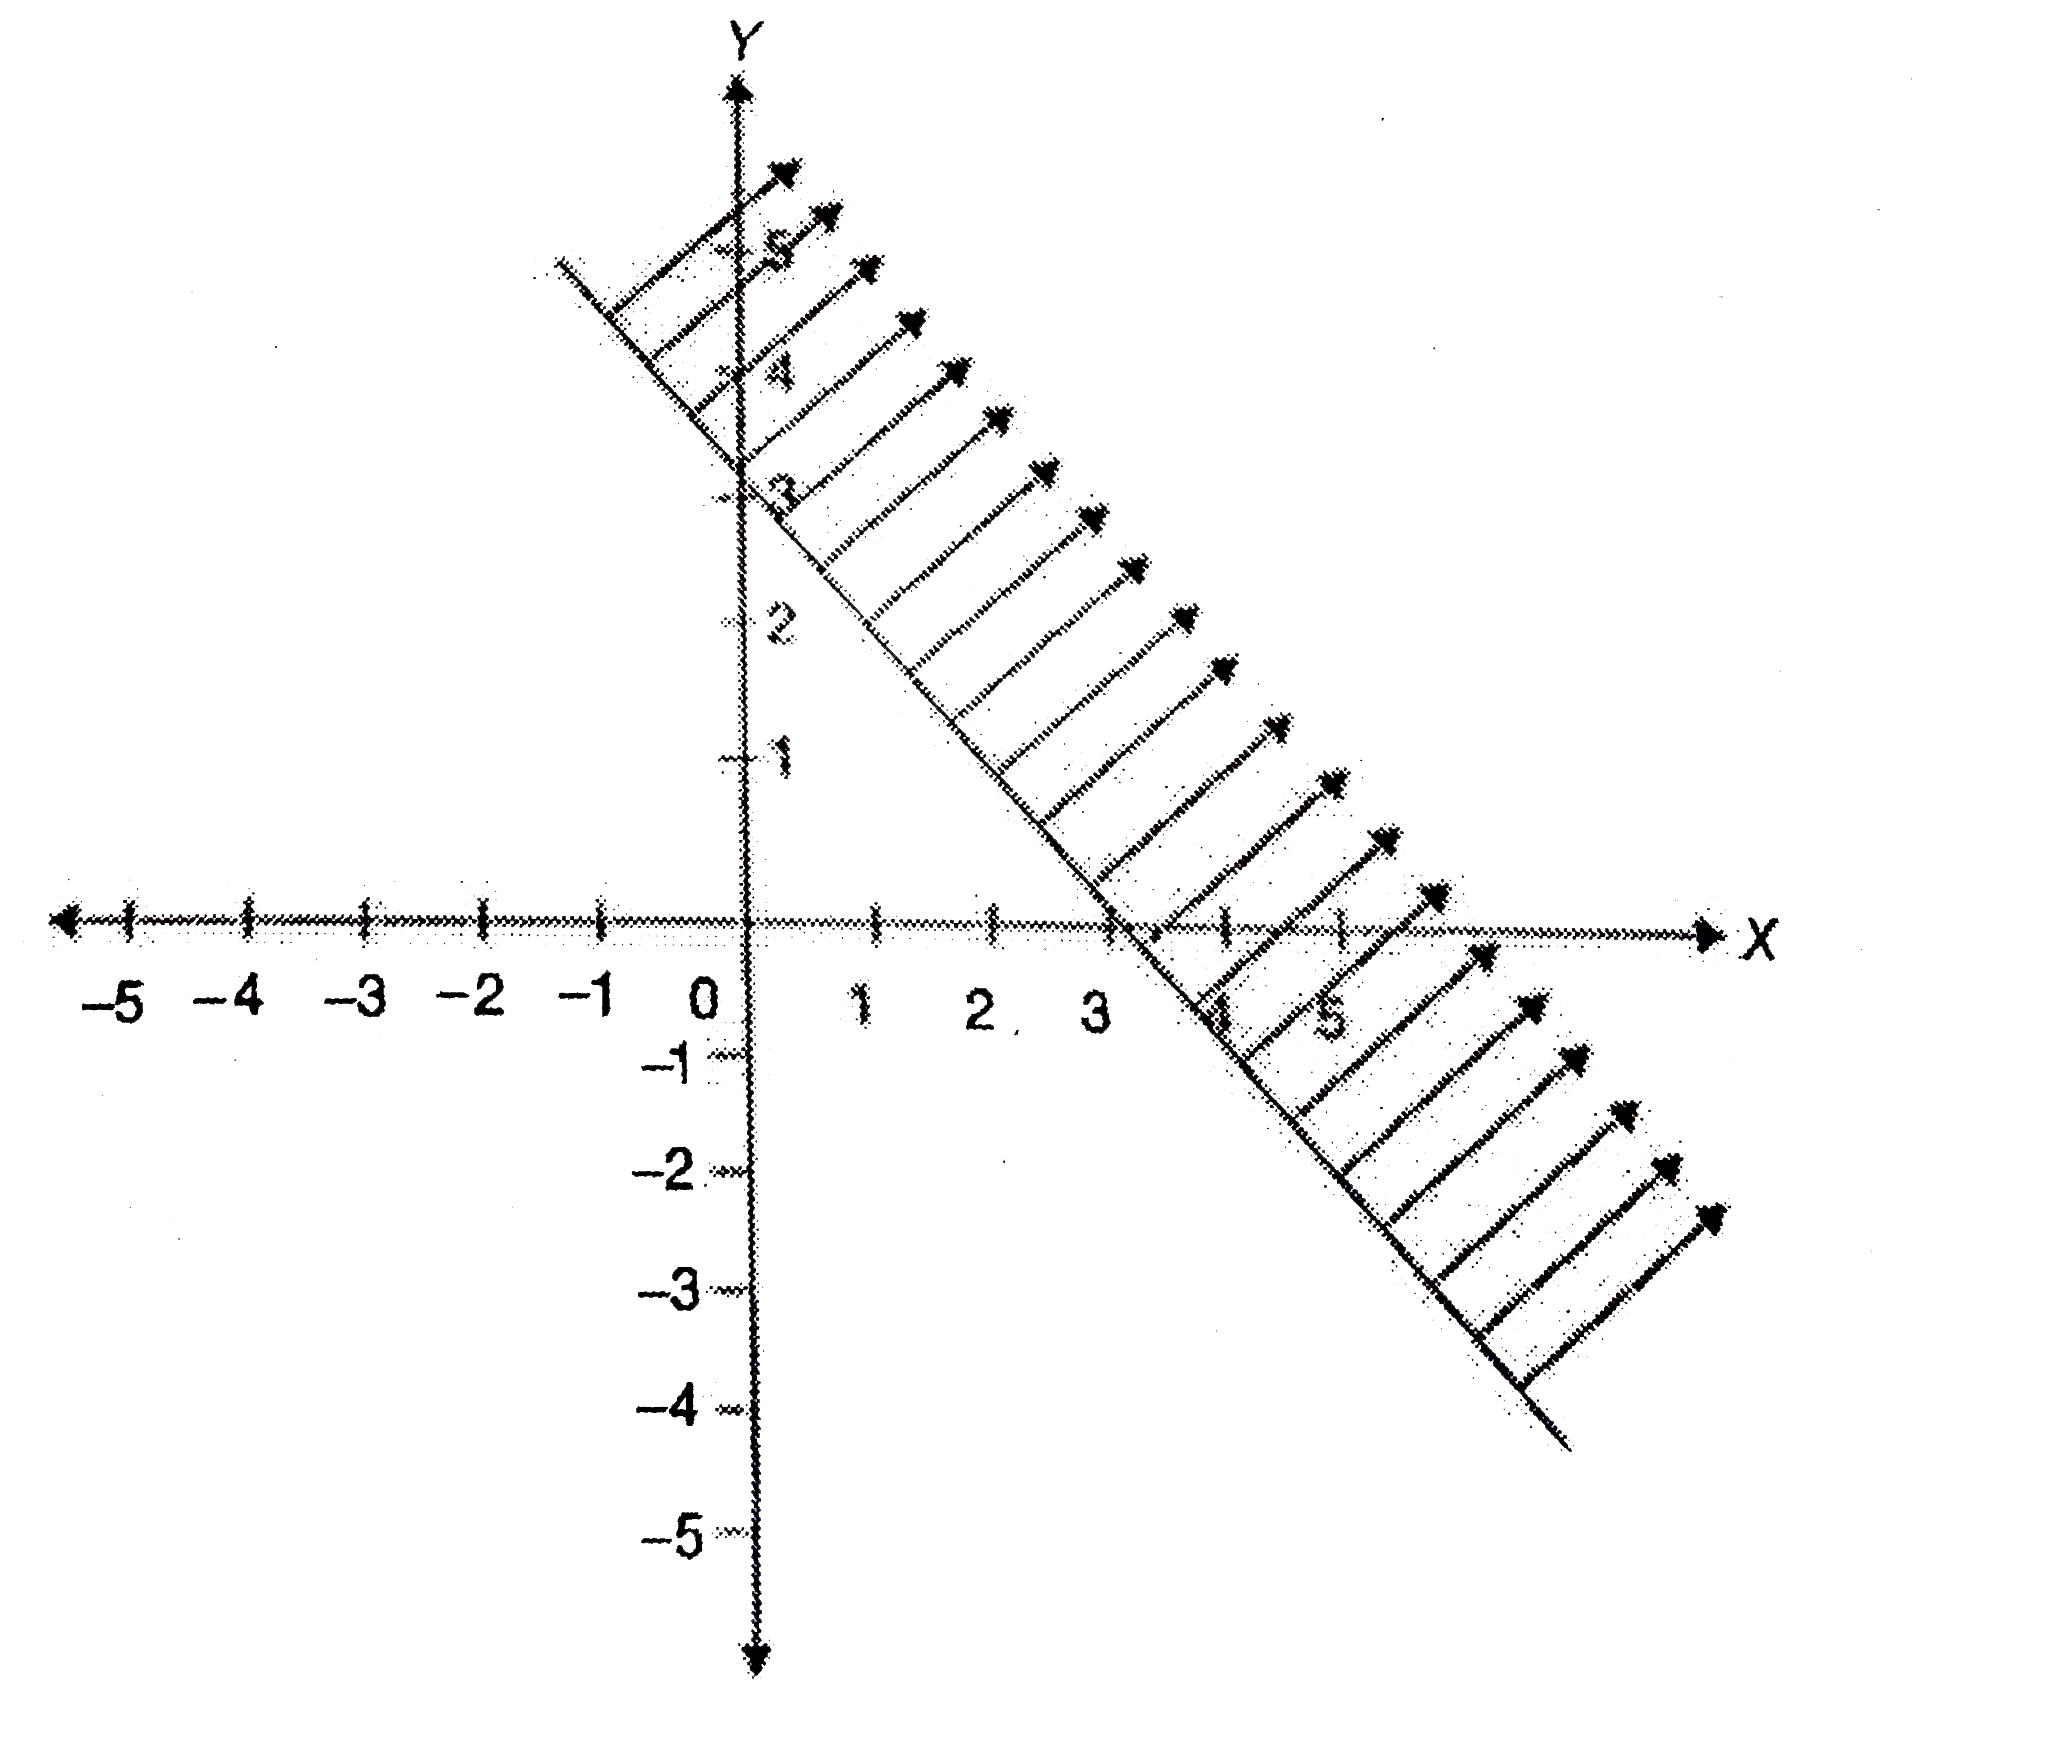
Inequation that represents the following graph is _____
Video Solution
Text Solution
The correct Answer is:4x+3y≥12
|
Answer
Step by step video, text & image solution for Inequation that represents the following graph is _____ by Maths experts to help you in doubts & scoring excellent marks in Class 9 exams.
Updated on:21/07/2023Topper's Solved these Questions
- LINEAR EQUATIONS AND INEQUATIONSBOOK - PEARSON IIT JEE FOUNDATIONCHAPTER - LINEAR EQUATIONS AND INEQUATIONSEXERCISE - Short Answer Type Questions
14 Videos
- LINEAR EQUATIONS AND INEQUATIONSBOOK - PEARSON IIT JEE FOUNDATIONCHAPTER - LINEAR EQUATIONS AND INEQUATIONSEXERCISE - Essat Type Questions
4 Videos
- LINEAR EQUATIONS AND INEQUATIONSBOOK - PEARSON IIT JEE FOUNDATIONCHAPTER - LINEAR EQUATIONS AND INEQUATIONSEXERCISE - level 3
10 Videos
- GEOMETRYBOOK - PEARSON IIT JEE FOUNDATIONCHAPTER - GEOMETRYEXERCISE - CONCEPT APPLICATION
61 Videos
- LOCUSBOOK - PEARSON IIT JEE FOUNDATIONCHAPTER - LOCUSEXERCISE - Level 3
15 Videos
Similar Questions
Knowledge Check
The inequality representing the following graph is
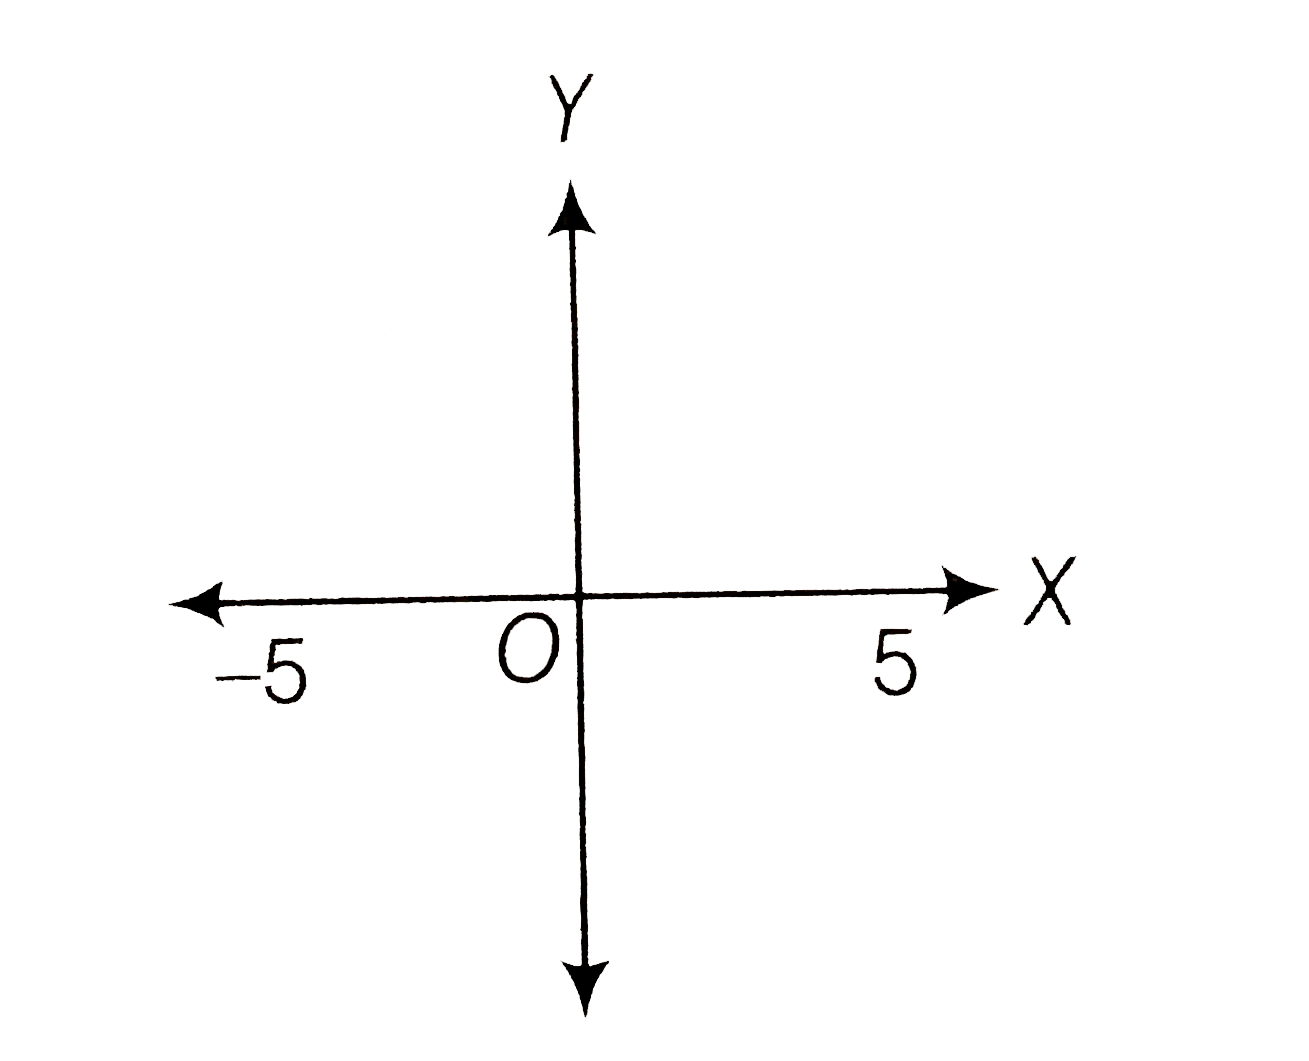 A|x|<5B|x|≤5C|x|>5D|x|≥5
The inequality representing the following graph is
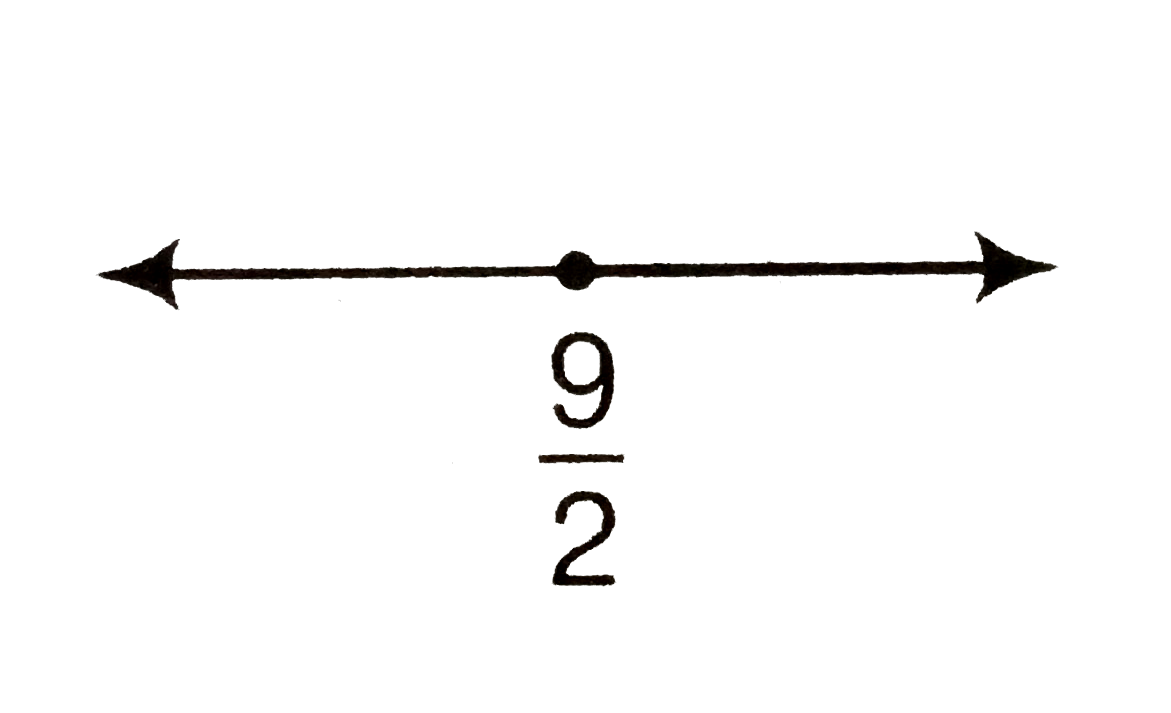 Ax∈(92,∞)Bx∈[92,∞)Cx∈−[∞,92)Dx∈(−∞,92]
The inequality representing the following graph is
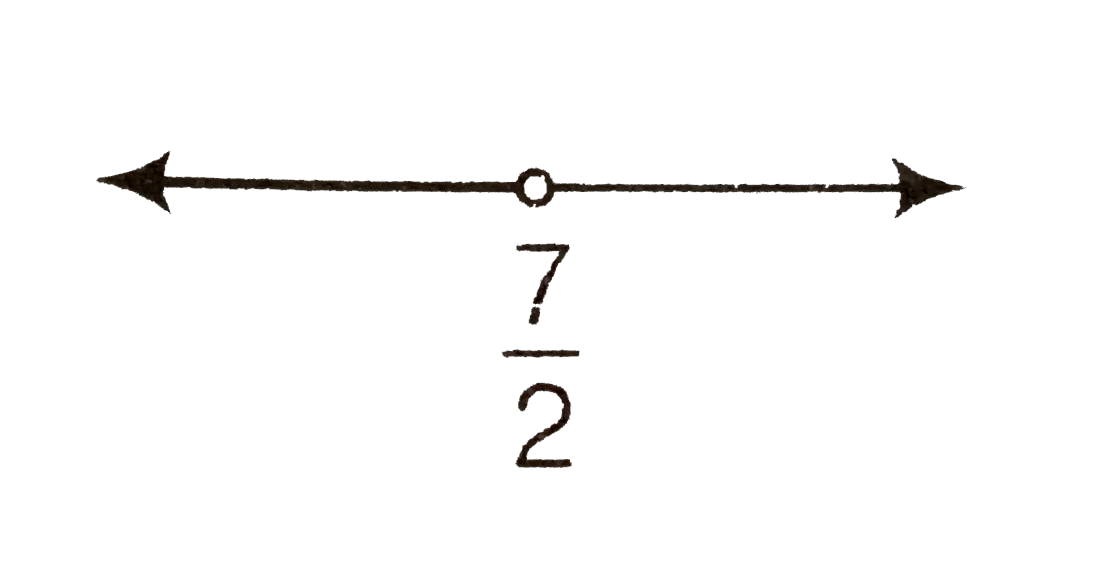 Ax∈(−∞,72)Bx∈(−∞,72]Cx∈[72,−∞)Dx∈(72,∞)

