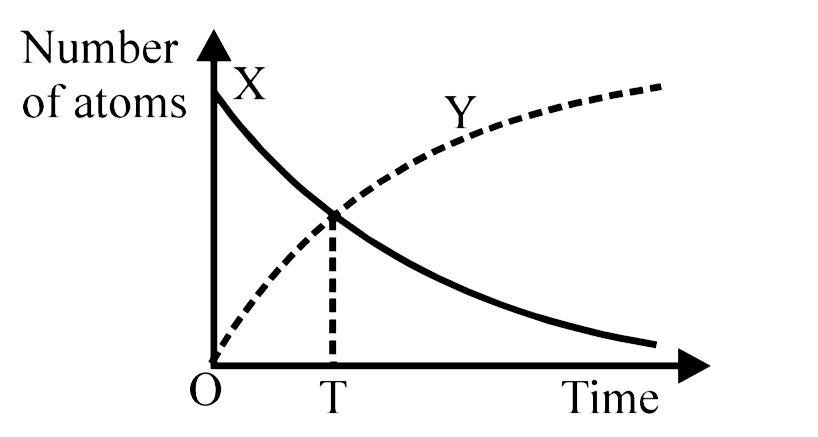
The graph represents the decay of a newly-prepared sample of radioactive nuclide X to a stable nuclide Y. The half-life of X is t. The growth curve for Y intersects the decay curve for X after time T. What is the time T ?
t/2
ln(t/2)
t
ln(2t)
The correct Answer is:C
At time T,N=N0−N⇒N=N02⇒T=t
Topper's Solved these Questions
- BOOK - ALLENCHAPTER - TEST PAPERSEXERCISE - Part-1 Physics15videos
TEST PAPERS
- BOOK - ALLENCHAPTER - TEST PAPERSEXERCISE - part-2 physics63videos
TEST PAPERS
- BOOK - ALLENCHAPTER - TEST PAPERSEXERCISE - PAPER 260videos
TEST PAPERS
- BOOK - ALLENCHAPTER - TEST PAPER 4EXERCISE - PHYSICS45videos
TEST PAPER 4
- BOOK - ALLENCHAPTER - UNIT & DIMENSIONS, BASIC MATHS AND VECTOR EXERCISE - Exercise (J-A)7videos
UNIT & DIMENSIONS, BASIC MATHS AND VECTOR
Similar Questions
The graph represents the decay of a newly prepared sample of radioactive nuclide X to a stable nuclide Y. The half life of X is τ. The growth curve for Y intersects the decay curve for X after time T. What is the time T in multiple of τ ?
'(## CEN_KSR_PHY_JEE_CO30_E01_028_Q01##)'View SolutionThe relationship between decay constant λ and half-life T of a radioactive substance is
View Solution
Knowledge Check
- Question 1 - Select One
The half life of 2g sample of radioactive nuclide 'X' is 15 min. The half life time of 1g sample of X is
A7.5 minB15 minC22.5 minD30 min - Question 2 - Select One
A radioactiev nuleus X deays to a stable nuleus Y. Then, time graph of rate of formation of Y against time t will be:
A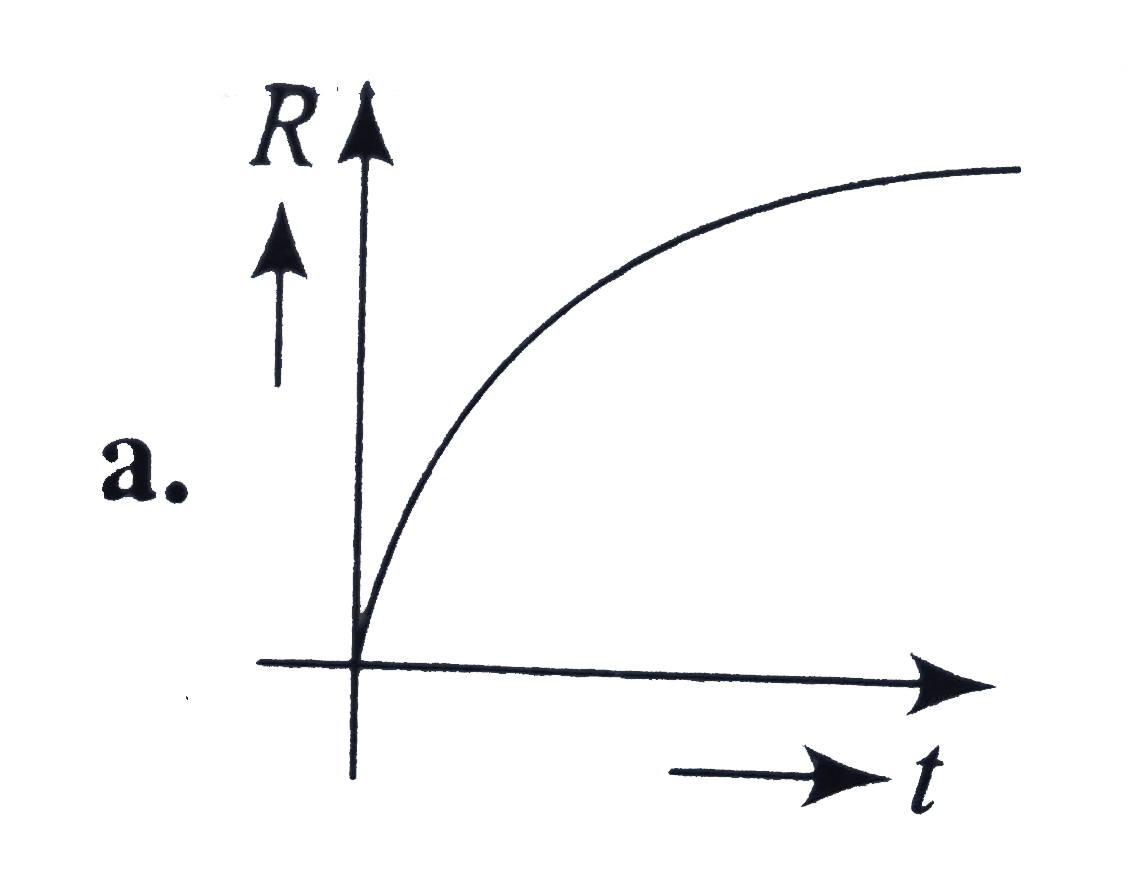 B
B C
C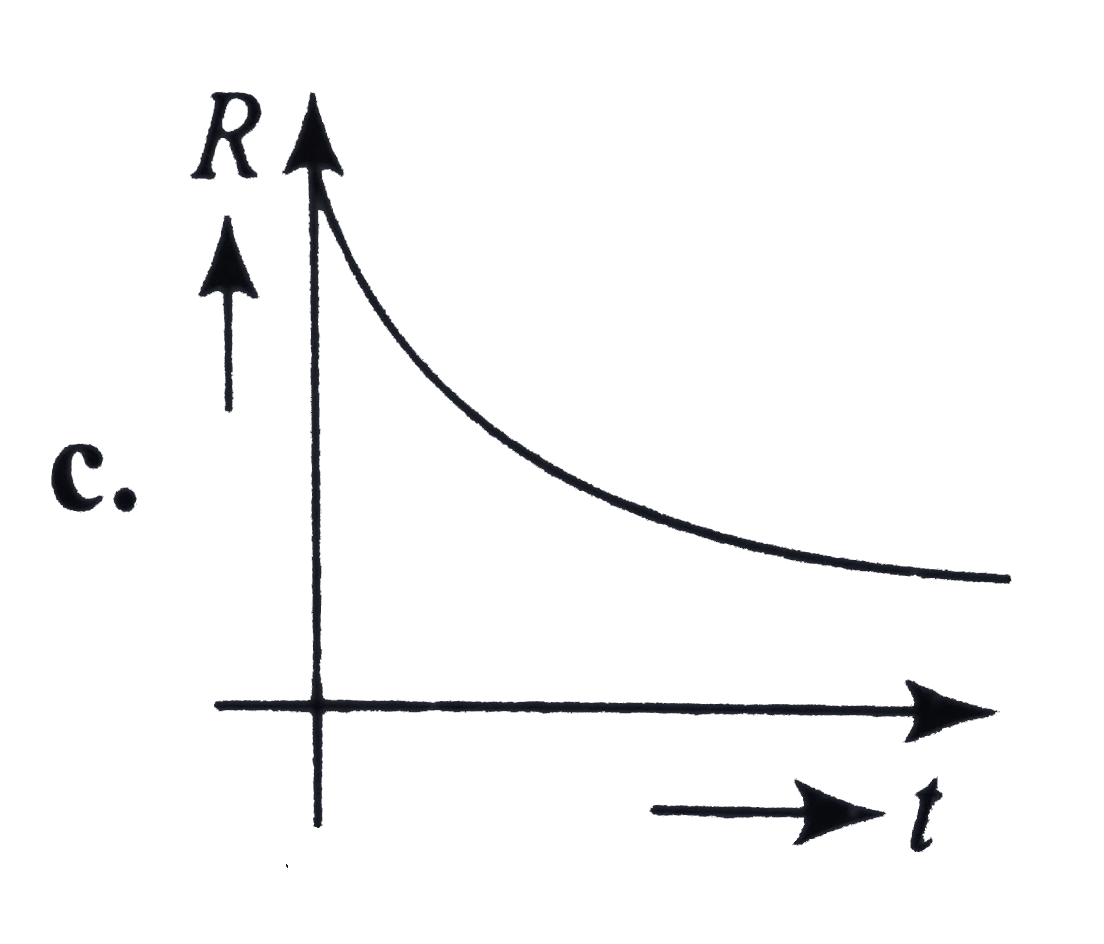 D
D
- Question 3 - Select One
The graph between number of decayed atoms N' of a radioactive element and time t is.
A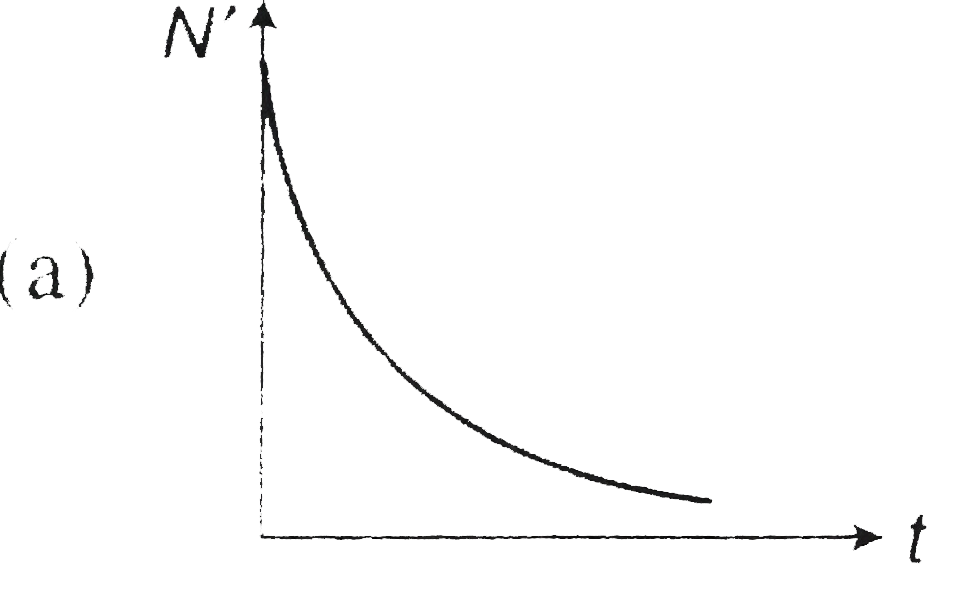 .B
.B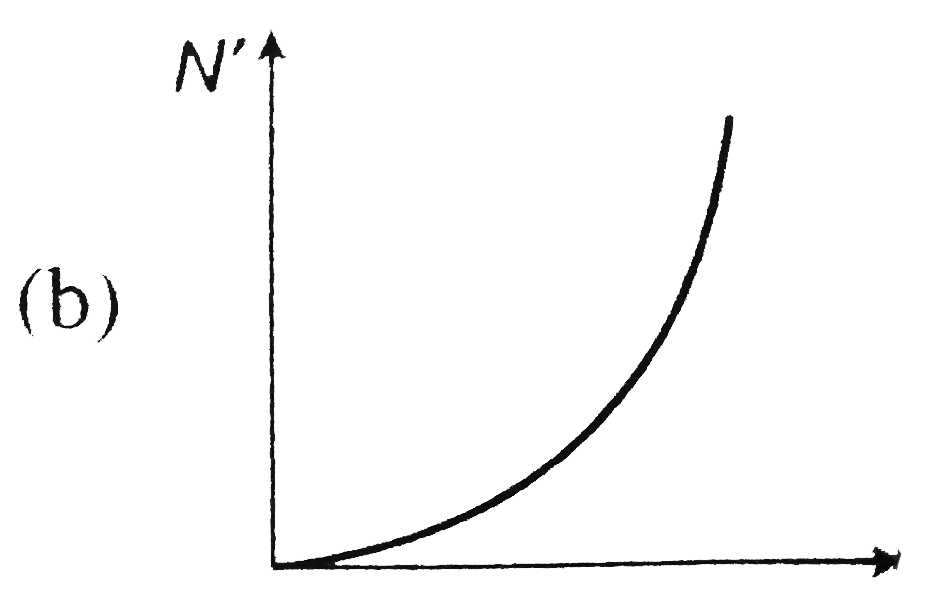 .C
.C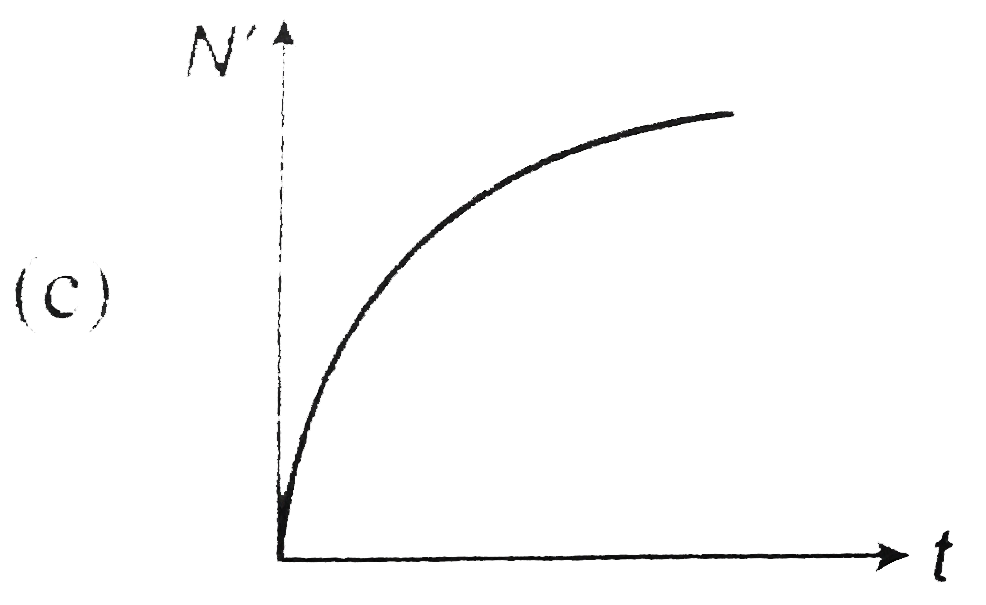 .D
.D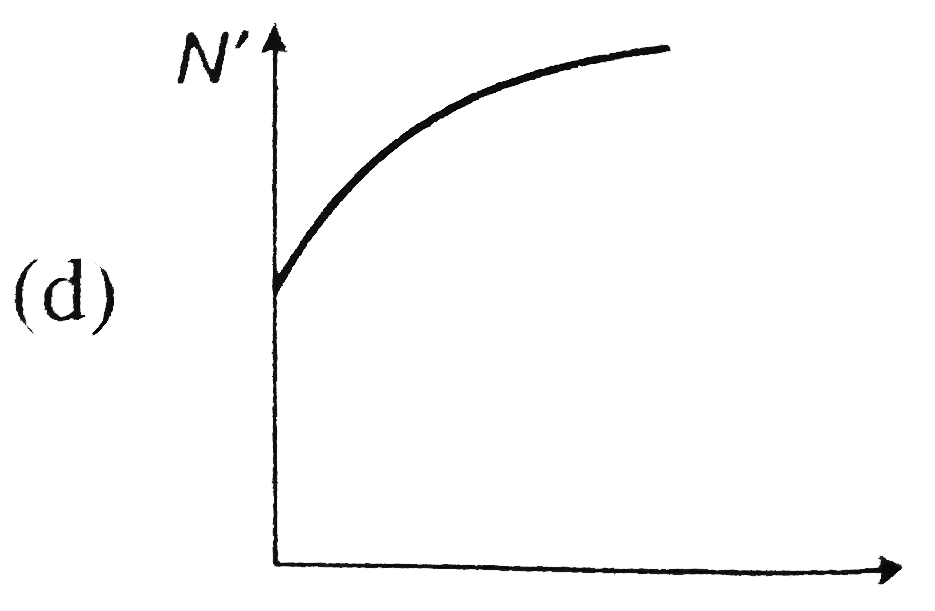 .
.
The half life of radioactive substance is T. Then the fraction of the substance that has decayed in time t is-
View SolutionA newly prepared radioactive nuclide has a decay constant λ of 10−6s−1. What is the approximate half-life of the nuclide?
View SolutionThe decay constant of a radioactive sample is λ. Its half -life is T1/2 and mean life is T.
View SolutionIn Fig. X represents time and Y represent activity of a radioactive sample. Then the activity of sample, varies with time according to the curve
 View Solution
Two radioactive nuclides A and B have half life of t and 2t respectively . If we start an experiment with one mole of each of them, what will be the mole ratio after a time interval of 6 t ?
View Solution

