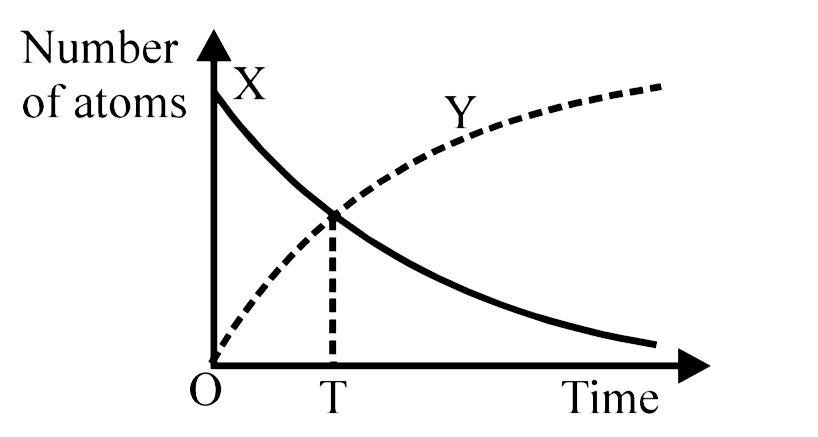
The graph represents the decay of a newly prepared sample of radioactive nuclide X to a stable nuclide Y. The half life of X is τ. The growth curve for Y intersects the decay curve for X after time T. What is the time T in multiple of τ ?
'(## CEN_KSR_PHY_JEE_CO30_E01_028_Q01##)'
The correct Answer is:1
Topper's Solved these Questions
Similar Questions
The graph represents the decay of a newly-prepared sample of radioactive nuclide X to a stable nuclide Y. The half-life of X is t. The growth curve for Y intersects the decay curve for X after time T. What is the time T ?
View SolutionIn the figure show, if the equivalent resistance between points A and B is x then find 5x. (Given: R=2ohm )
'(##CEN_KSR_PHY_JEE_CO20_E01_009_Q06##)'
View Solution
Knowledge Check
The graph represents the decay of a newly-prepared sample of radioactive nuclide X to a stable nuclide Y. The half-life of X is t. The growth curve for Y intersects the decay curve for X after time T. What is the time T ?
 At/2Bln(t/2)CtDln(2t)
In Fig. X represents time and Y represent activity of a radioactive sample. Then the activity of sample, varies with time according to the curve
 AABBCCDD
The radioactive nucleus of an element X decays to a stable nucleus of element Y.A graph of the rate of romation of Y against time would look like:
A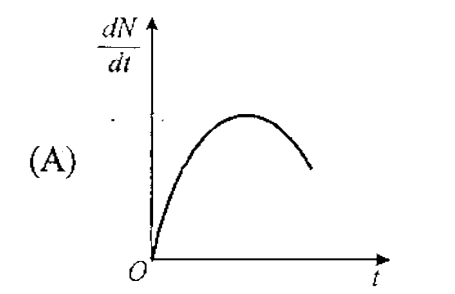 B
B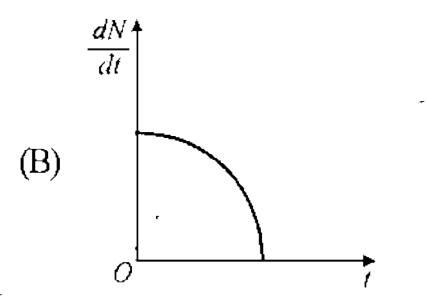 C
C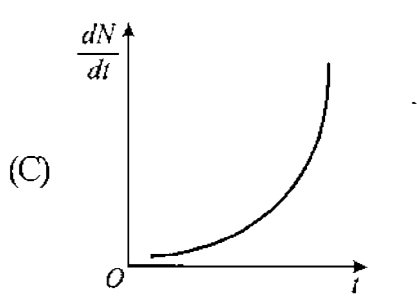 D
D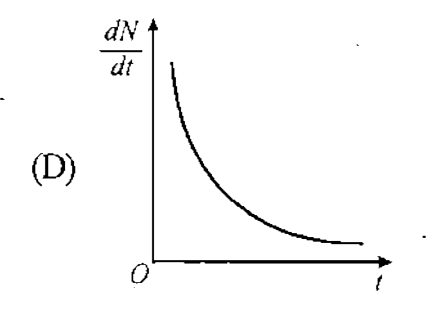
If the current in the circuit sbown below, varying as a function of time is i0sin500t, then find io.
'(##CEN_KSR_PHY_JEE_C24_E01_038_Q21##)'
View SolutionThe graph below shows a particle in simple harmonic motion. From the information shown, find the value of time t1(in S).
'(##CEN_KSR_PHY_JEE_C16_E01_010_Q03##)'
View SolutionThe ratio of time constant in charging and discharging in the circuit shown in the figure is xy. Find (x+y)
'(##CEN_KSR_PHY_JEE_CO23_E01_034_Q12##)'
View SolutionA periodic voltage V varies with time t as shown in the figure. T is the time period. The ms value of the voltage is V0k. Find k.
'(##CEN_KSR_PHY_JEE_C24_E01_004_Q02##)'
View SolutionOne cycle of an altemating curreat is shown in the graph. The rms vatue of the current from t=0 to t=T is √2xi9. Find x.
'(##CEN_KSR_PHY_JEE_C24_E01_007_Q04##)'
View Solution
