If 0≤t≤1, which of the following graphs is the graph of y versus x where x and y are related by the parametric equations y=t2 and x=√t ?
A
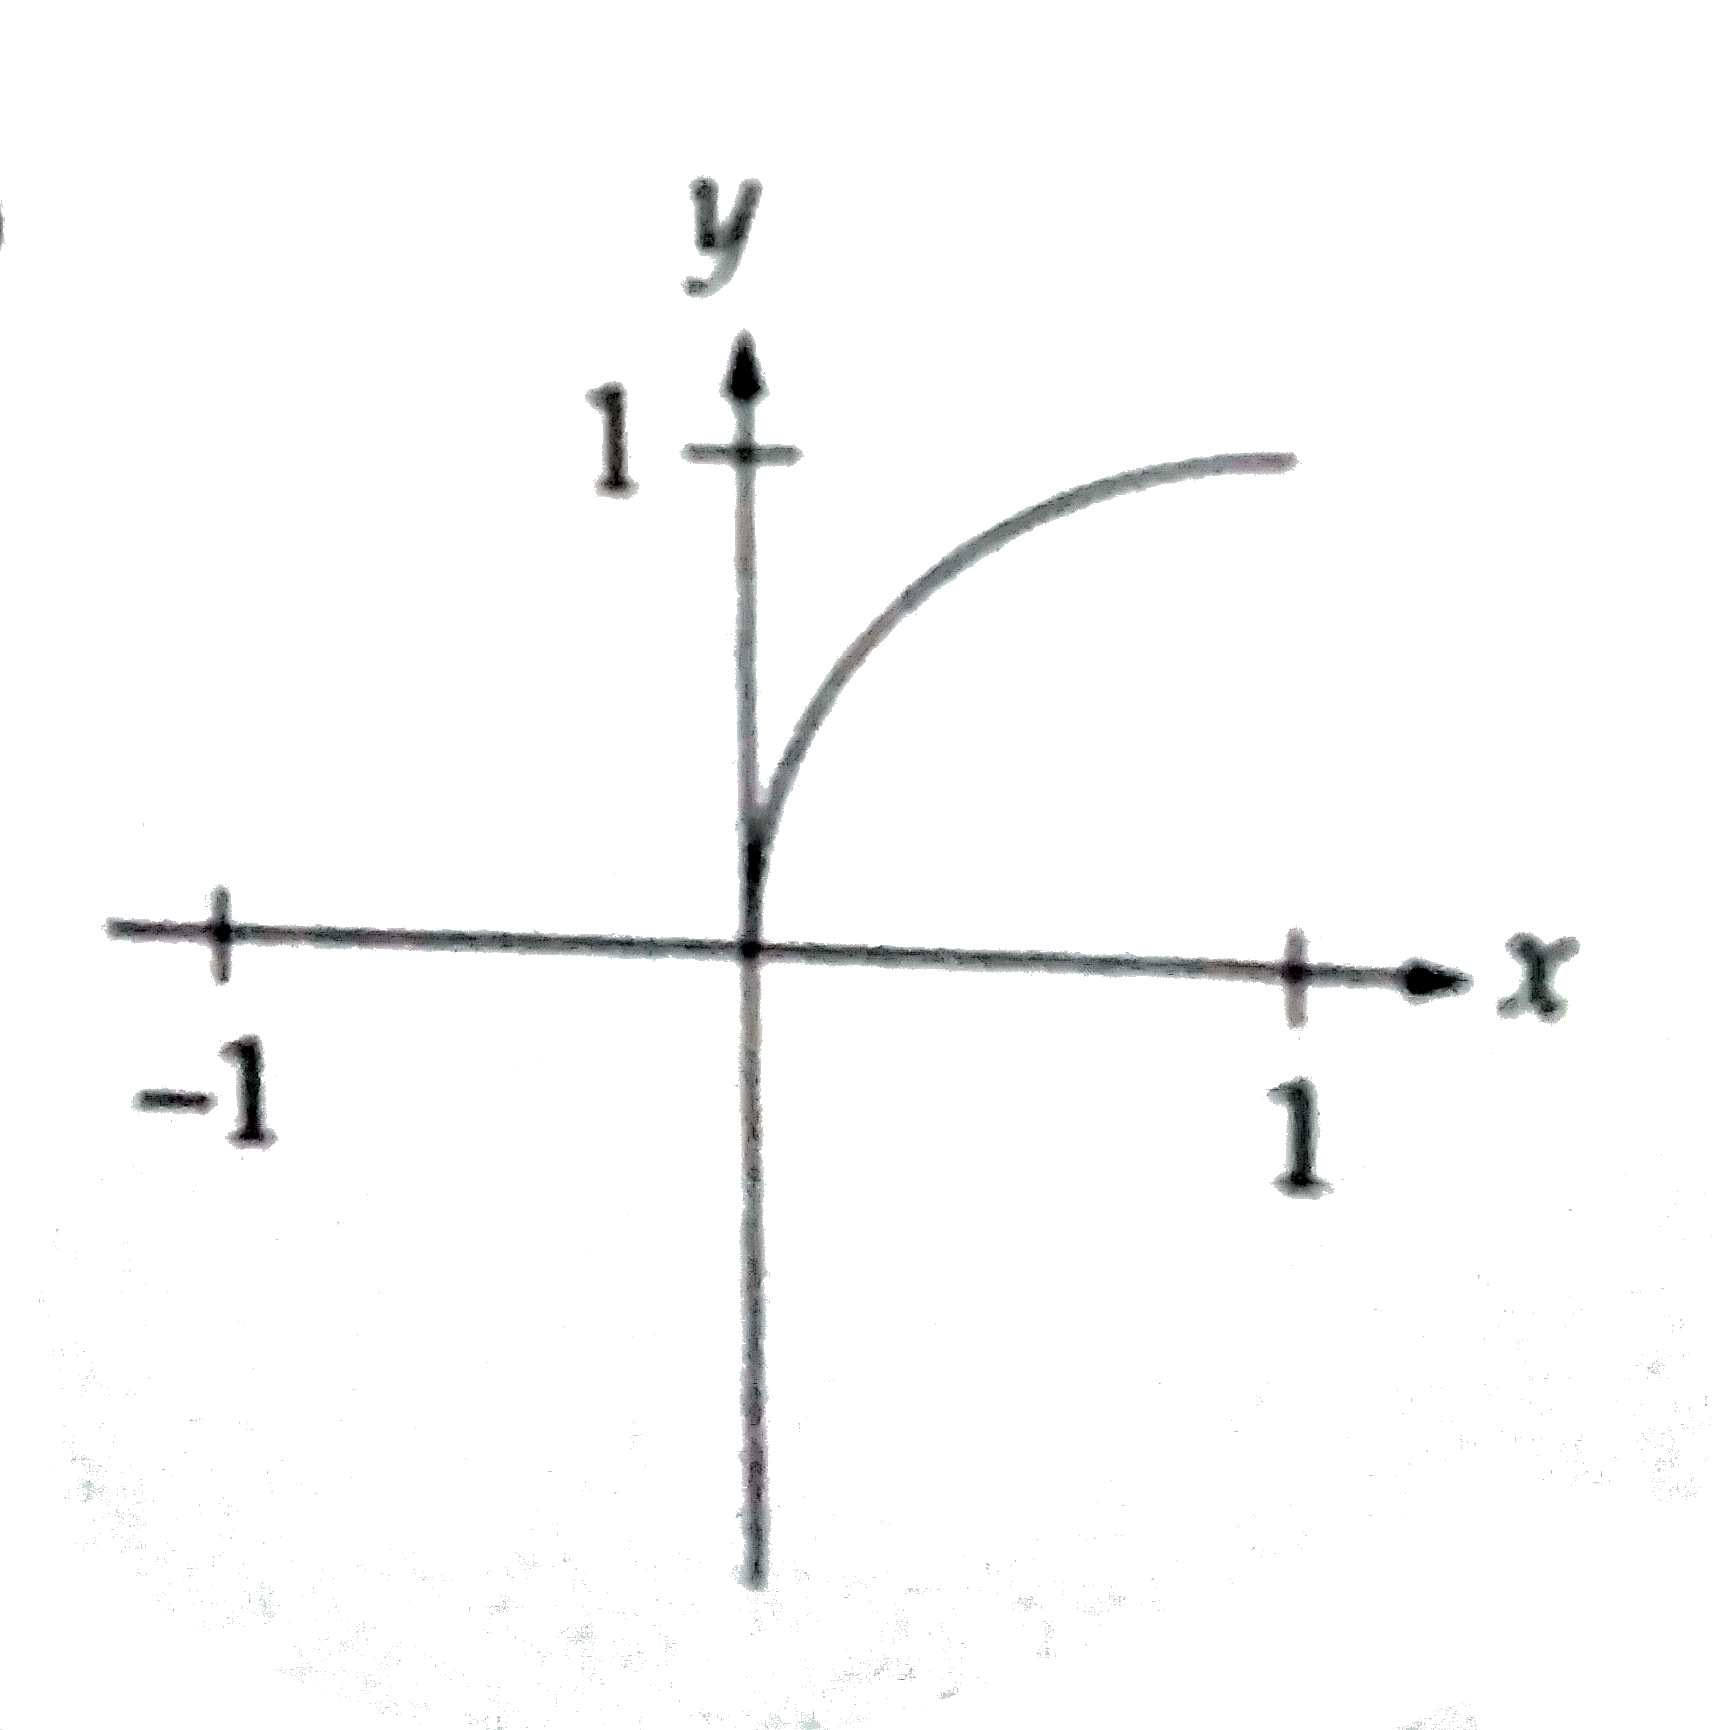
B
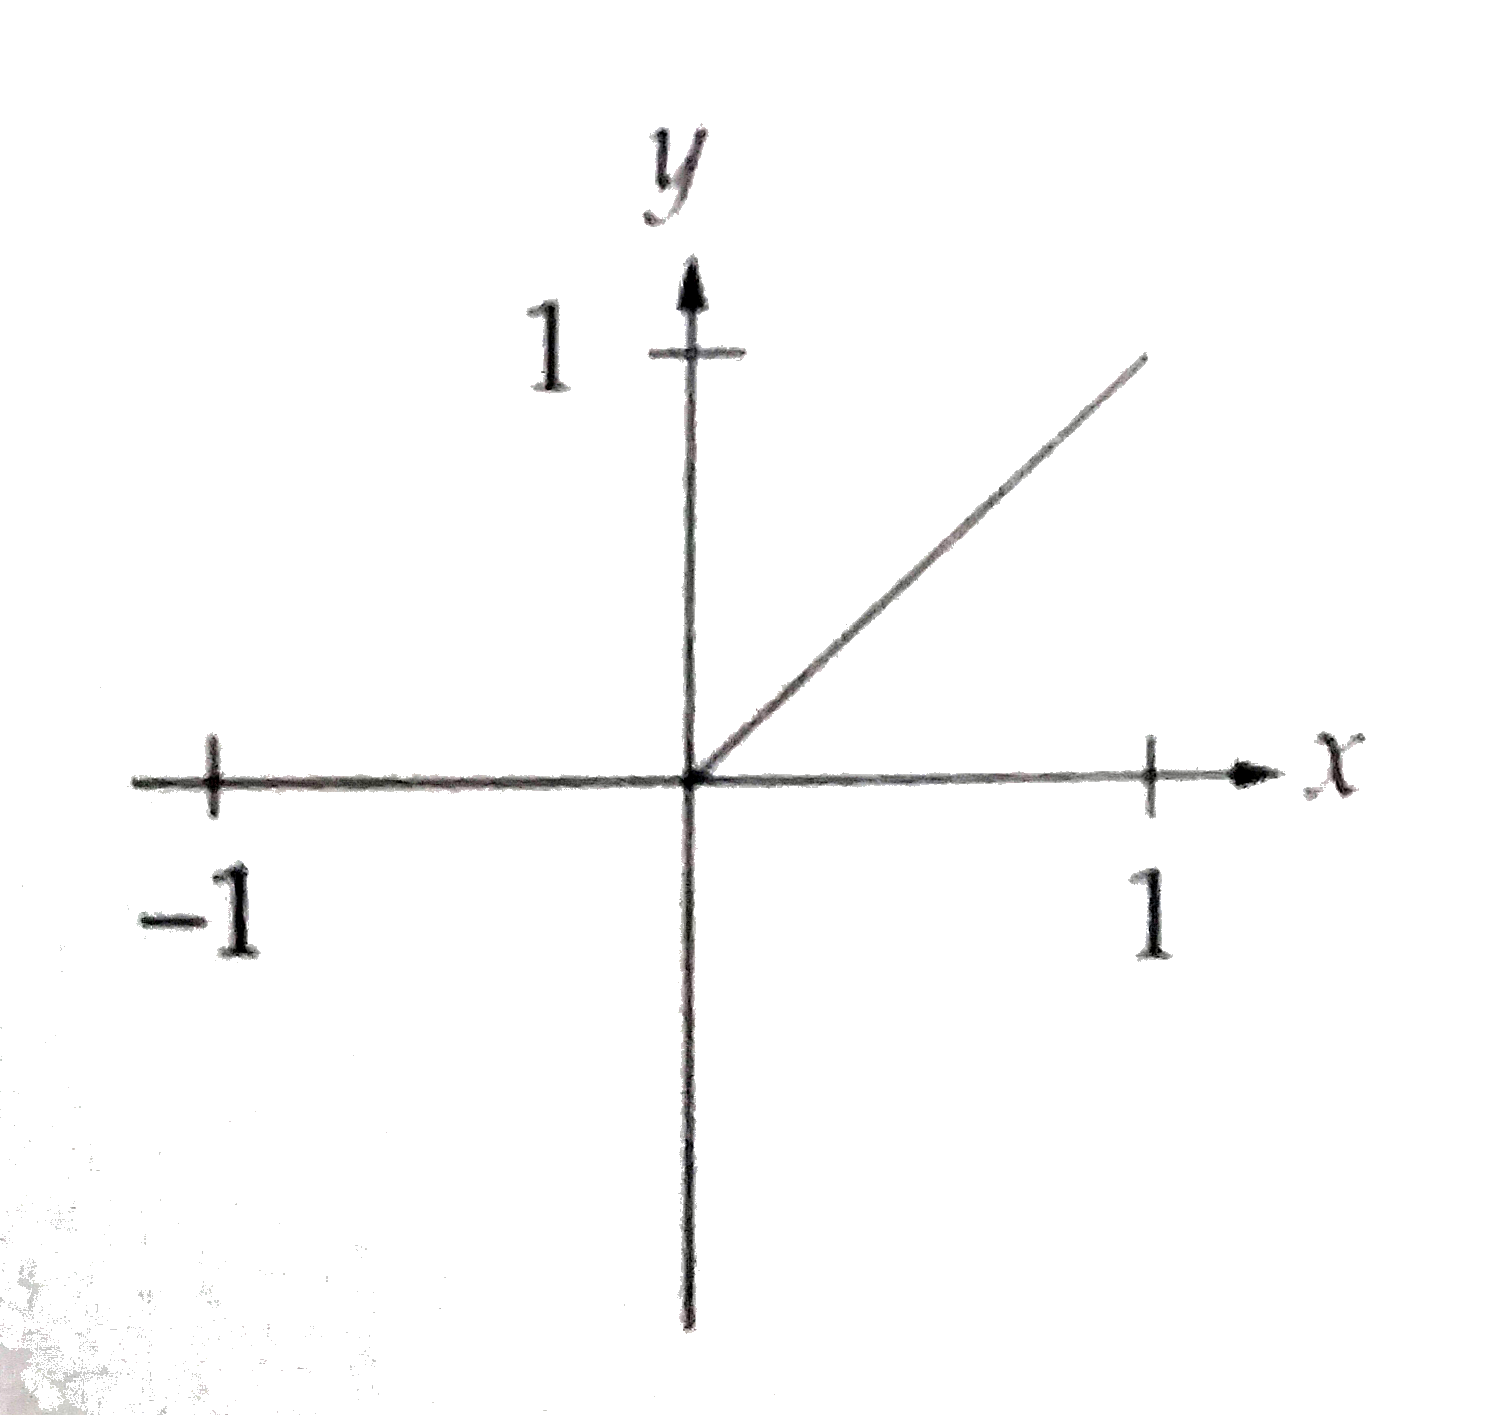
C
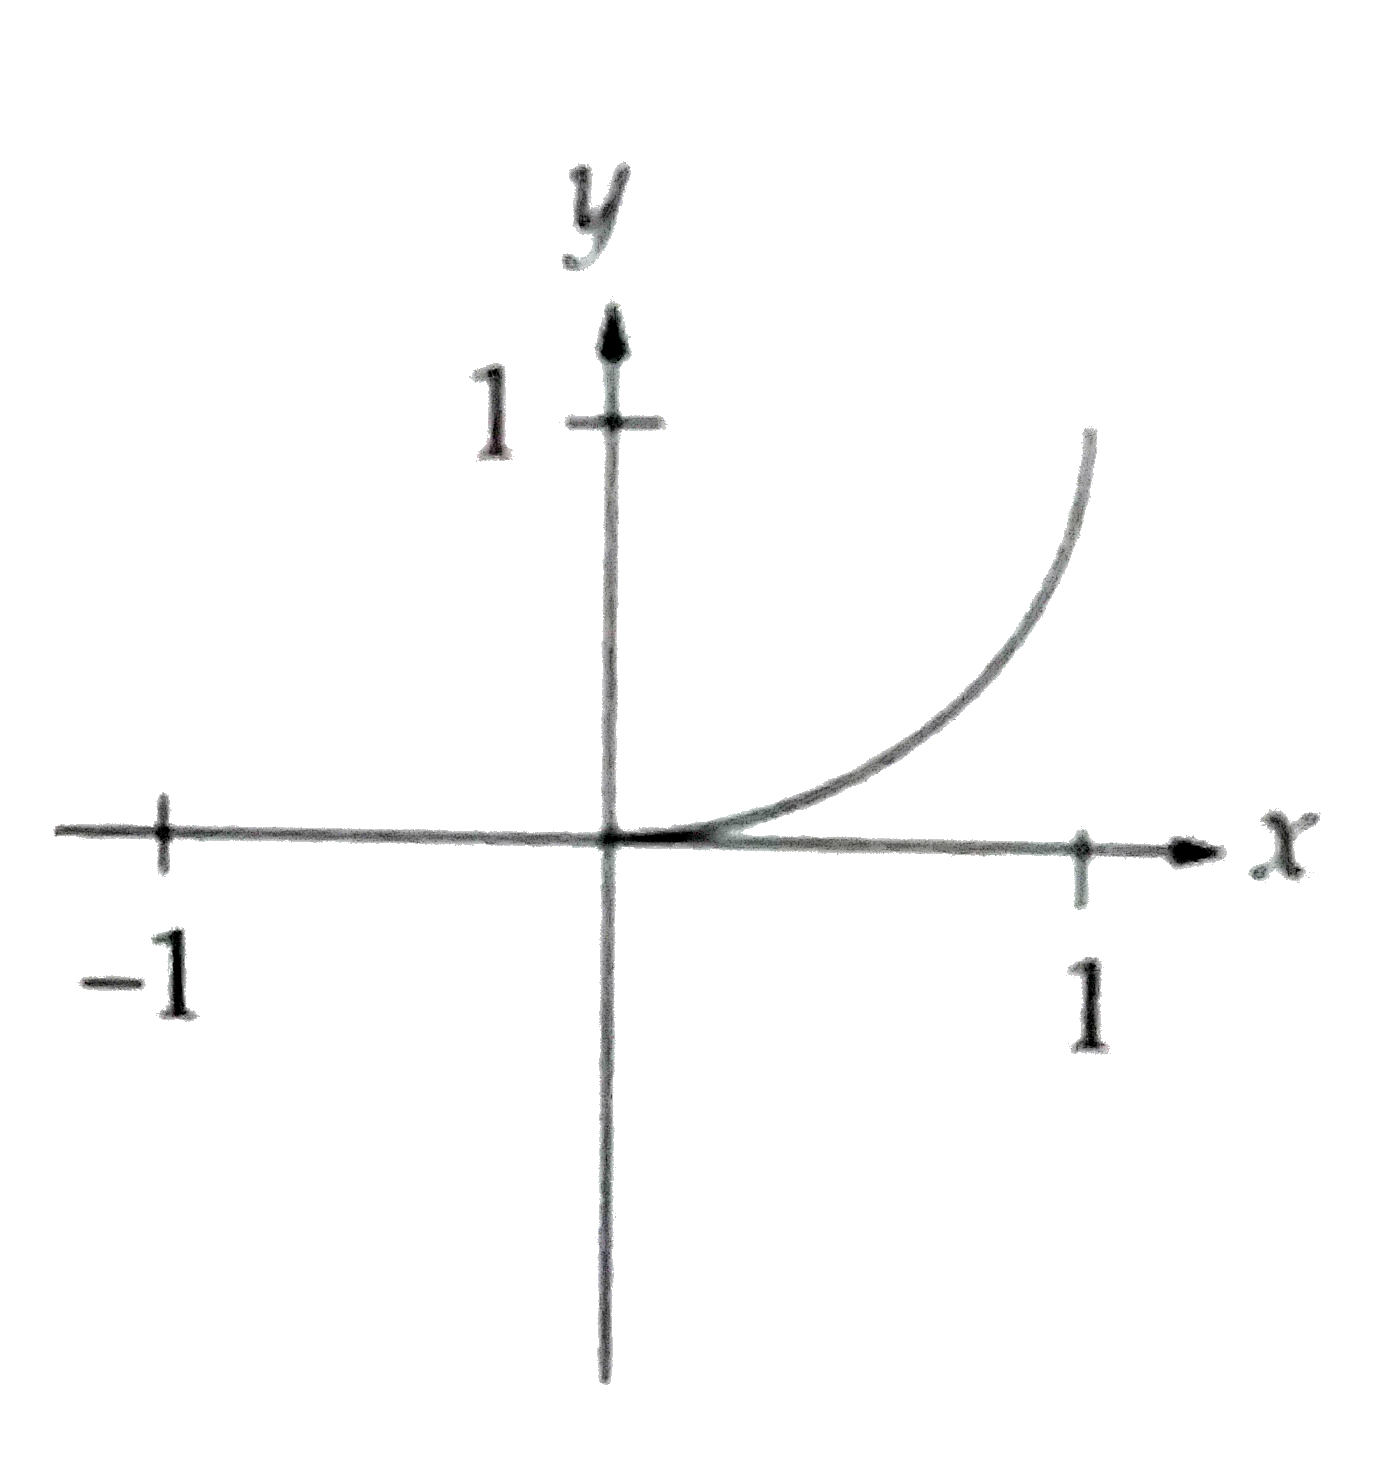
D
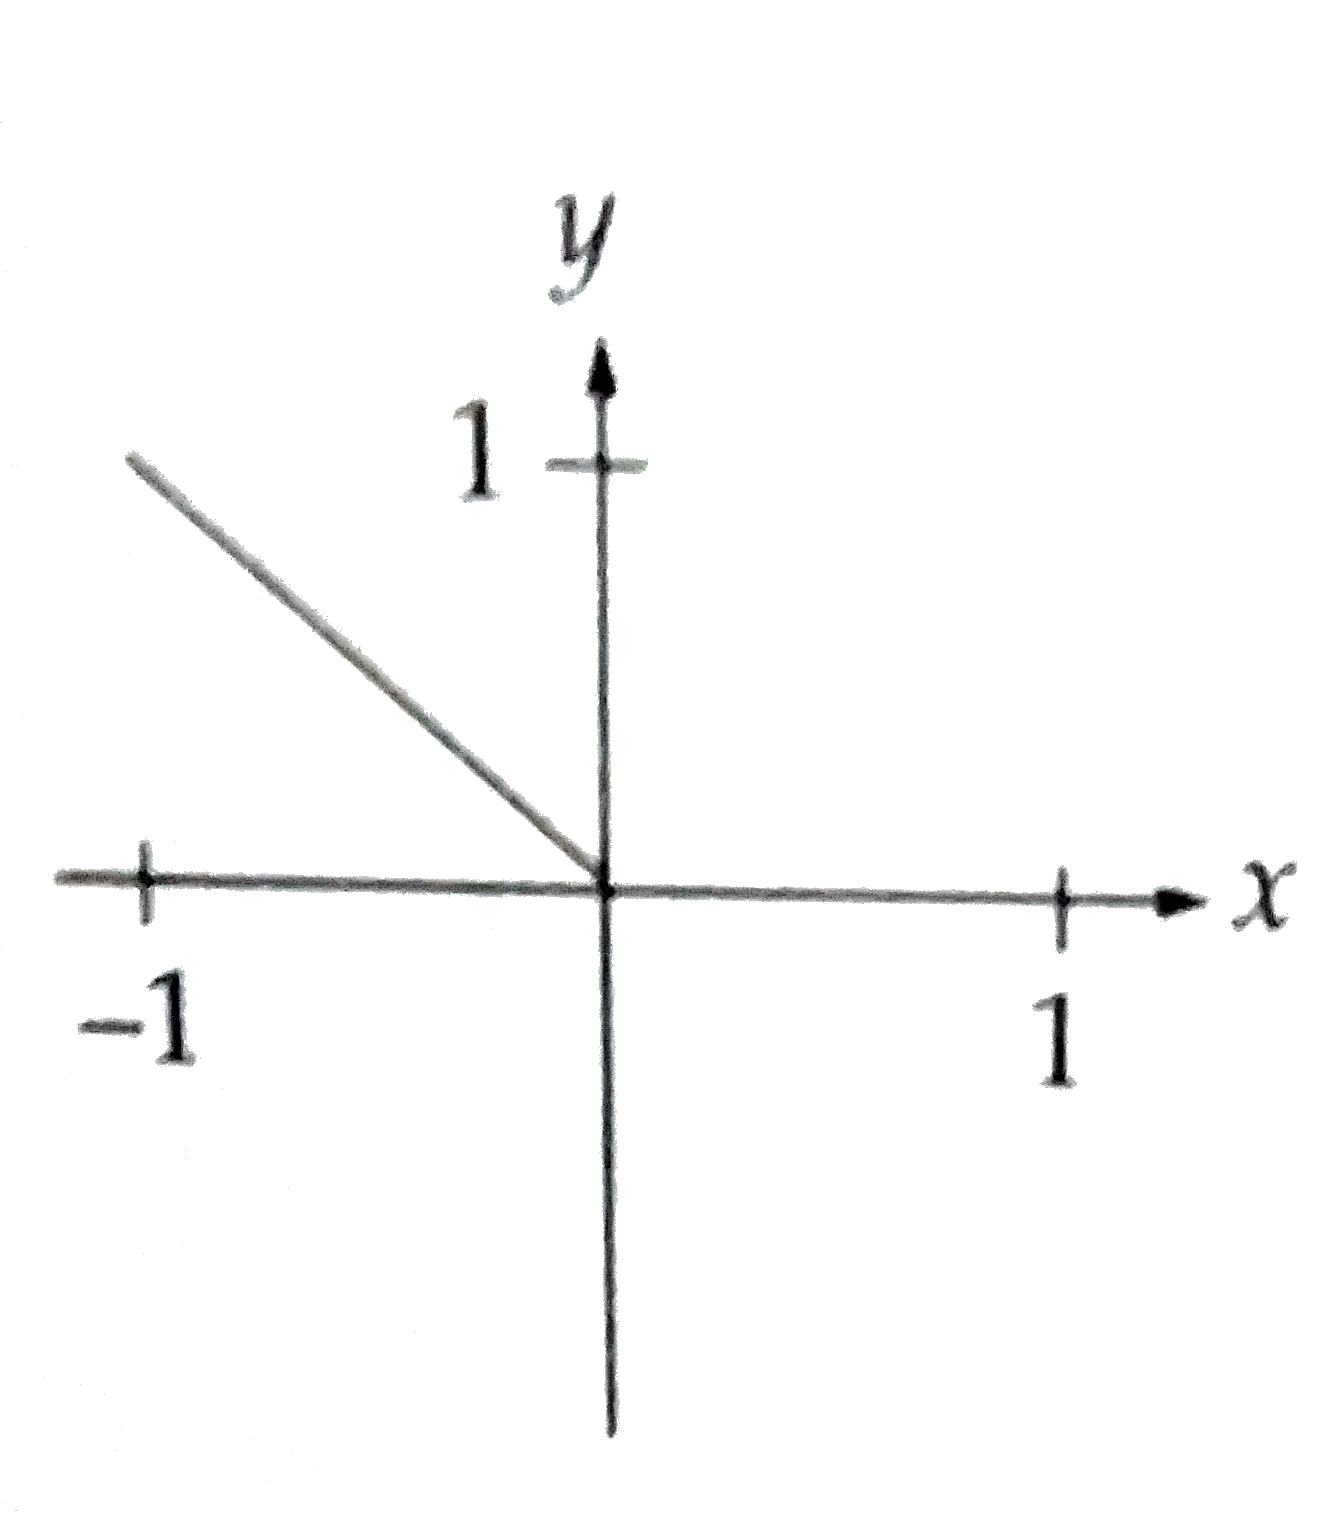
Video Solution
Text Solution
The correct Answer is:C
Combine the equations so as to lose t and get y in terms of x :
x=√t
x2=t
y=t2
y=(x2)=x4
So you might be tempted by (D), which looks like the graphs of y=x4. But the stem says that 0≤t≤1, so the only possible values of x=√t are 0≤x≤1, so the correct graph is (C ).
|
Topper's Solved these Questions
Similar Questions
Knowledge Check
In the graph of the parametric equation {x=t2+ty=t2−t
Ax≥0Bx≥−14Cx is any real numberDx≥−1The graph of y=(x+2)(2x-3) can be expressed as a set of parametric equations. If x=2t-2 and y=f(t) , then f(t)=
A2t(4t-5)B(2t-2)(4t-7)C2t(4t-7)D(2t-2)(4t-5)−2y≤8
y−3≤x
−13y+1≥x
Which of the following graphs shows the solutions to the system of inequalities above?A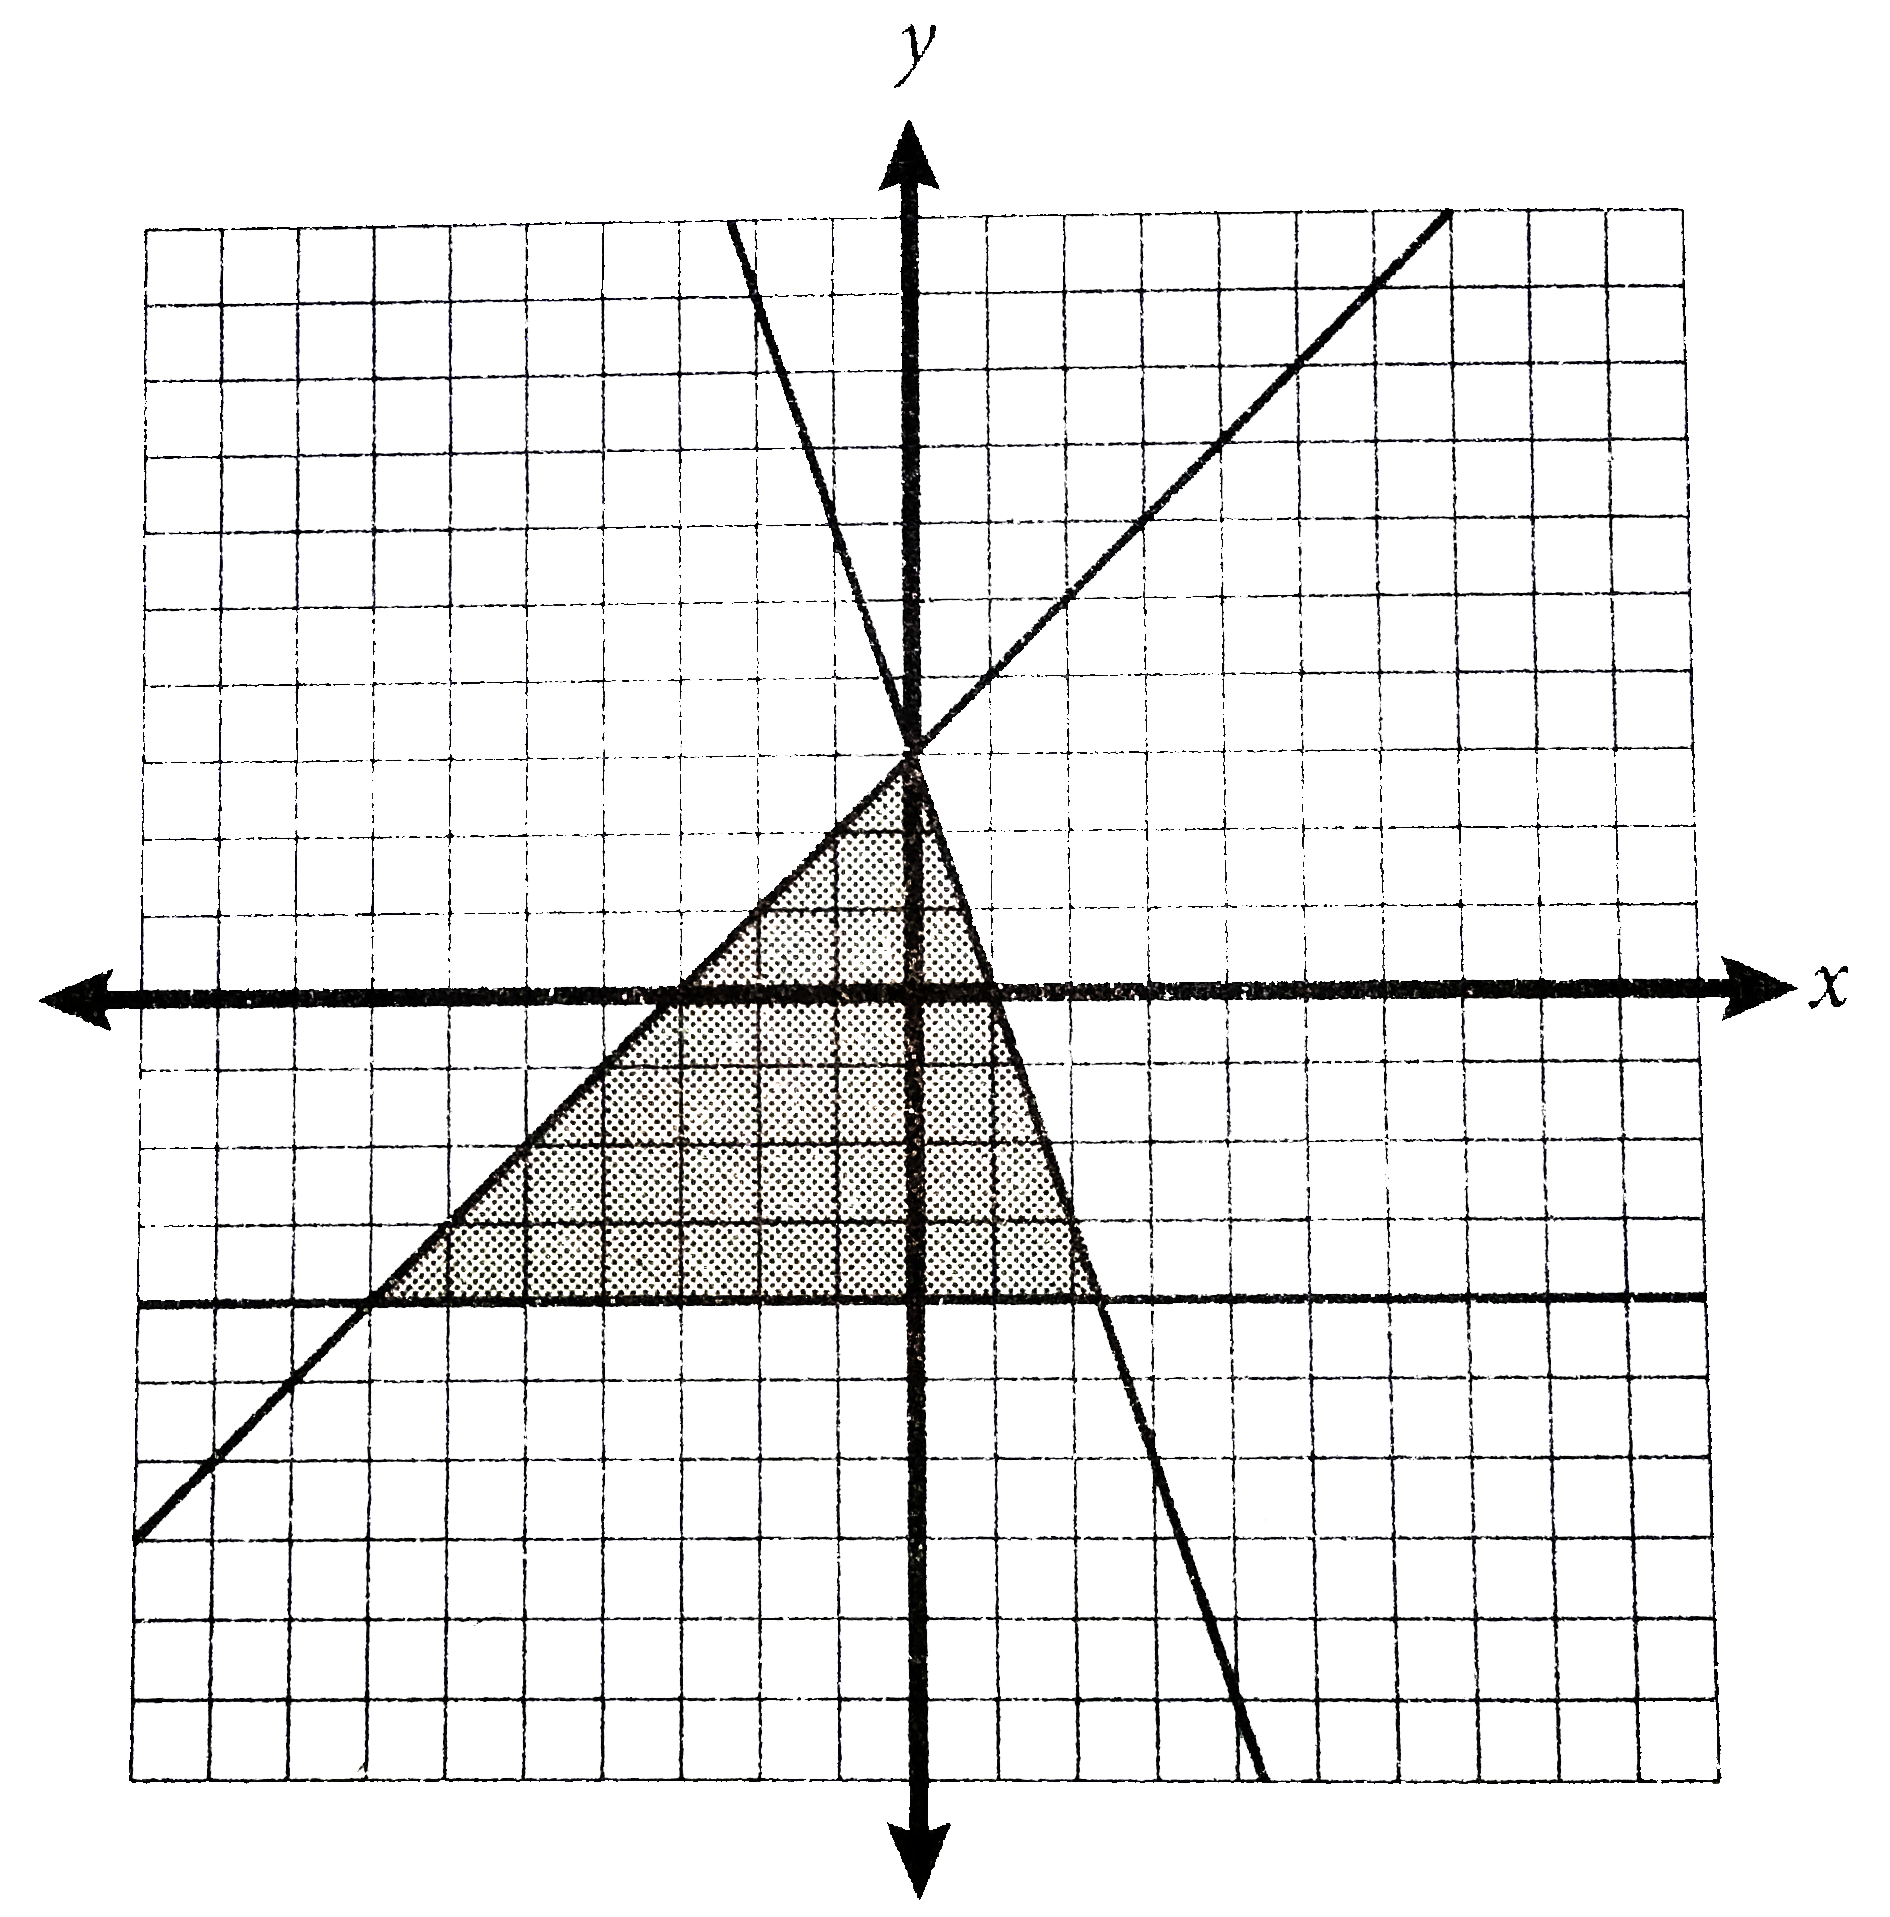 B
B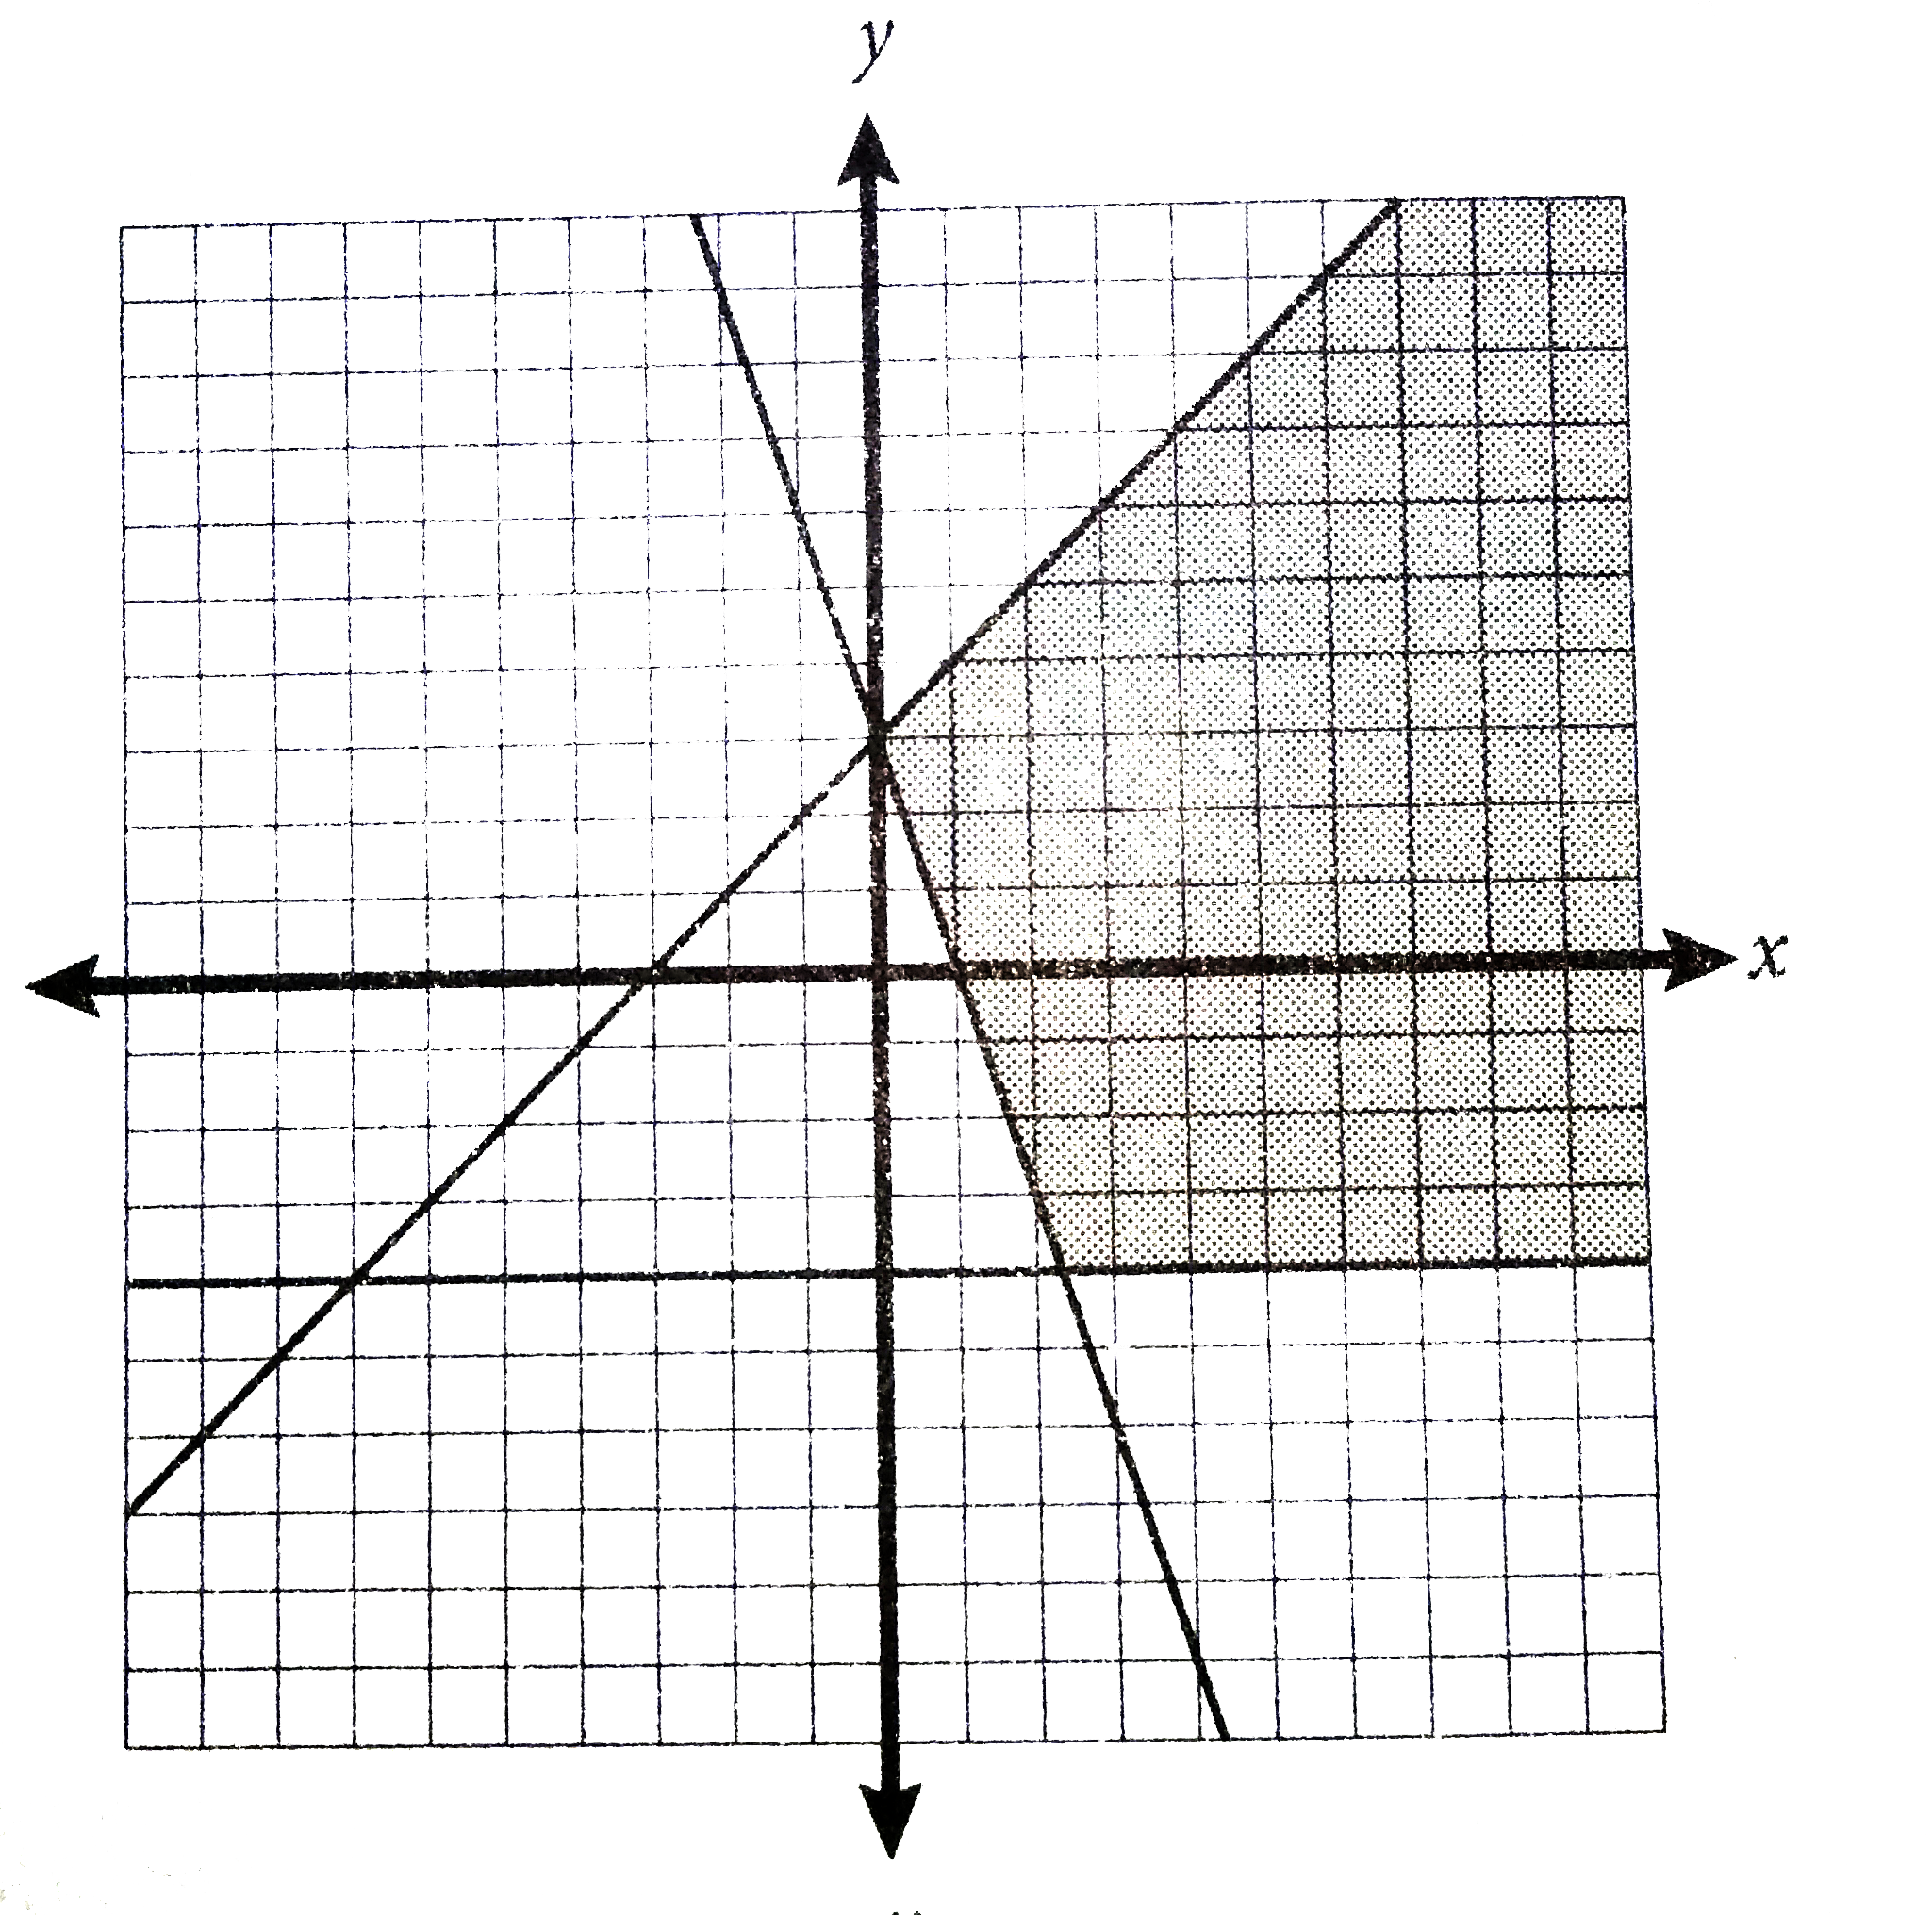 C
C D
D
If 2≤|x|≤5, then find the values of x from the graph of y=|x|.
View SolutionThe focus of the conic represented parametrically by the equation y=t2+3,x=2t−1is
View SolutionThe graph represented by the equations x=sin2t,y=2cost is
View SolutionFind the cartesian equation of the curve whose parametric equations are :
x=t,y=t2
View SolutionDraw the graph of y=|x|1/2 for −1≤x≤1.
View Solution
