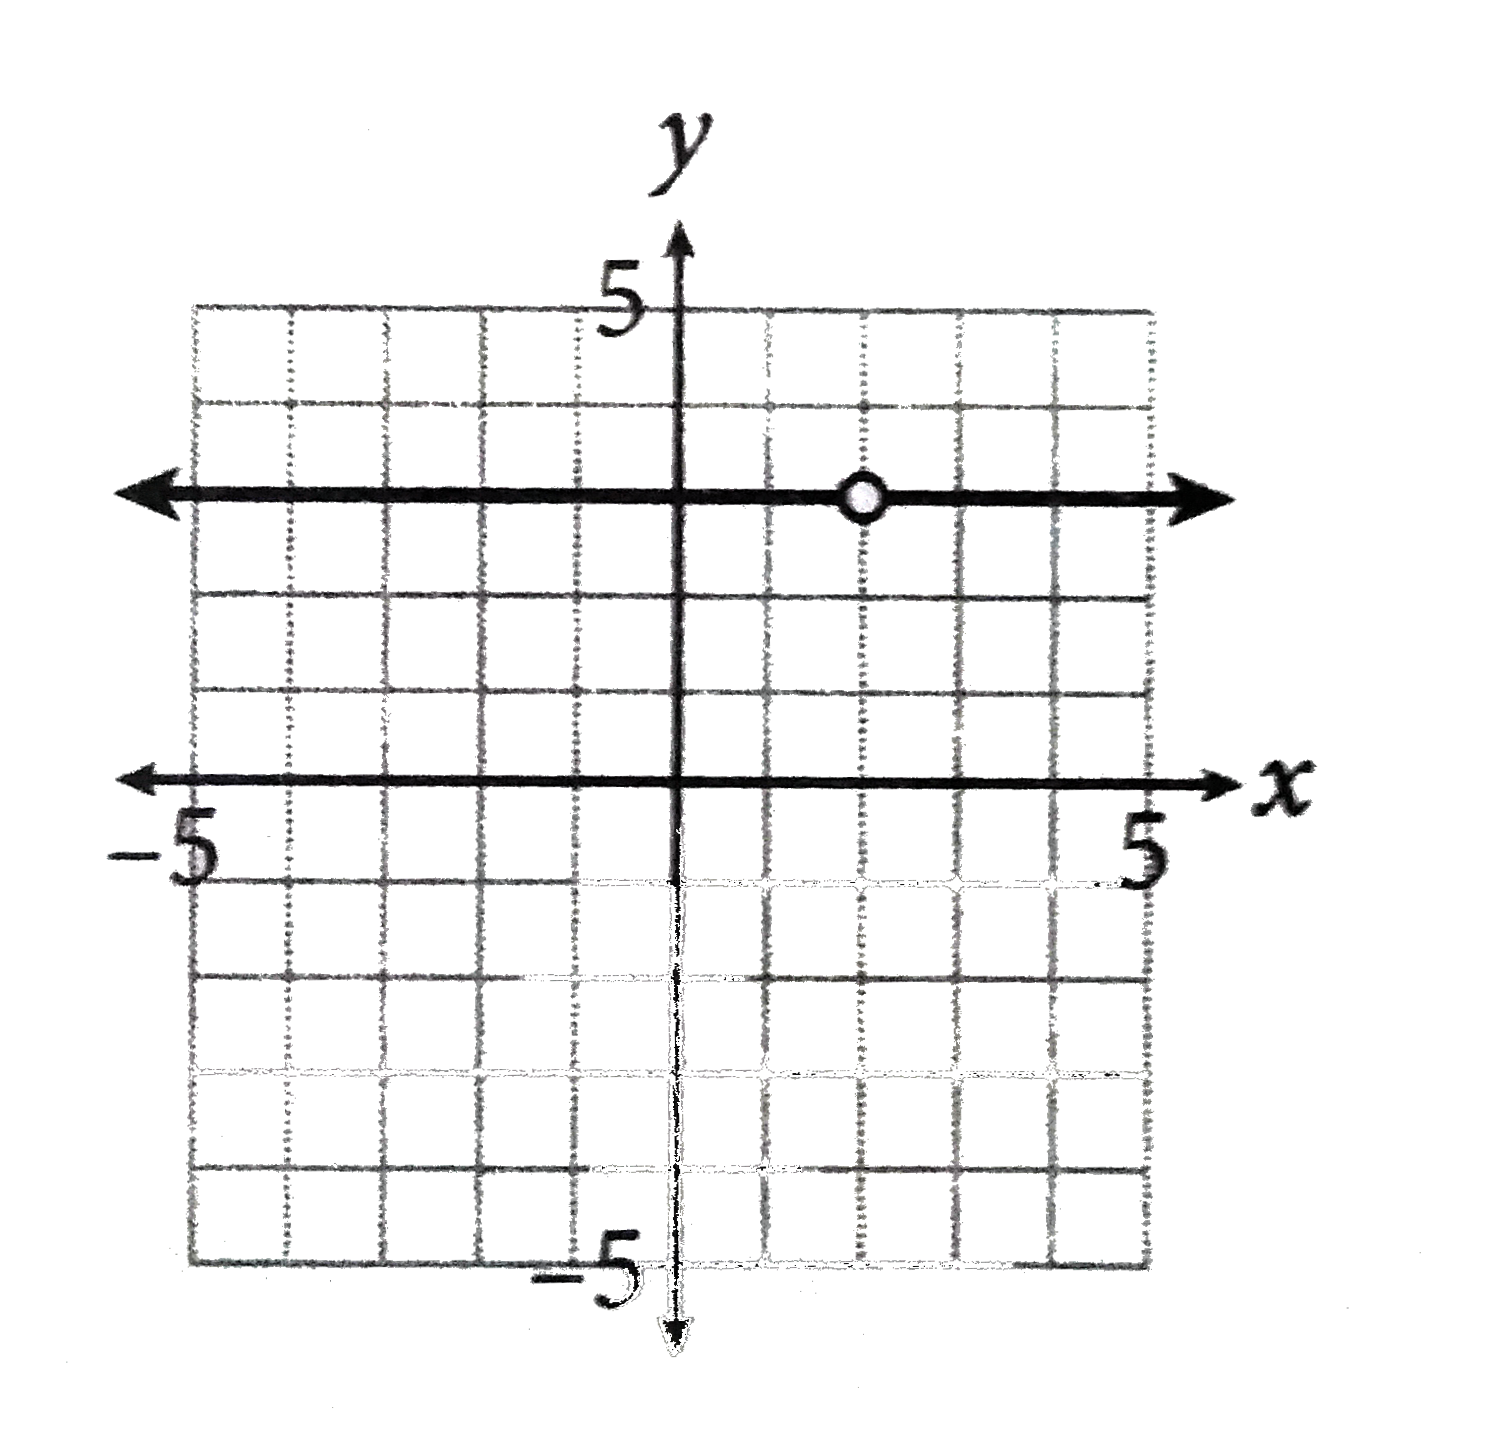
Which of the following rational functions could represent the graph shown?
A
r(x)=3
B
r(x)=x−3x−2
C
r(x)=2x−3
D
r(x)=3x−6x−2
Video Solution
Text Solution
The correct Answer is:D
Difficult: Easy
Category: Passport to Advanced Math/ Exponents
Strategic advice: When matching a graph to an equation, look for key freatures for the graph, particularly when there is a feature that stands out.
Getting to the Answer: There is a "hole" in this graph (the open dot), which means that the function is not defined at perticular value of x, in this cause x=2 ( the x-coordinate of the open dot). Thnk about what could cause that. A denominator that equals 0 when x=2 is the correct choices-you can eliminate A(because there is no denominaton), and you can eliminate C not x=2). To choose between B and (D), simplify the functions to see which results in a horizontal line at r(x)=3 (because the line is at y=3). The function in B doesn't simplify at all skip it for now. For (D):
r(x)=3x−6x−2
r(x)=3(x−2)x−2
r(x)=3
The equation in (D) is indeed a horizontal line at y=3 with a "hole" at x=2.
|
Topper's Solved these Questions
Similar Questions
Knowledge Check
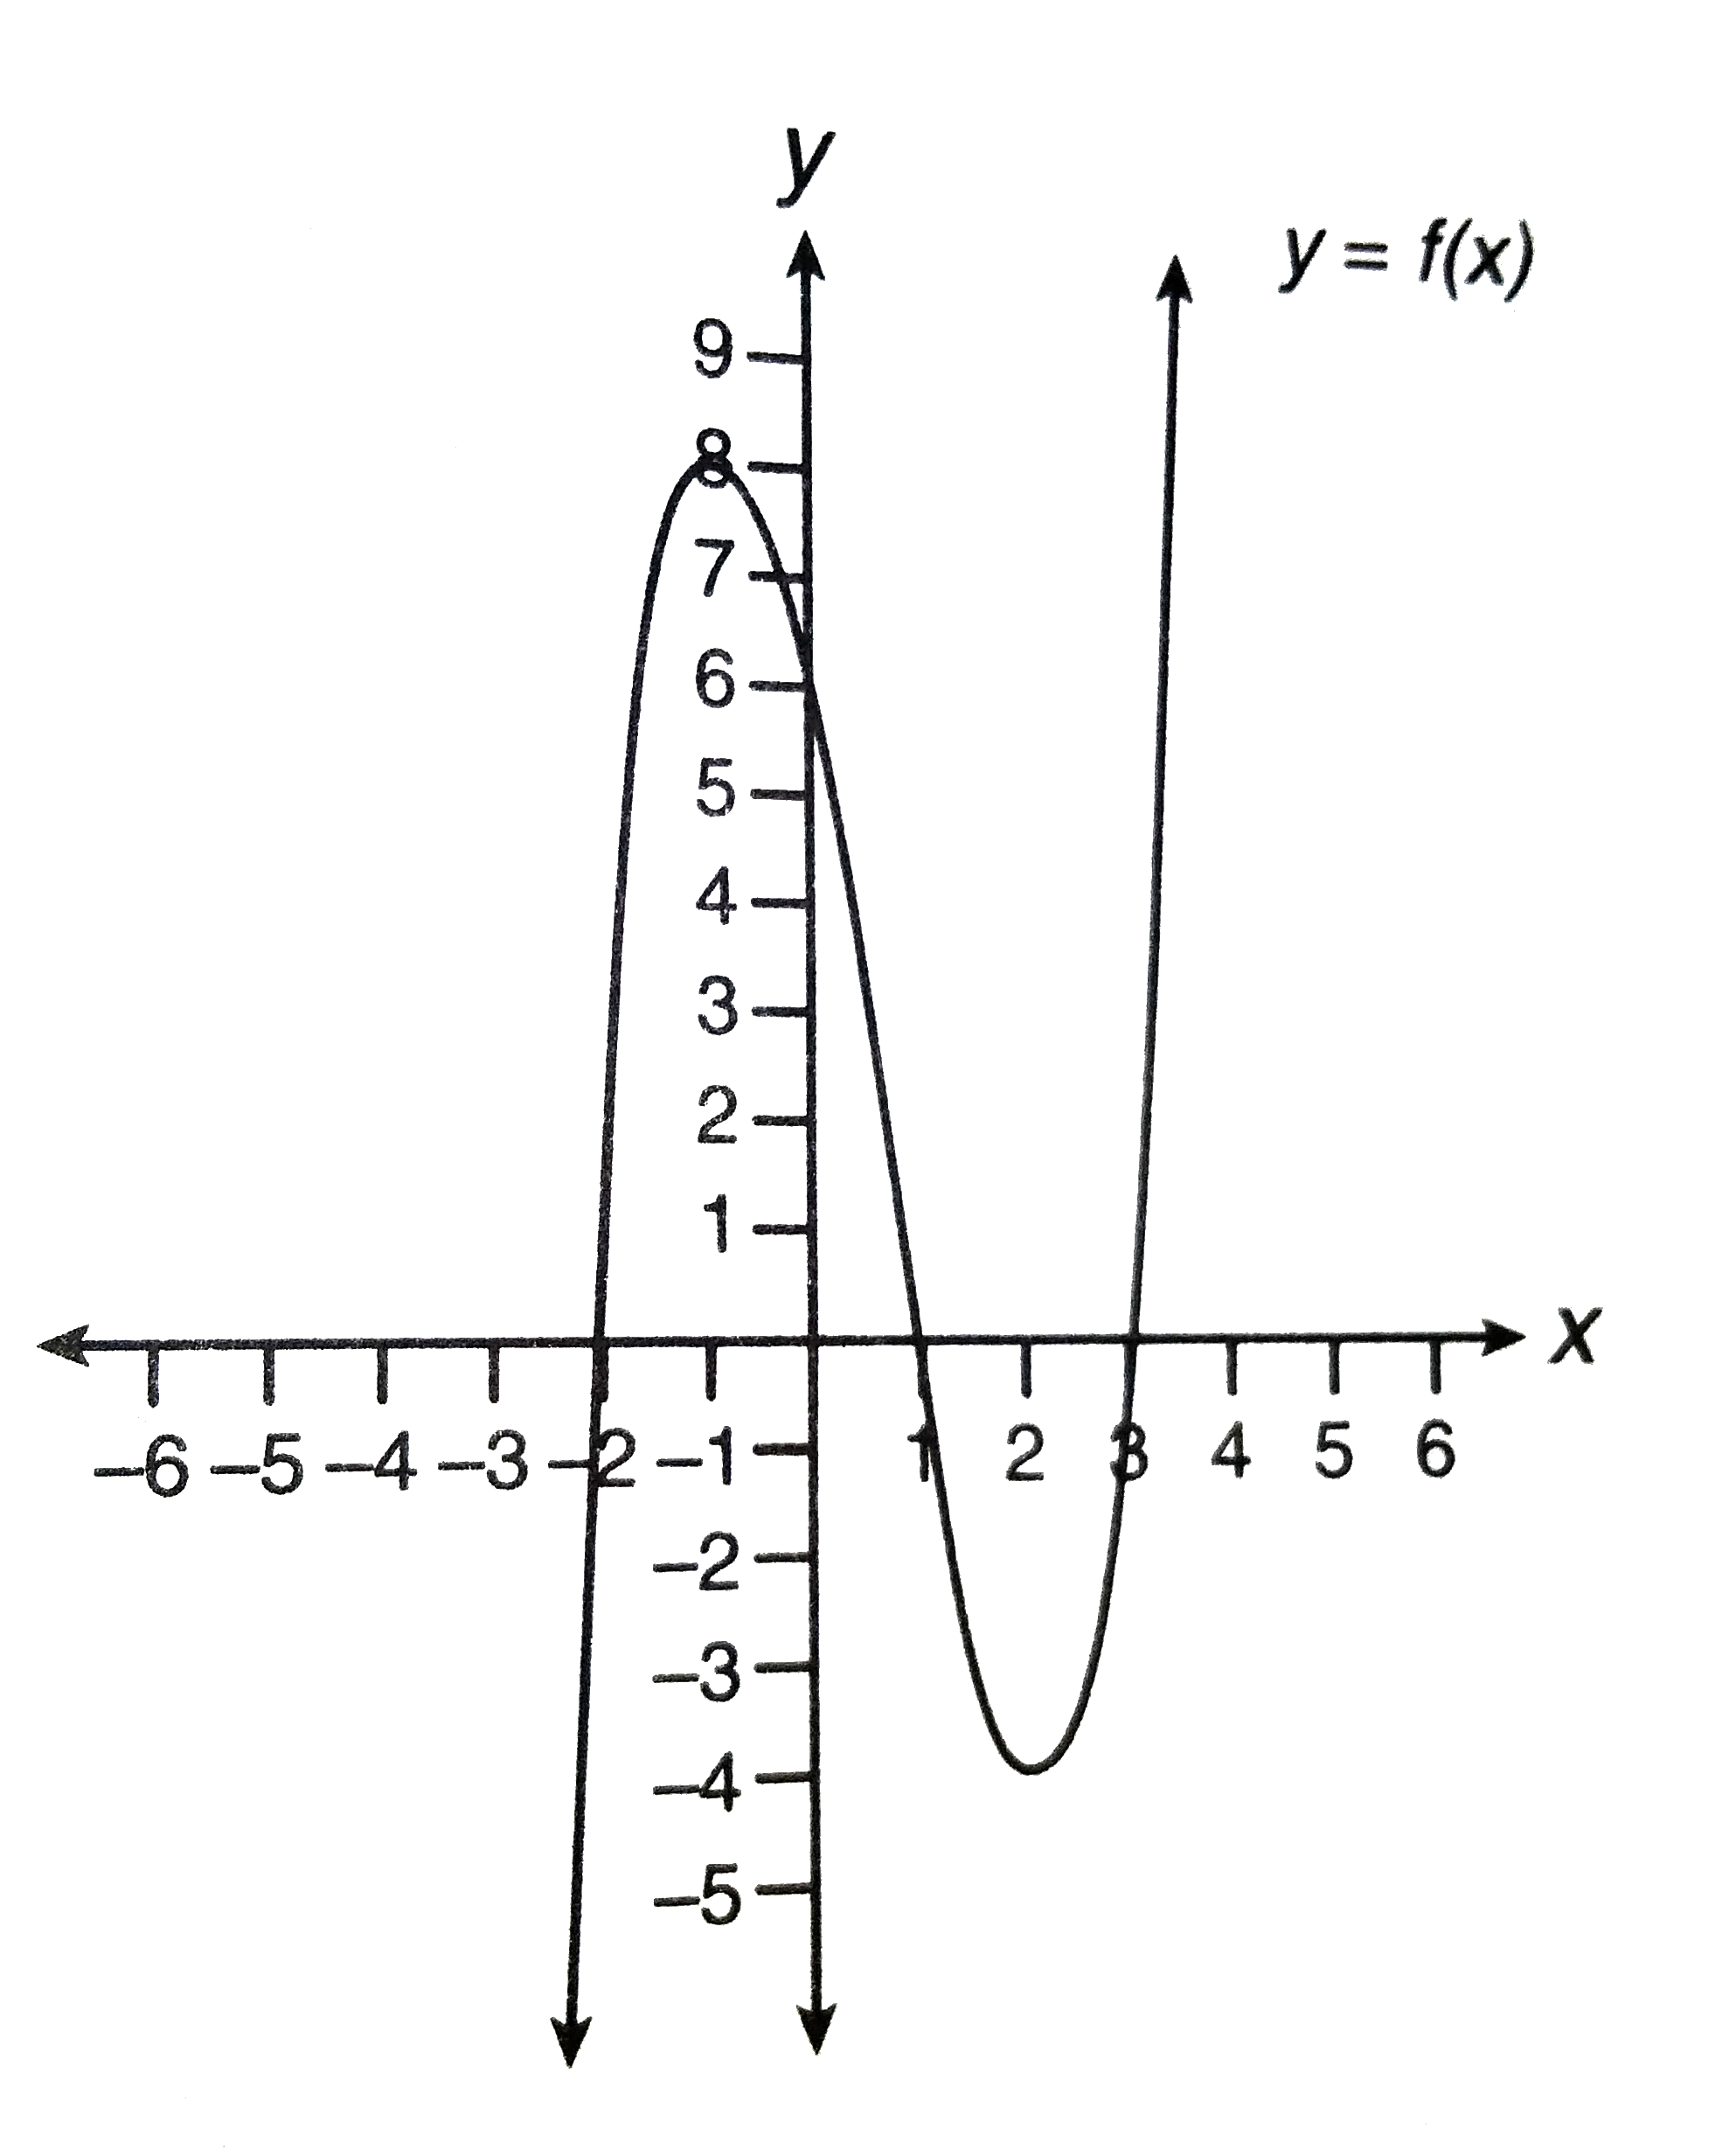
Which function could represents the graph above?Af(x)=(x−6)(x2−4x+3)Bf(x)=(x−3)(x2+x−2)Cf(x)=(x−1)(x2−5x−6)Df(x)=(x+2)(x2−4x−12)Which of the following graphs is NOT a function ?
A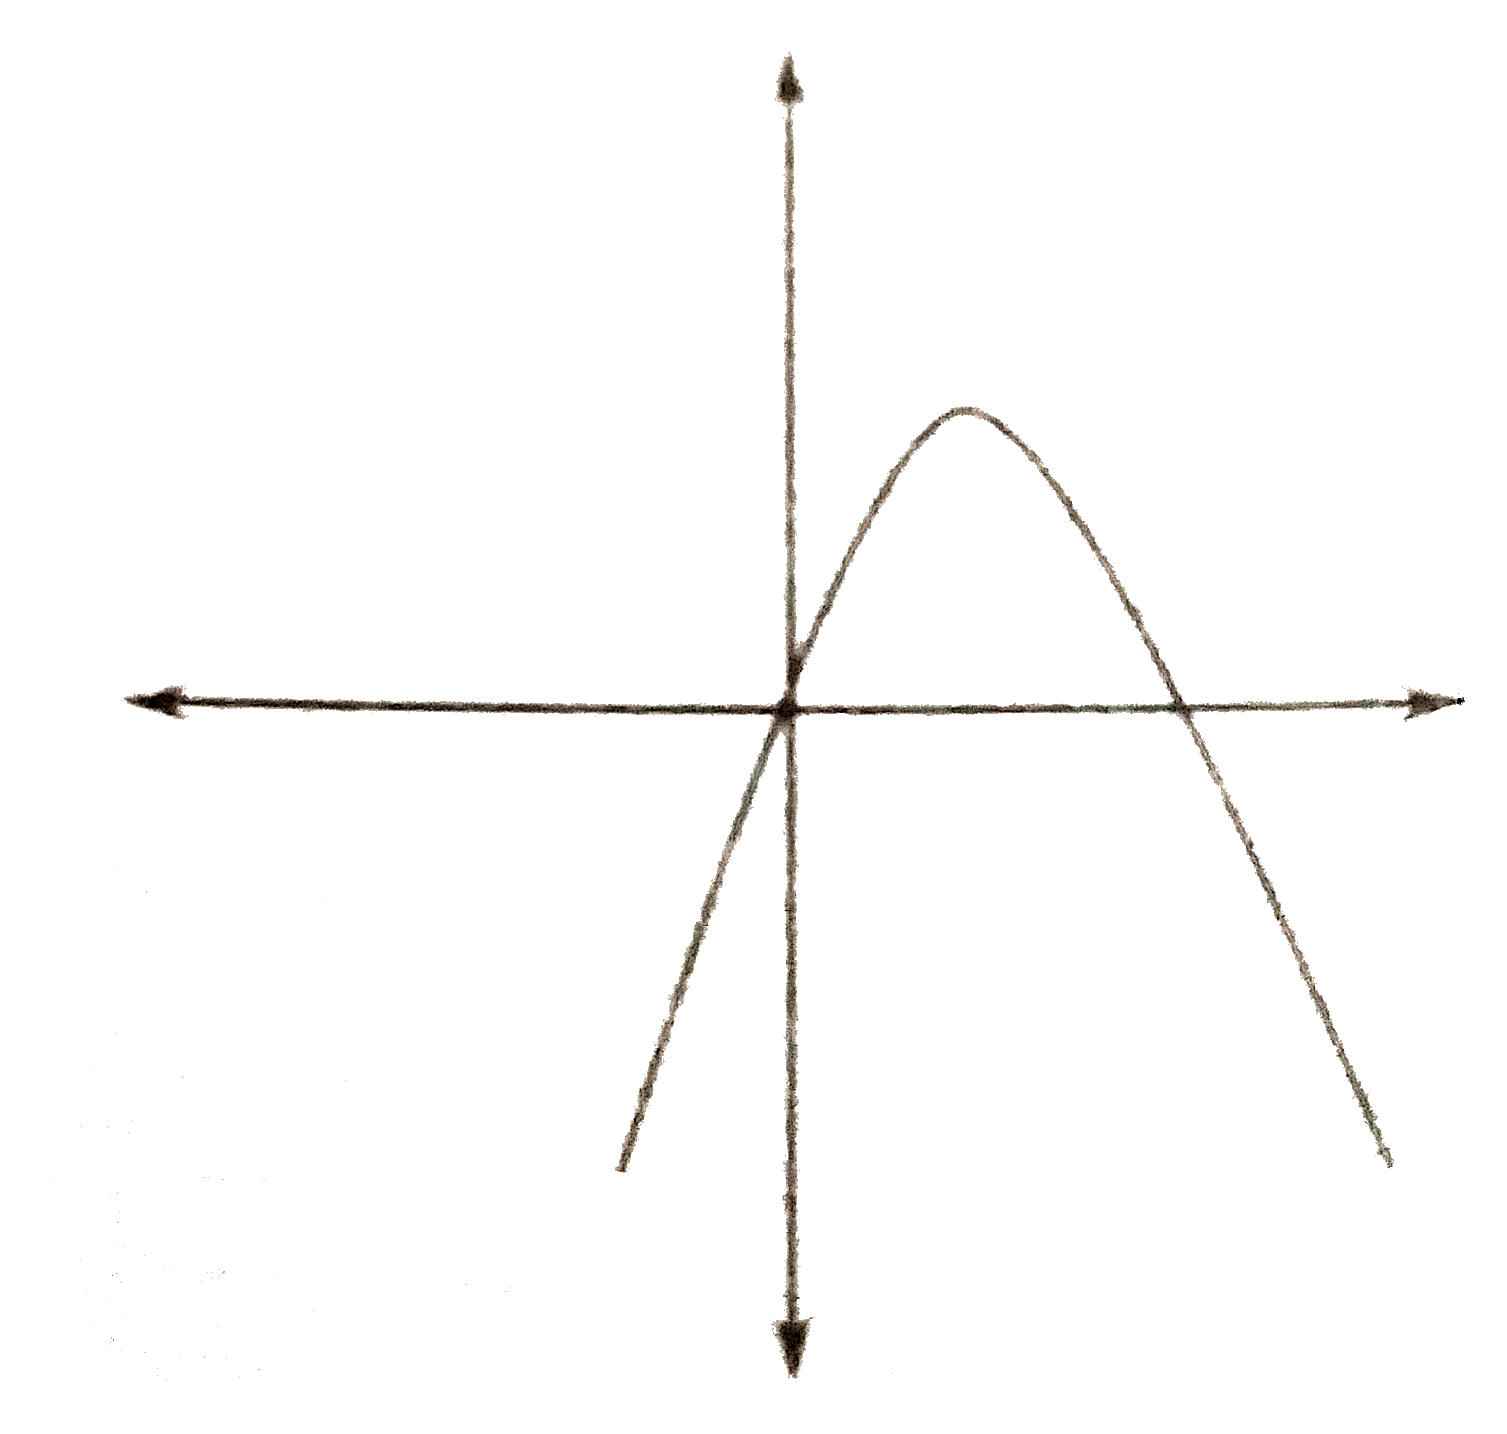 B
B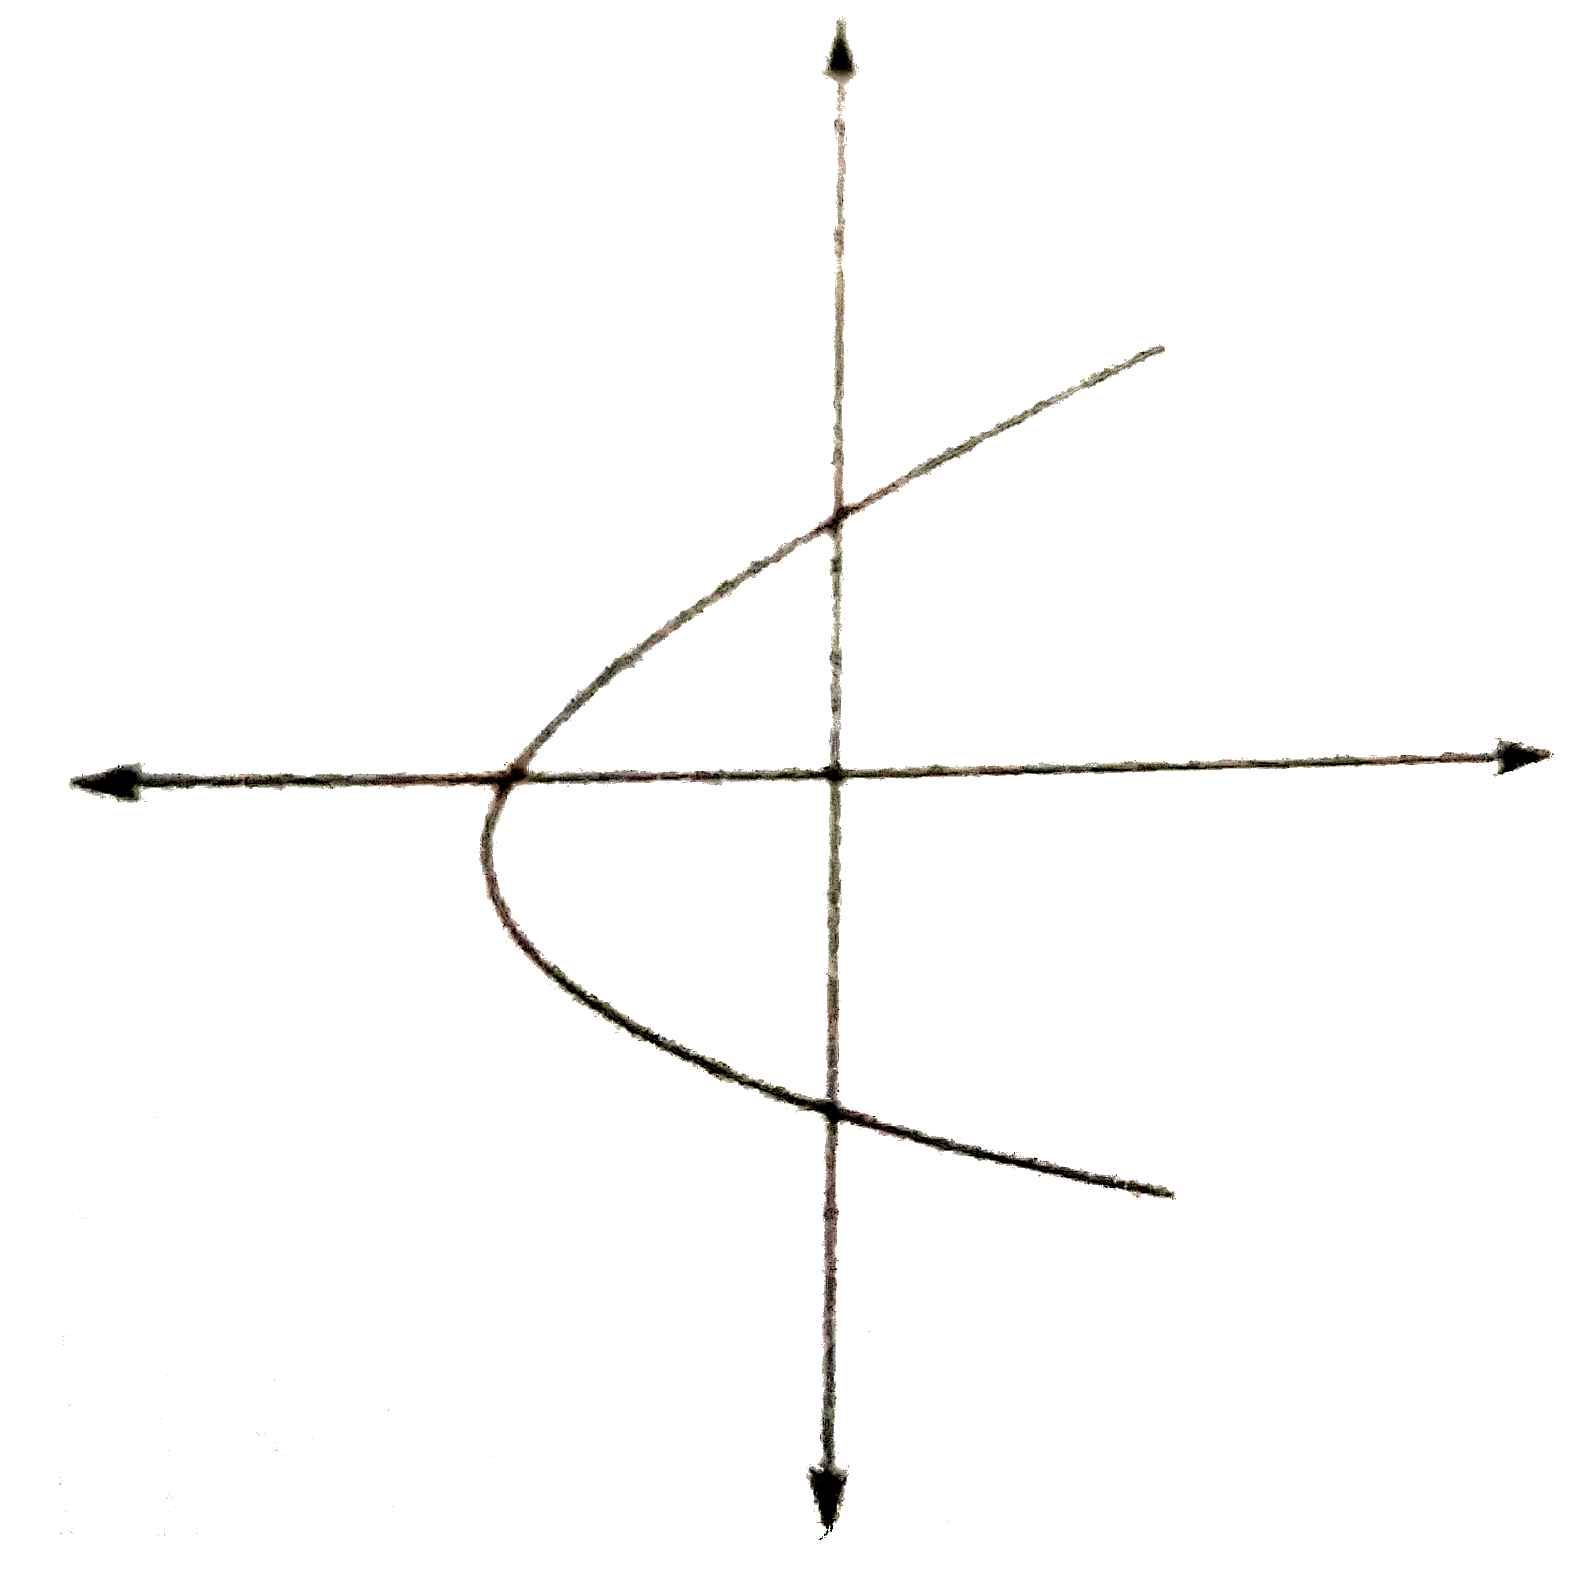 C
C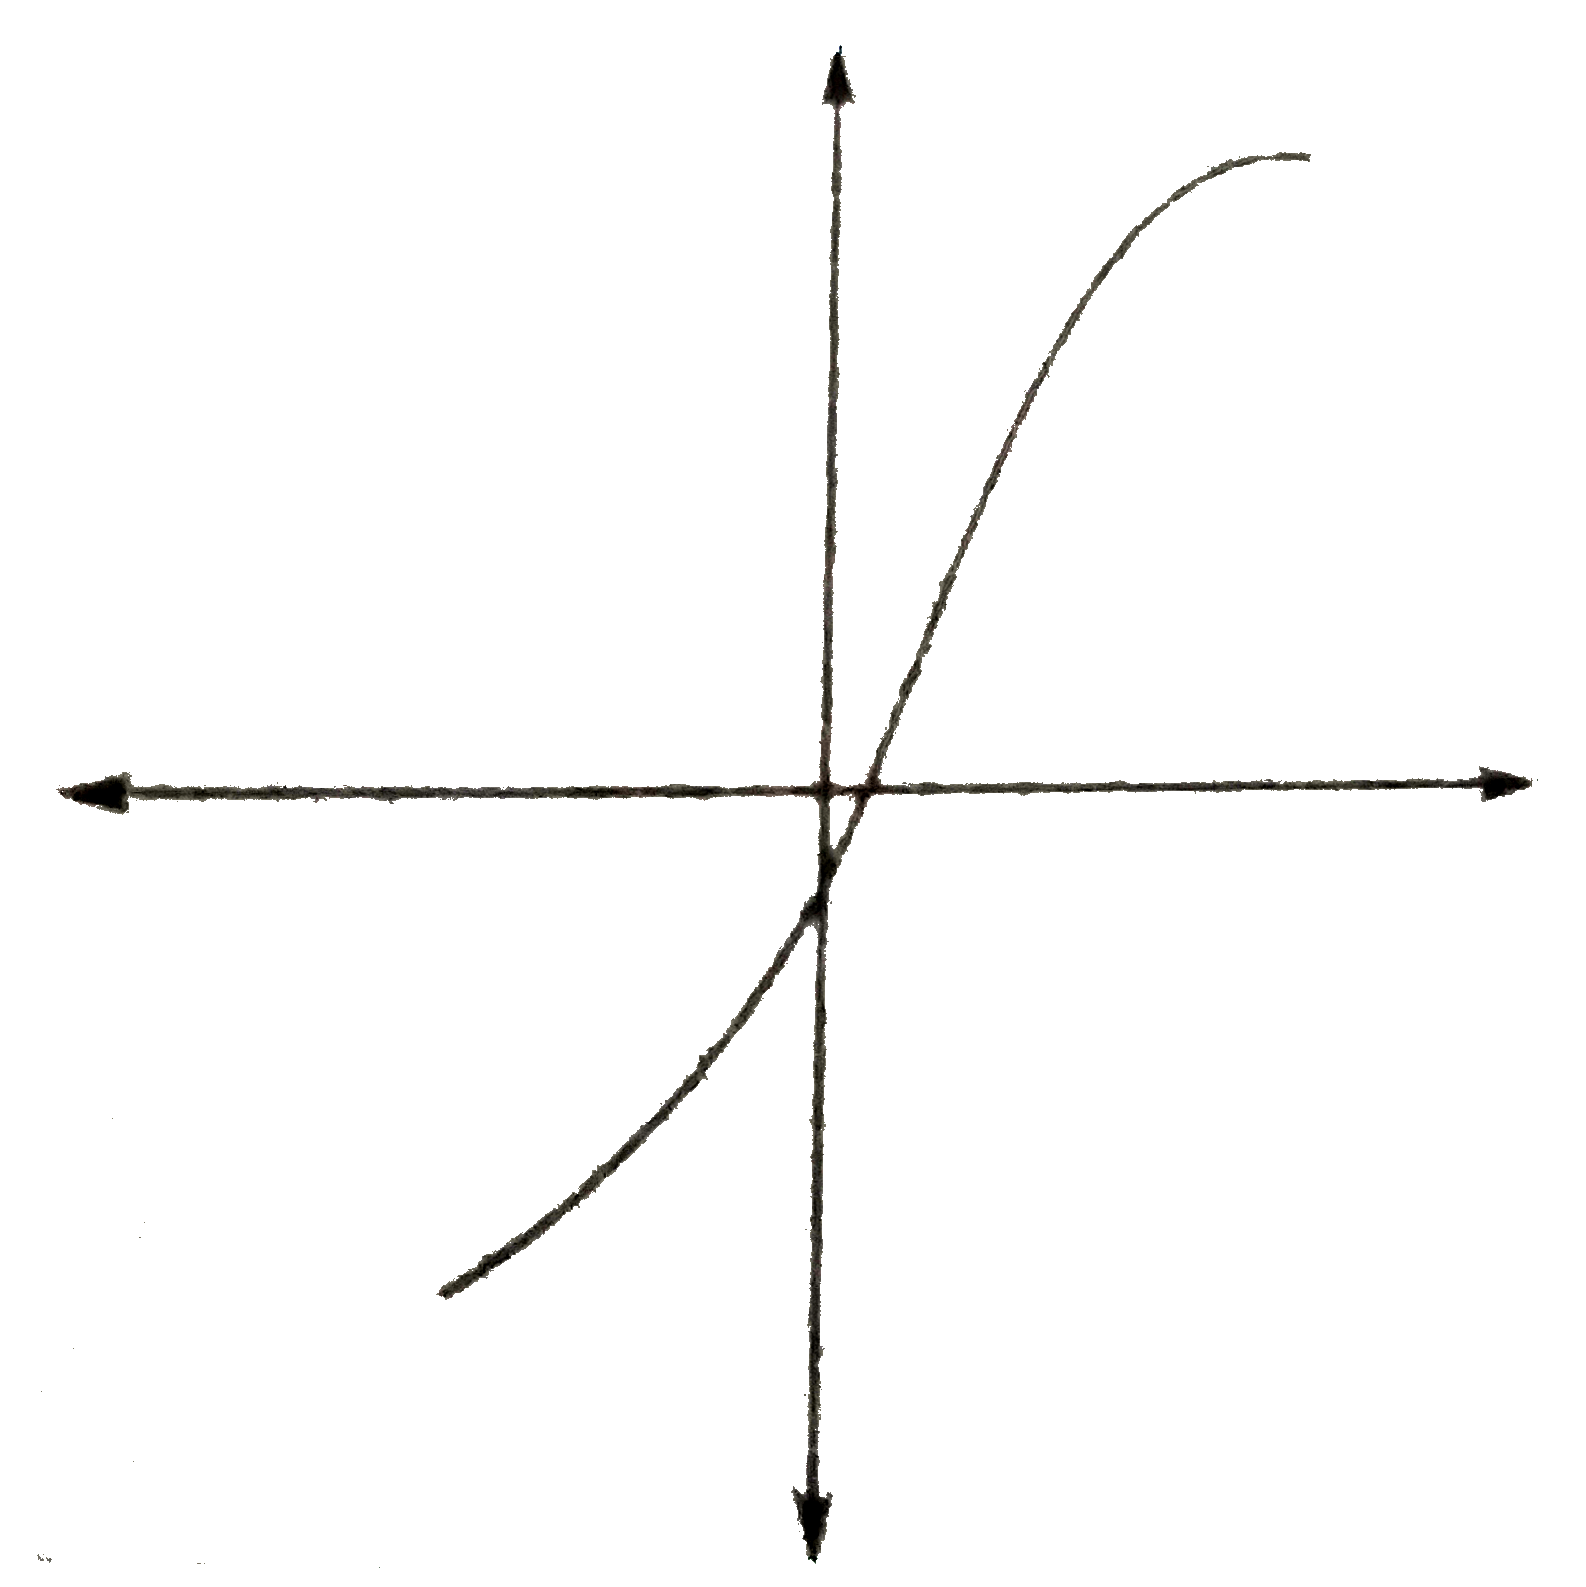 D
D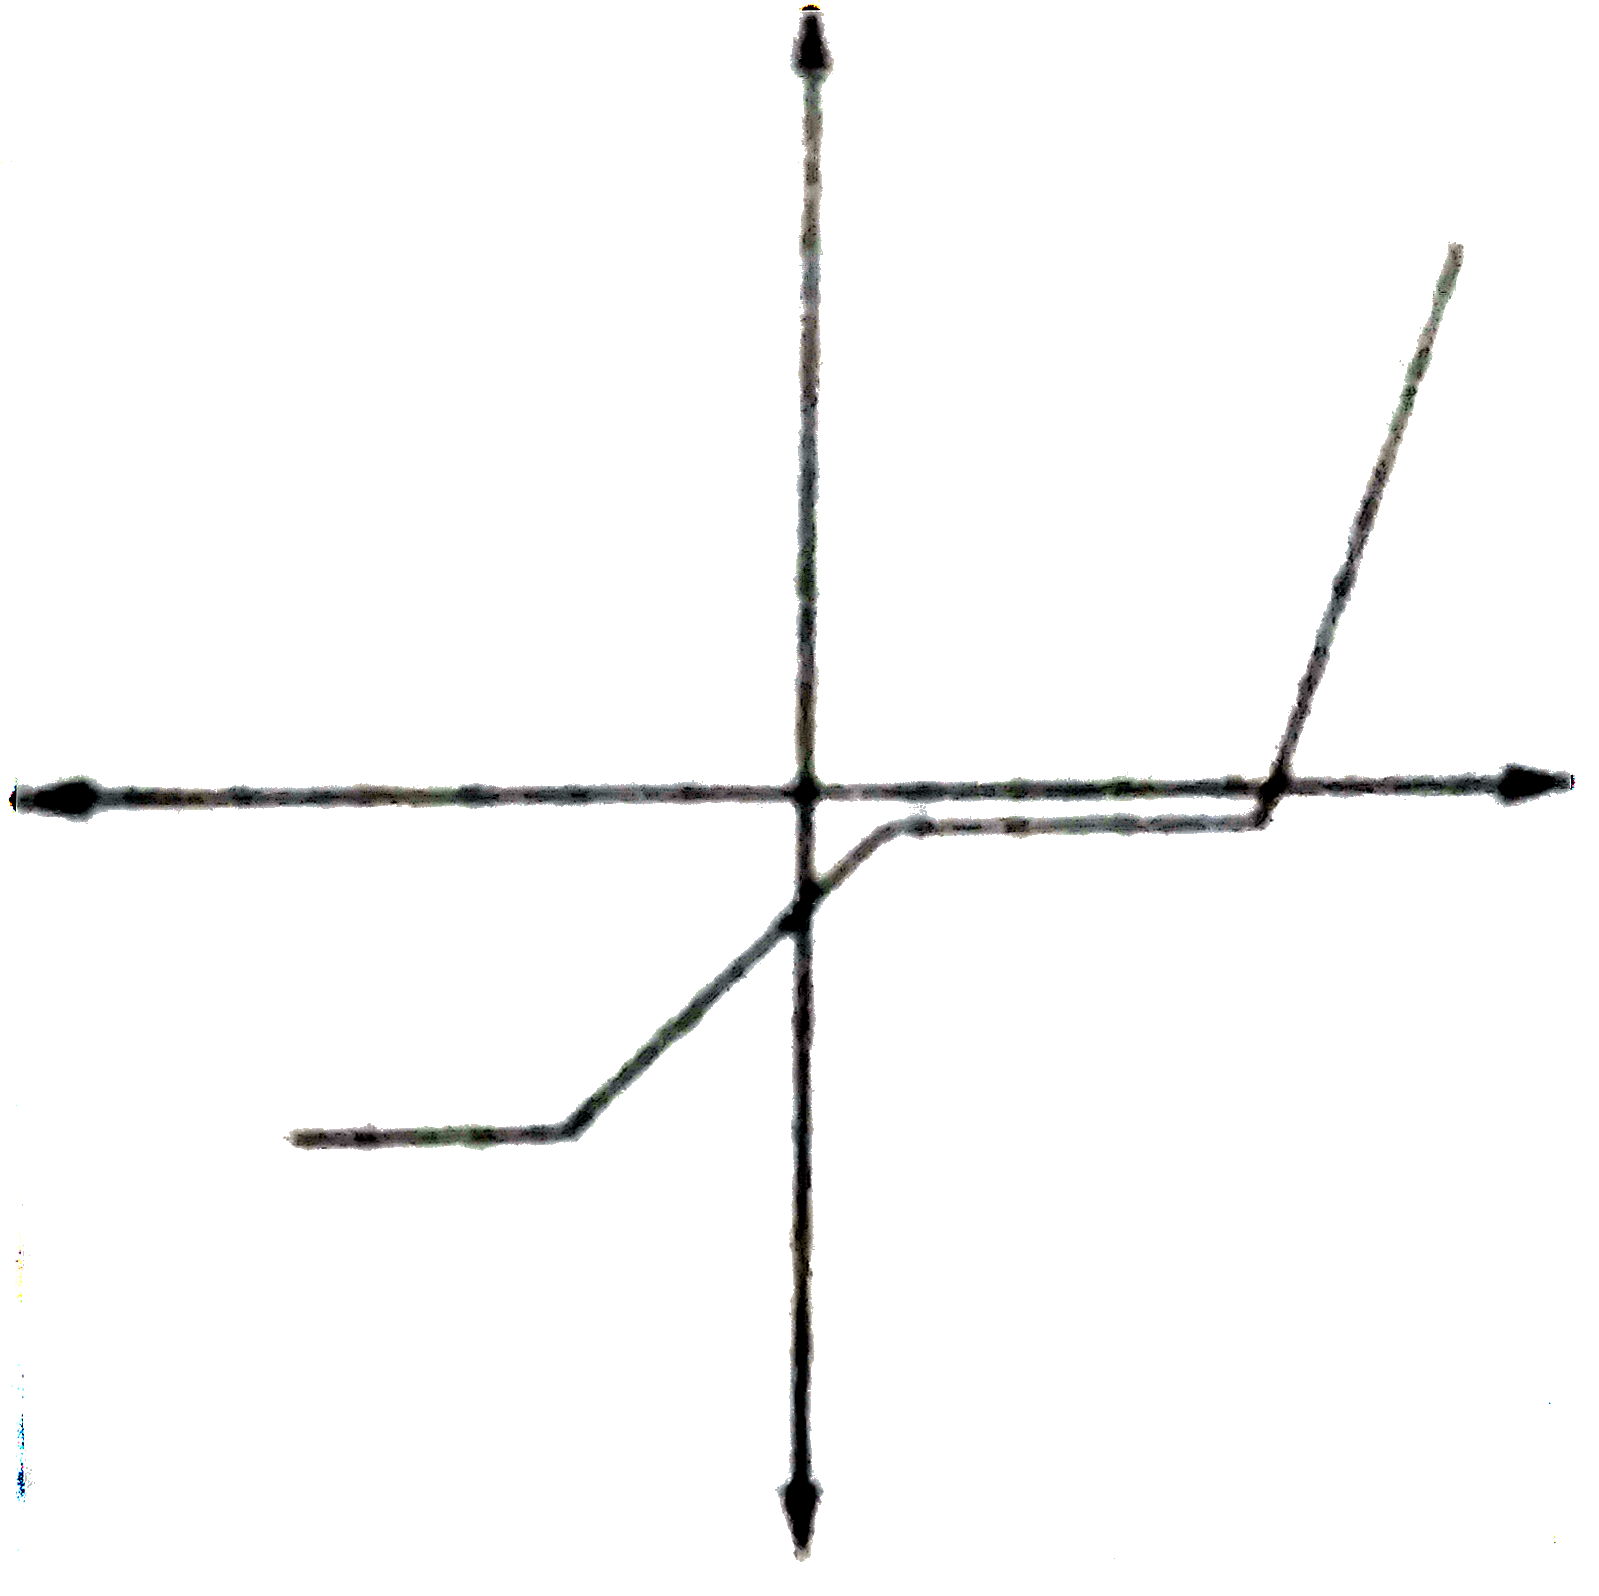
Which of the following inequalities represents the graph shown below on the real number line ?
 A0<x<5B0<x≤4C−2<x≤4D1≤x≤4
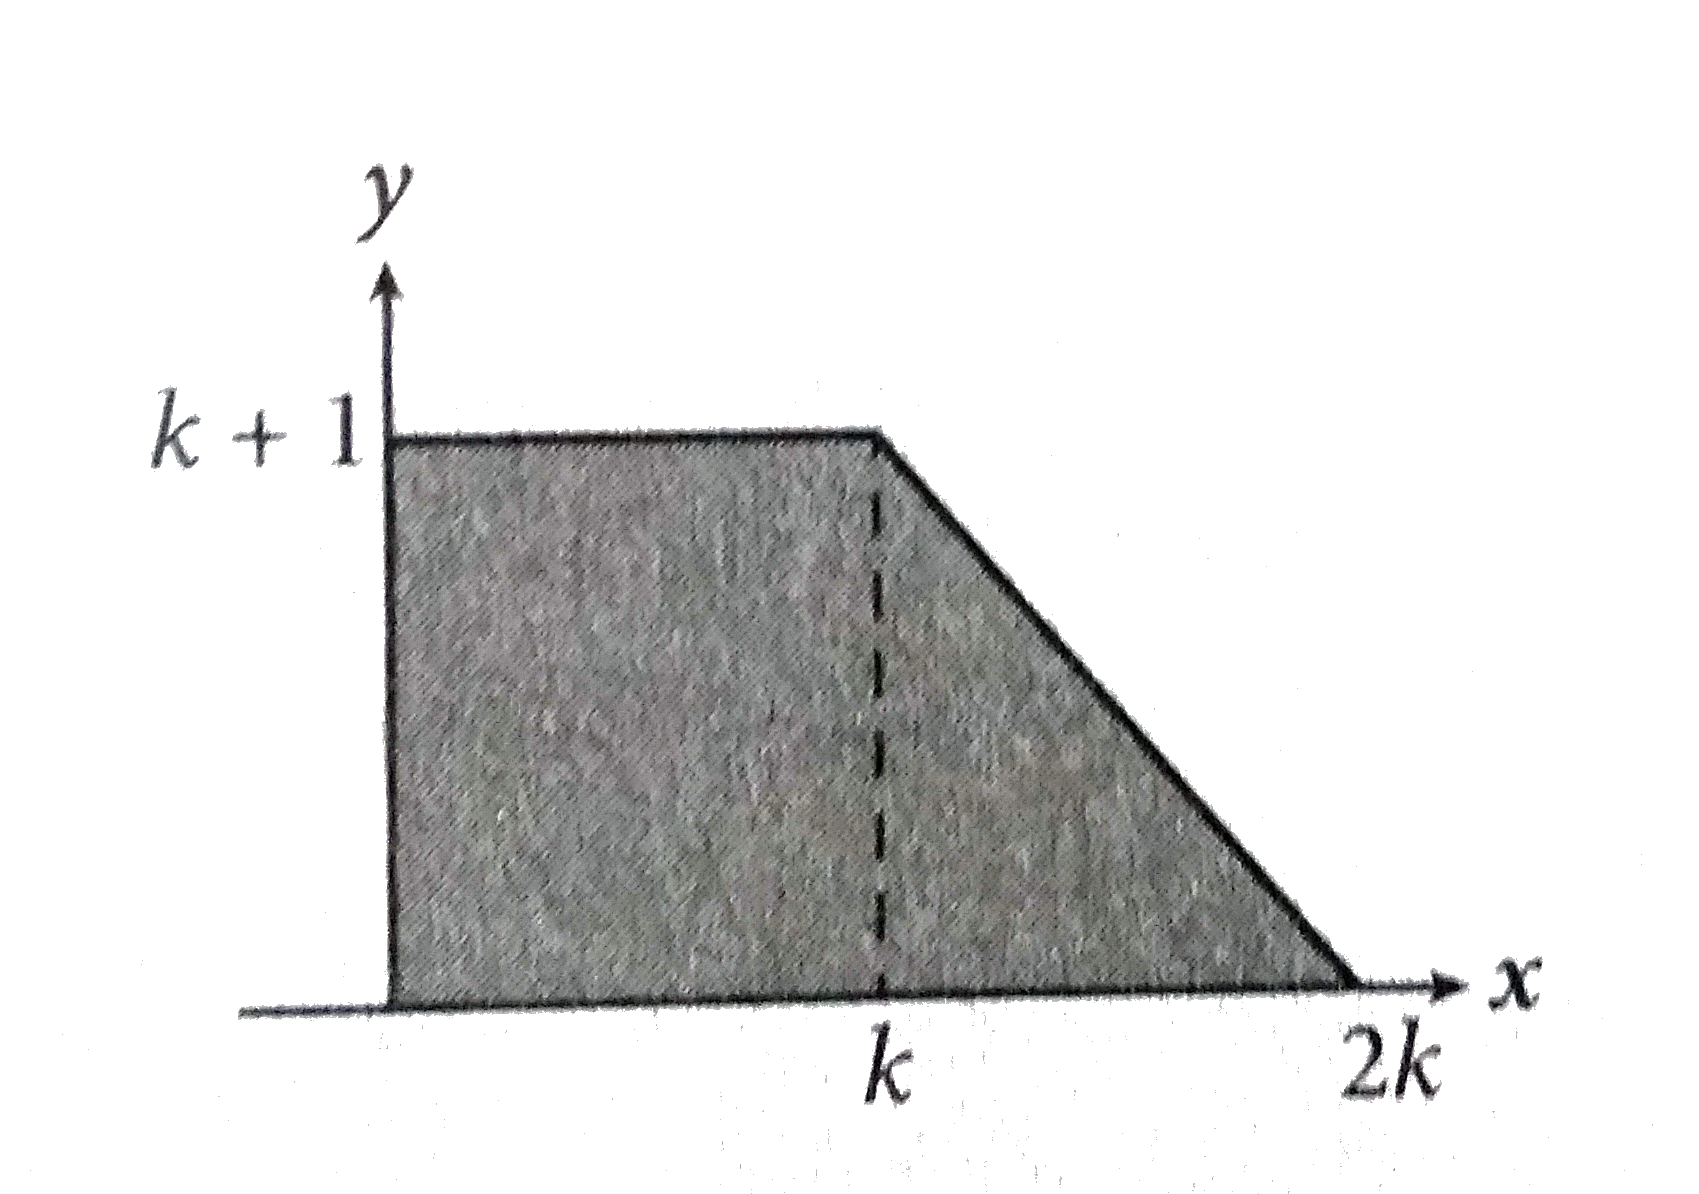
Which of the following polynomial equations could be used to represent the area of the trapezoid shown in the figure?
View Solution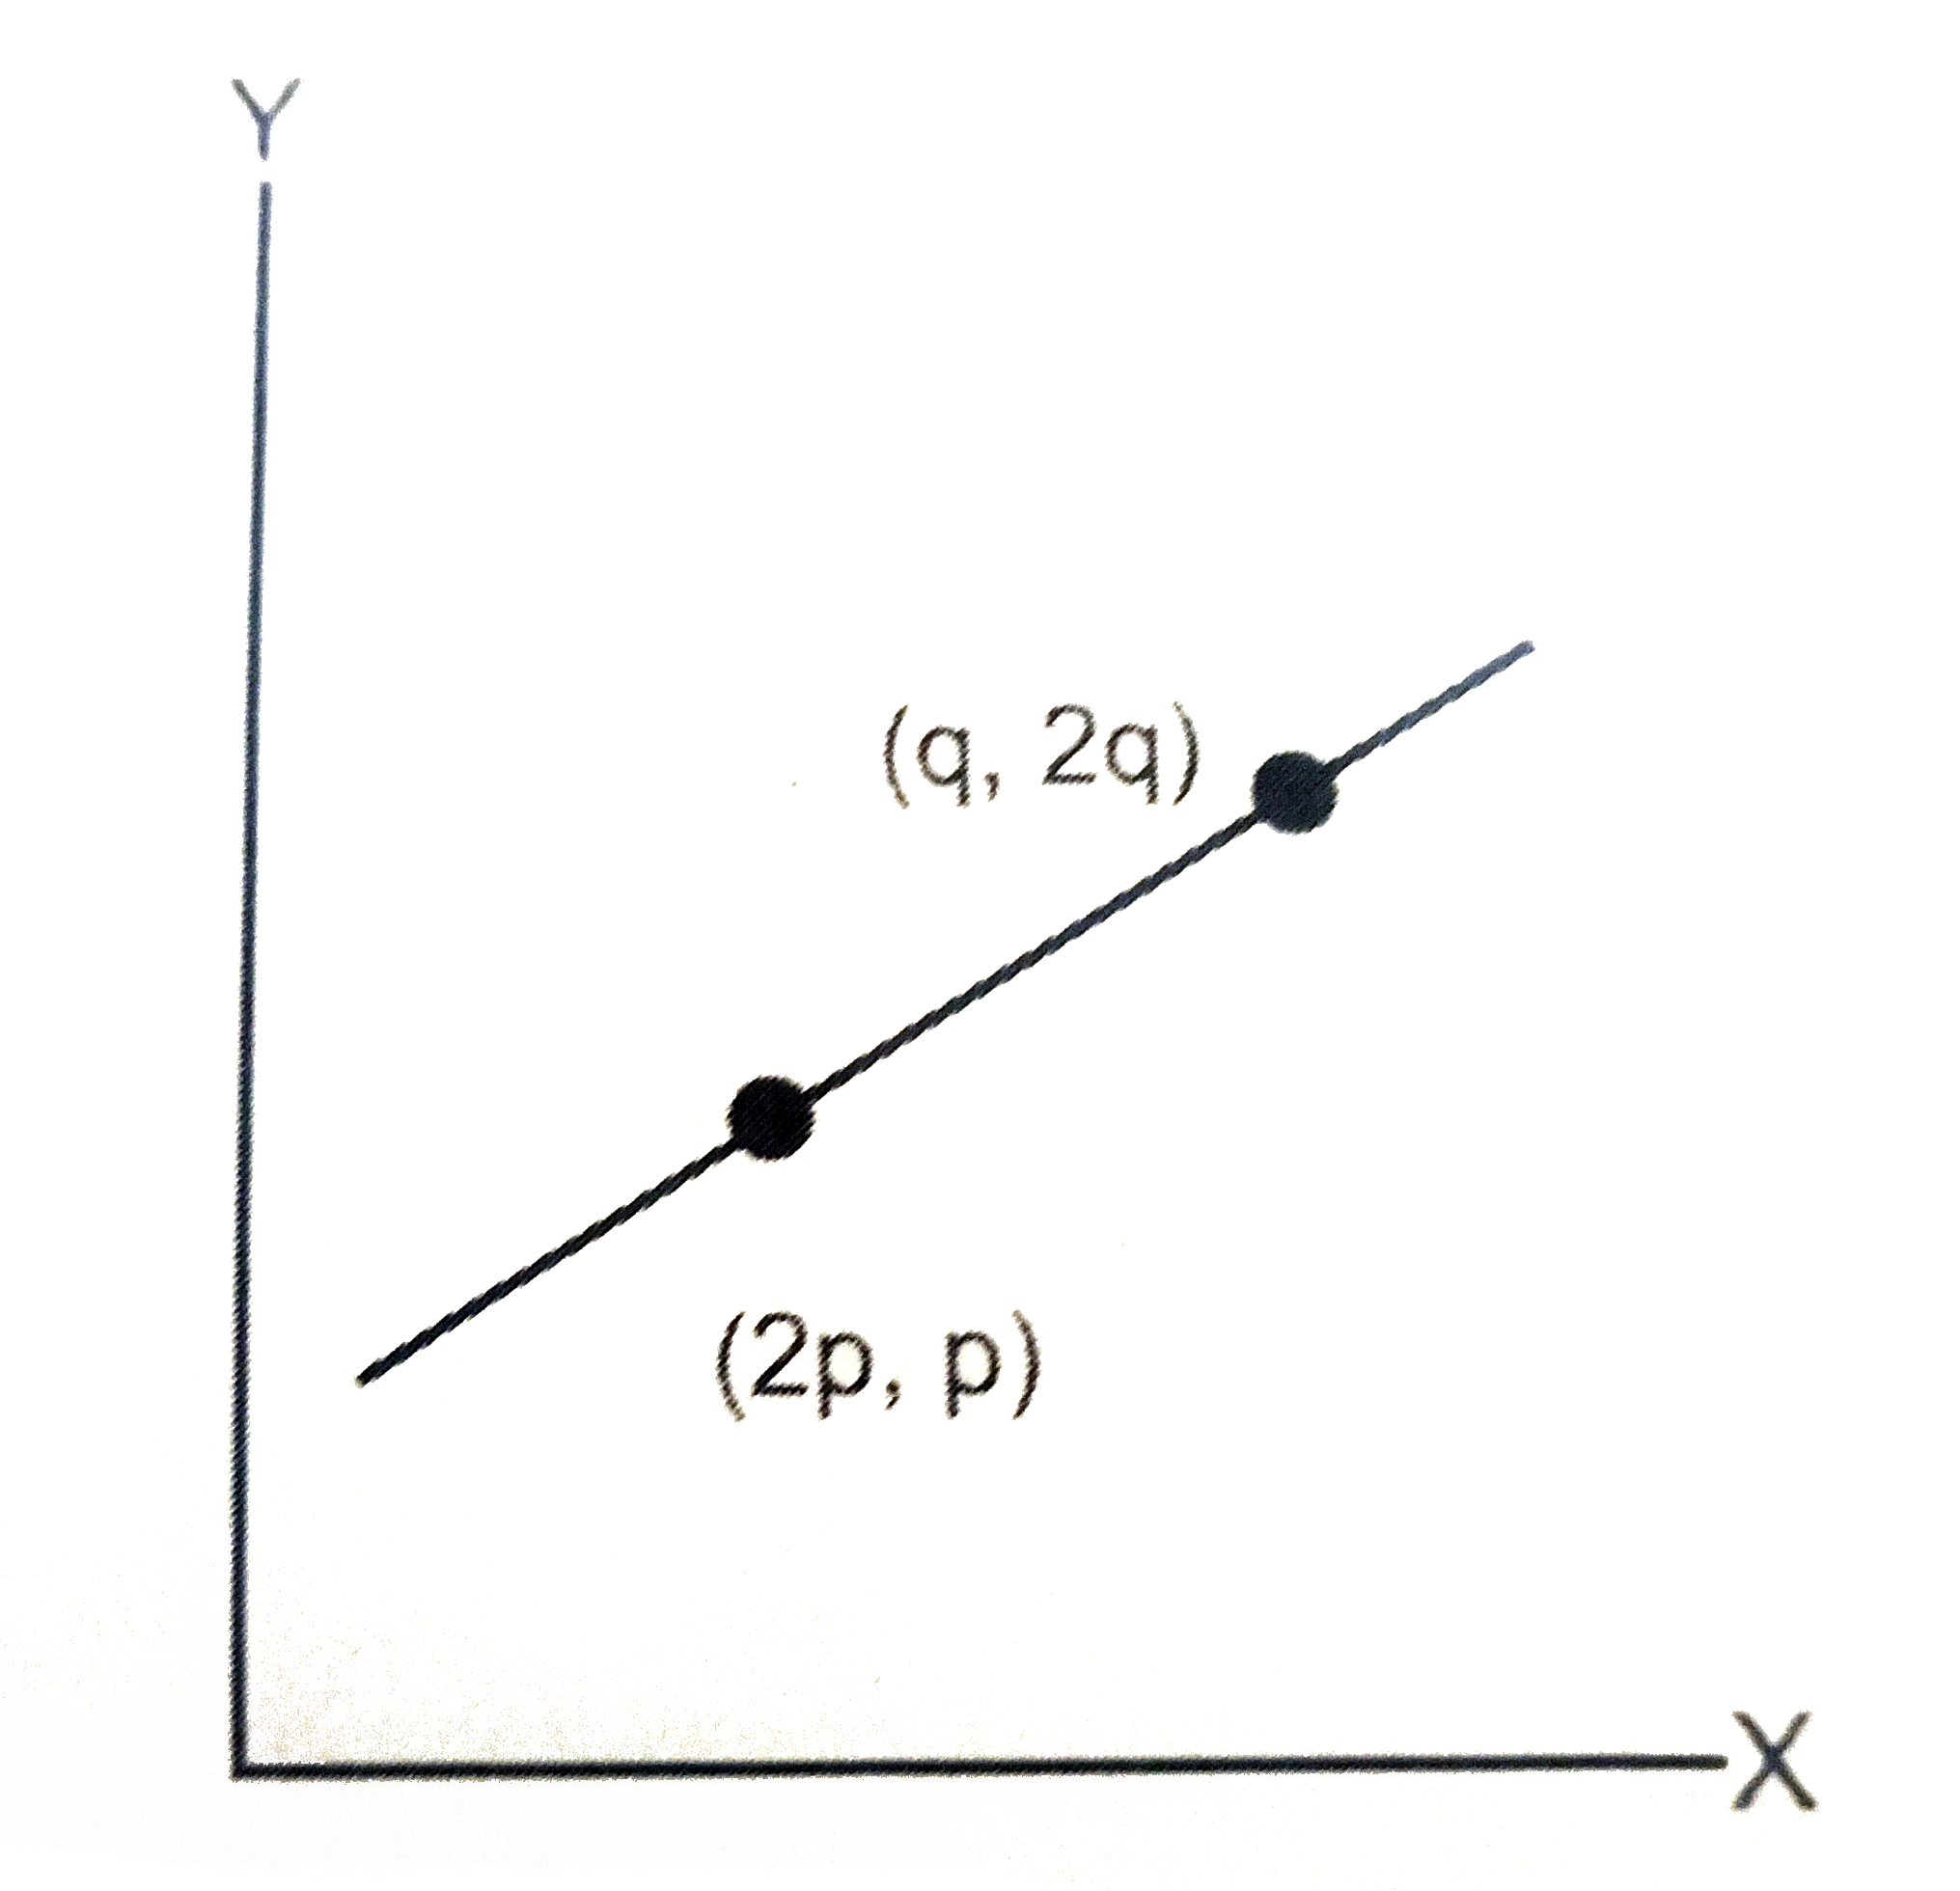
The graph above depicts a straight line. If q>2p , which of the following options could not be the slope of the line shown ?
View Solution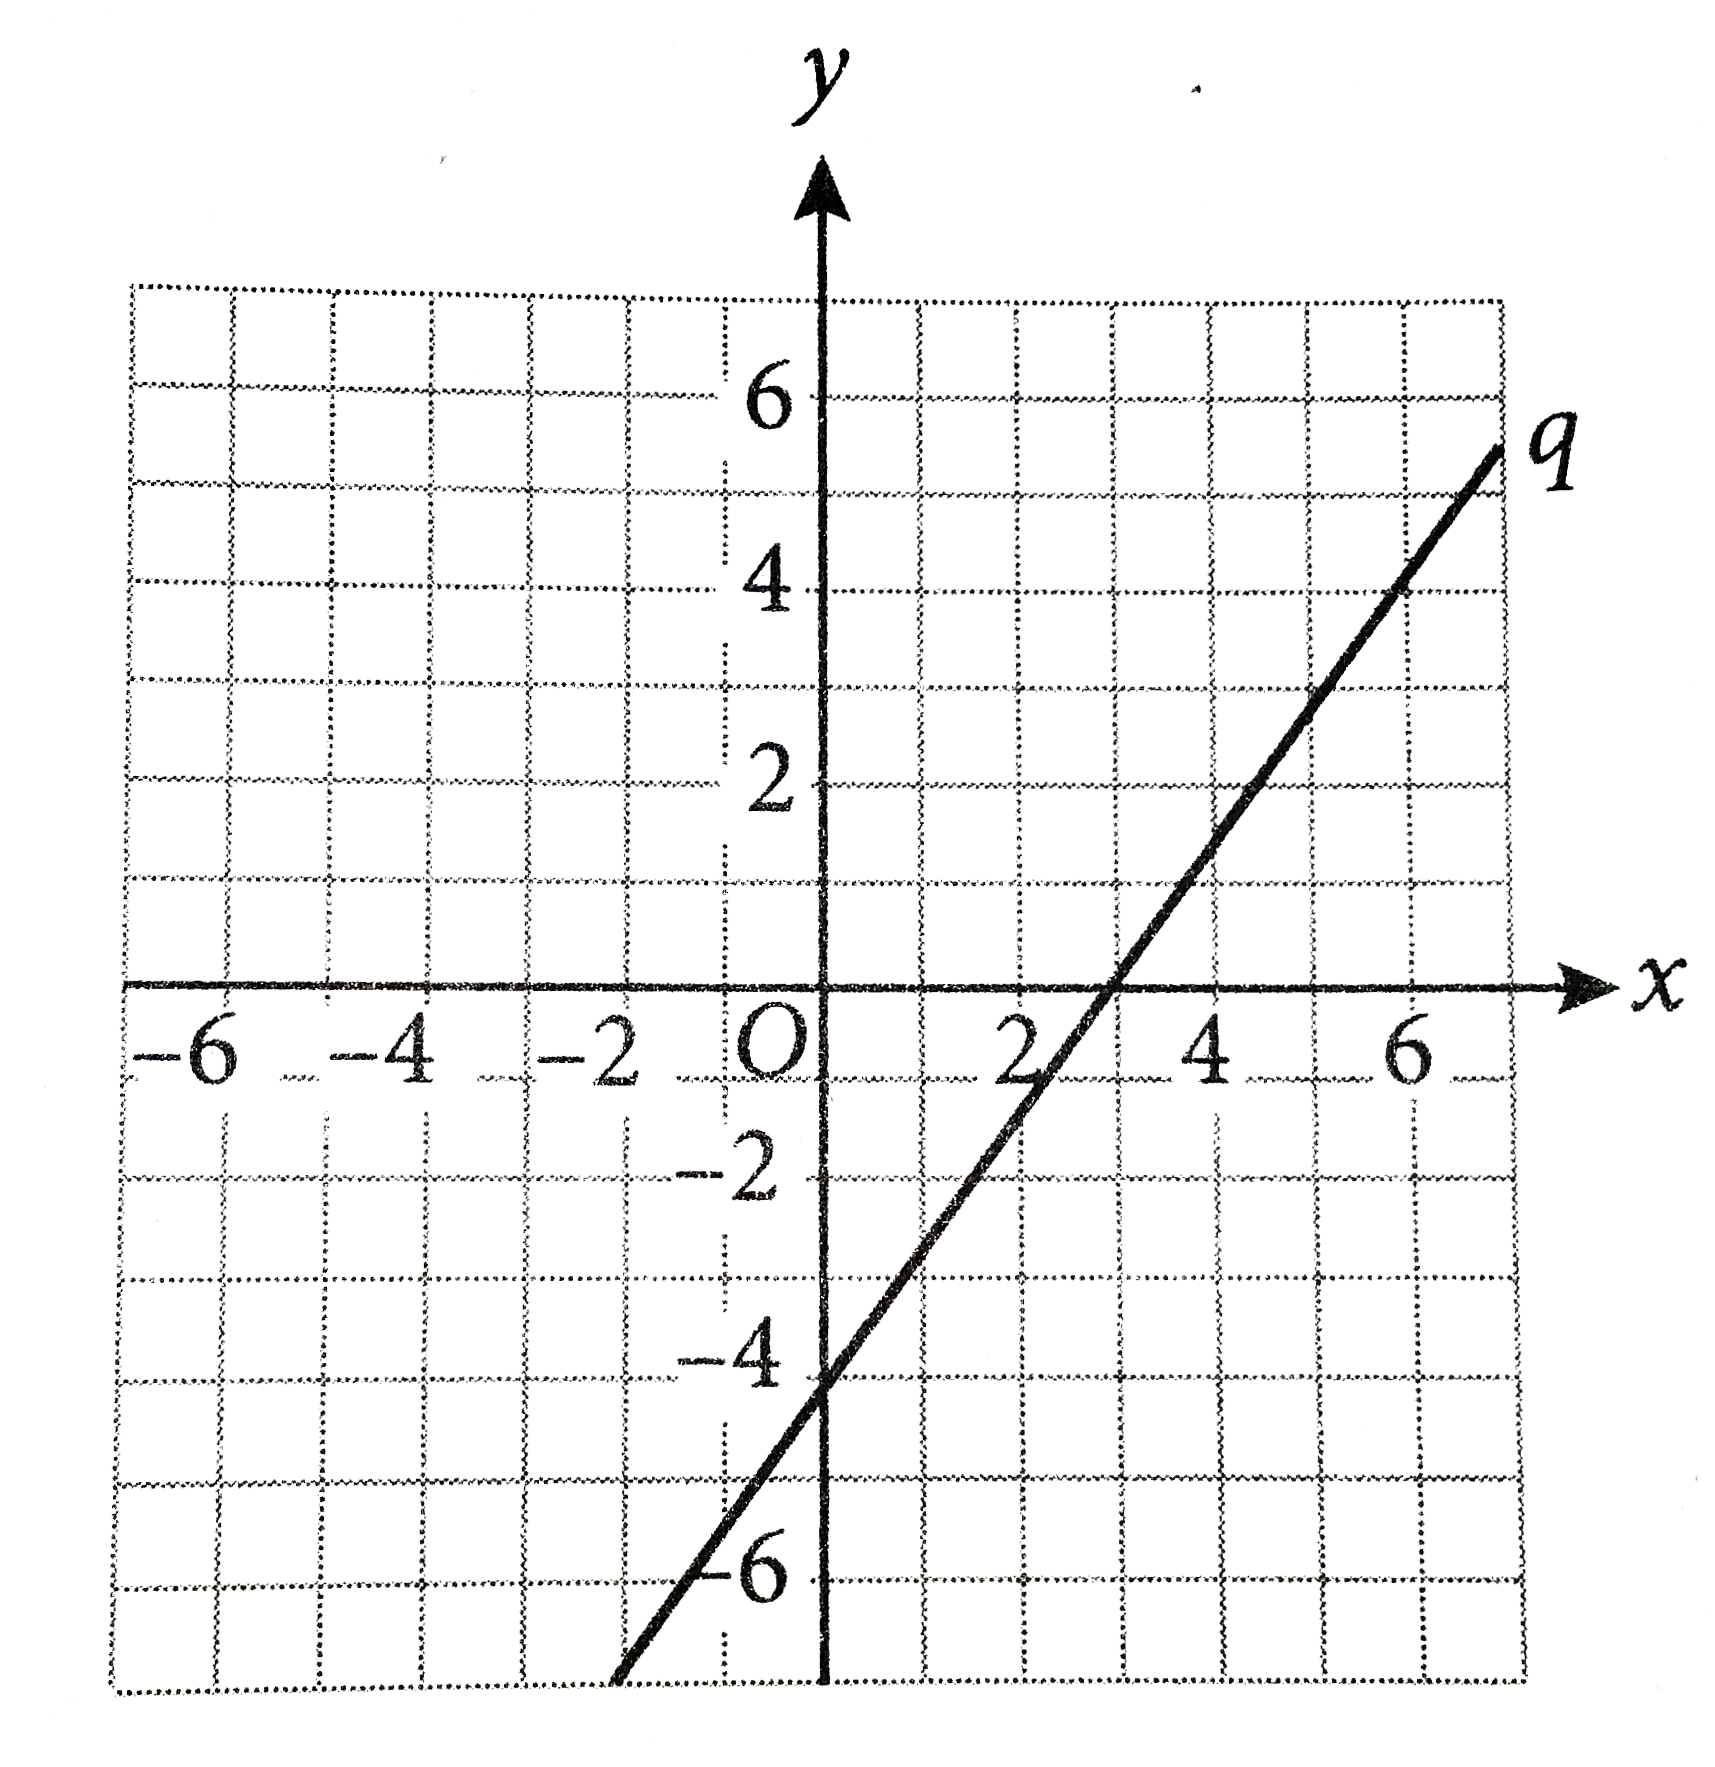
Line p (not shown) is perpendicular to line q shown above and passes through the point (0,4). Which of the following equations could represent line p?
View Solution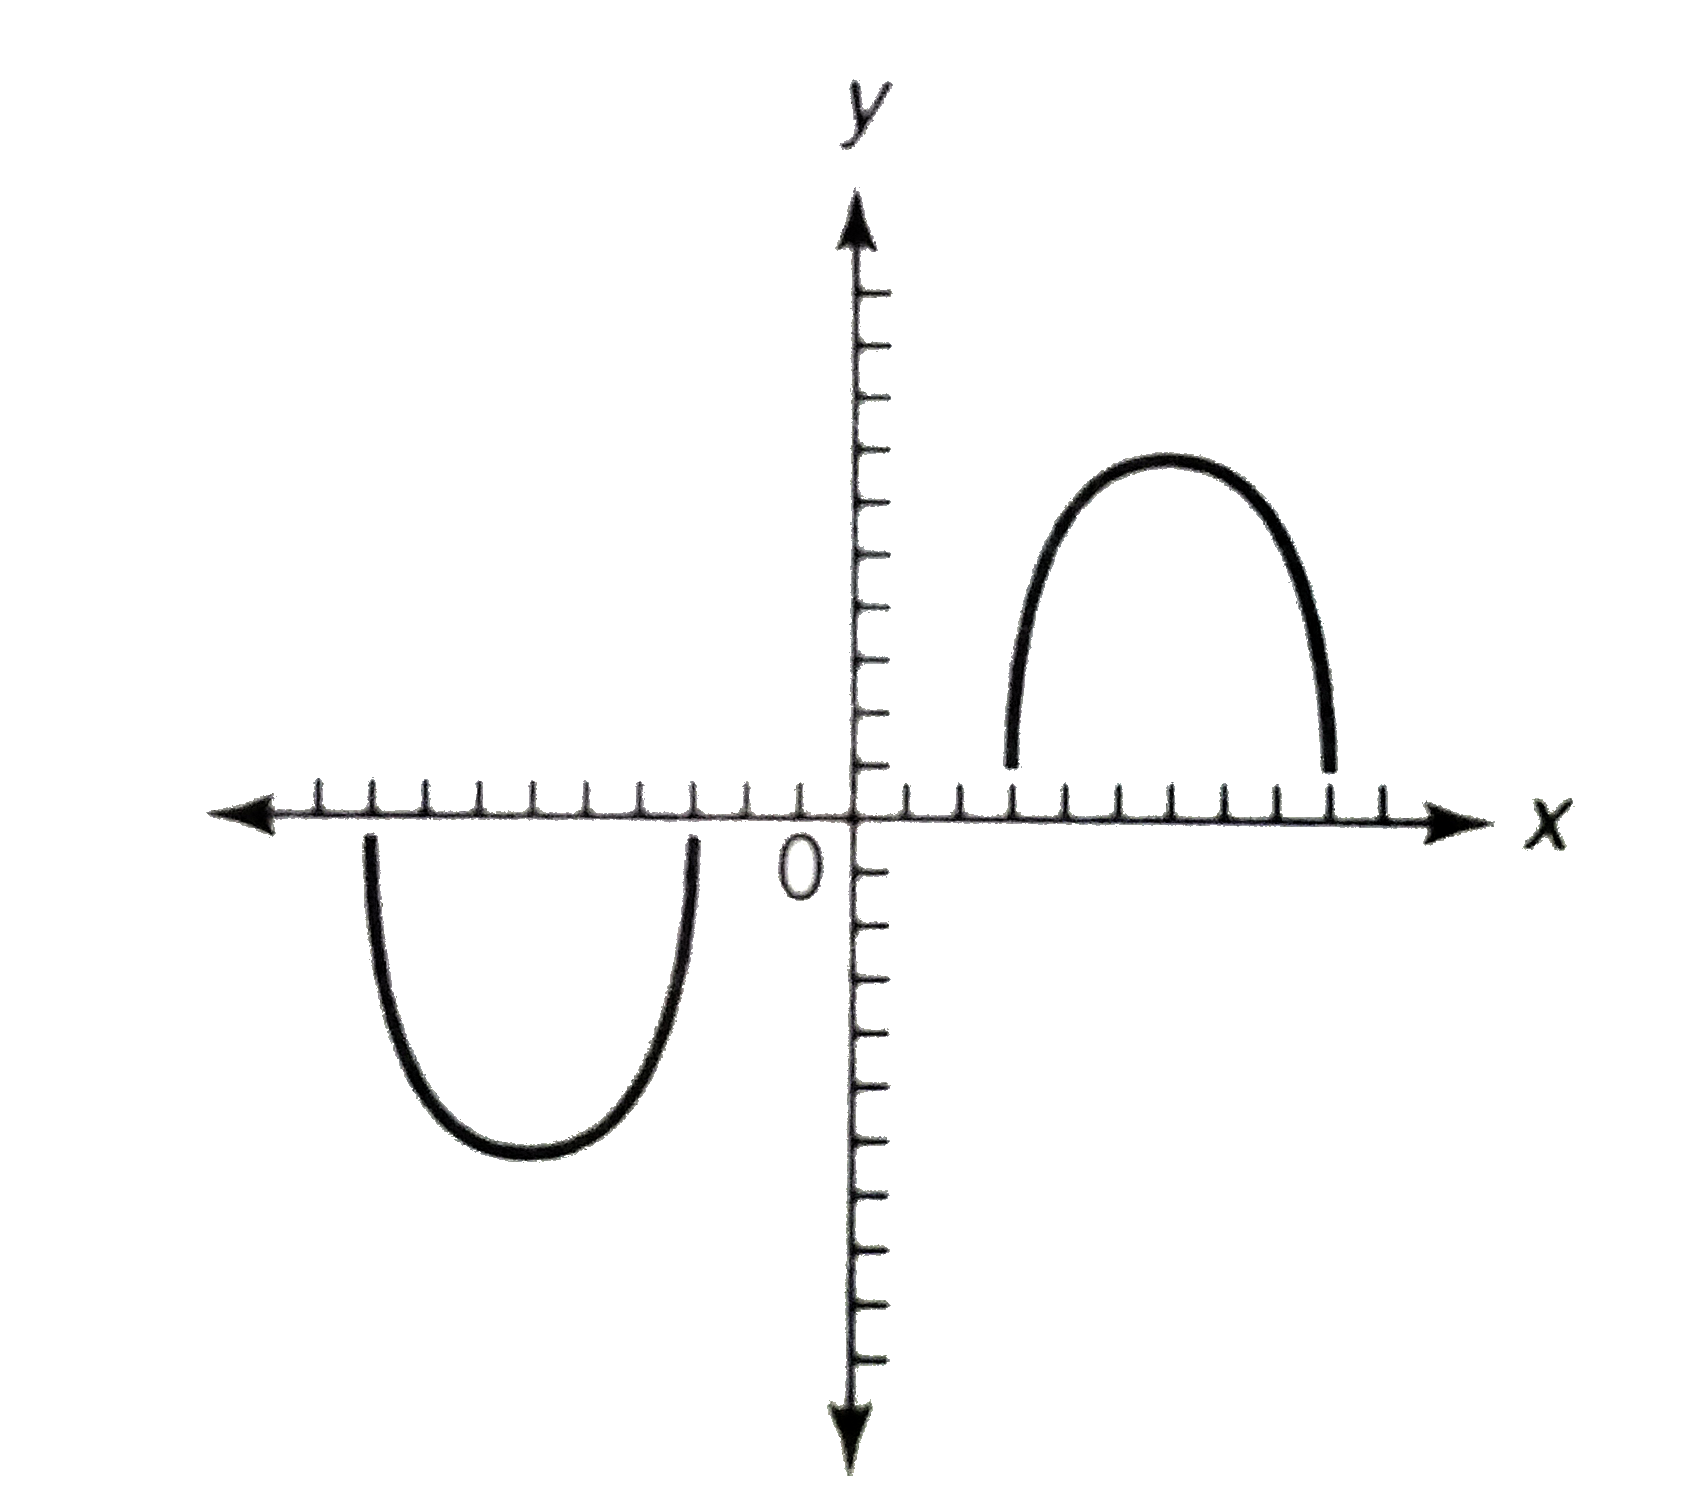
The graph of the function f is shown above. Which of the following could represent the graph of y=|f(x)|?
View SolutionThe graph of y=f(x) is shown below.
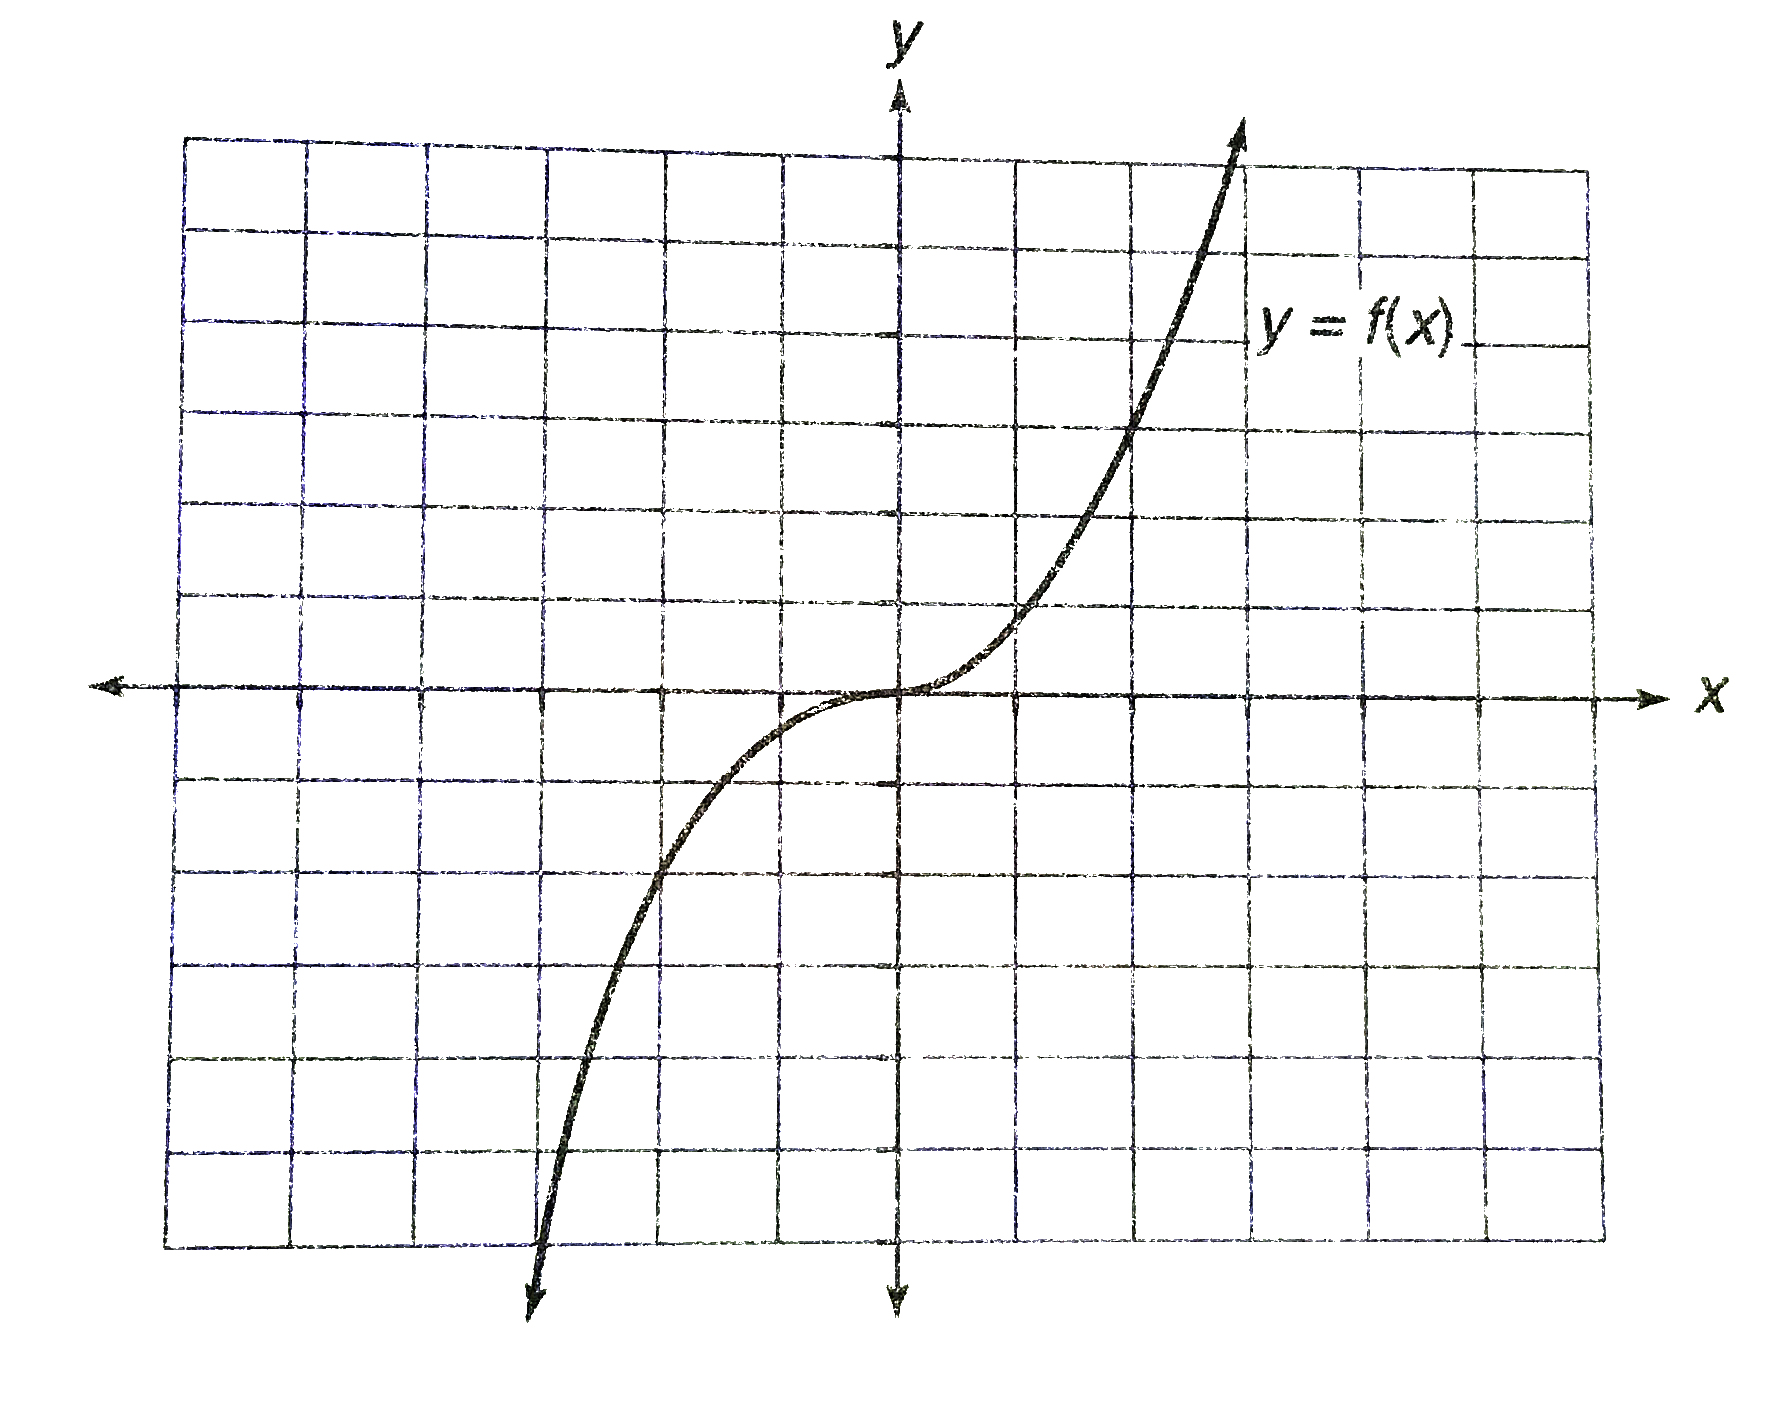
Which of the following could represents the graph of y=f(x−2)+1?
View Solution

