If g(x) respresents a quadratic function, which of the following best describes the relationship between the graphs of g(x)andg(x−3)?
The graph of g(x-3) is 3 units to the left of the graph of g(x).
The graph of g(x-3) is 3 units to the right of the graph of g(x).
The graph of g(x-3) is 3 units lower than the graph of g(x).
The graph of g(x-3) is 3 units higher than the graph of g(x).
The correct Answer is:B
To solve the problem, we need to understand how the transformation of the function g(x) to g(x−3) affects its graph.
1. Identify the Function:
Let's consider a simple quadratic function for g(x). A common example is:
g(x)=x2
2. Transform the Function:
We need to find g(x−3). Substituting x−3 into the function gives:
g(x−3)=(x−3)2
3. Expand the Transformed Function:
Expanding g(x−3):
g(x−3)=(x−3)(x−3)=x2−6x+9
4. Graphing the Functions:
- The graph of g(x)=x2 is a parabola that opens upwards with its vertex at the origin (0,0).
- The graph of g(x−3)=(x−3)2 is also a parabola that opens upwards, but its vertex is now at the point (3,0).
5. Determine the Relationship:
The graph of g(x−3) is a horizontal shift of the graph of g(x) to the right by 3 units.
Conclusion:
Thus, the relationship between the graphs of g(x) and g(x−3) is that the graph of g(x) is shifted 3 units to the right to obtain the graph of g(x−3).
Final Answer:
The graph of g(x) is 3 units to the right of the graph of g(x−3).
---
Let's consider a simple quadratic function for g(x). A common example is:
g(x)=x2
We need to find g(x−3). Substituting x−3 into the function gives:
g(x−3)=(x−3)2
Expanding g(x−3):
g(x−3)=(x−3)(x−3)=x2−6x+9
- The graph of g(x)=x2 is a parabola that opens upwards with its vertex at the origin (0,0).
- The graph of g(x−3)=(x−3)2 is also a parabola that opens upwards, but its vertex is now at the point (3,0).
The graph of g(x−3) is a horizontal shift of the graph of g(x) to the right by 3 units.
Thus, the relationship between the graphs of g(x) and g(x−3) is that the graph of g(x) is shifted 3 units to the right to obtain the graph of g(x−3).
The graph of g(x) is 3 units to the right of the graph of g(x−3).
Topper's Solved these Questions
Similar Questions
Knowledge Check
Which of the following graphs is the graph of function g(x)|x−1|−1?
A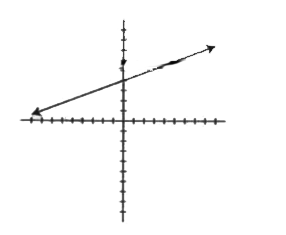 B
B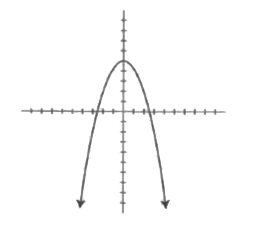 C
C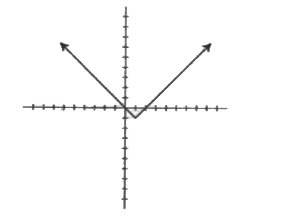 D
D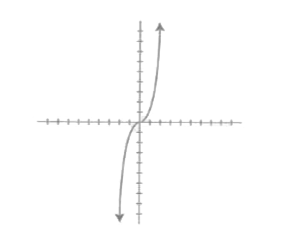
The zeros of the polynomial function g are 4 and -2. If the range of g is the set real numbers greater than or equal to -3, which of the following could be the graph of y=g(x) in the xy-plane?
A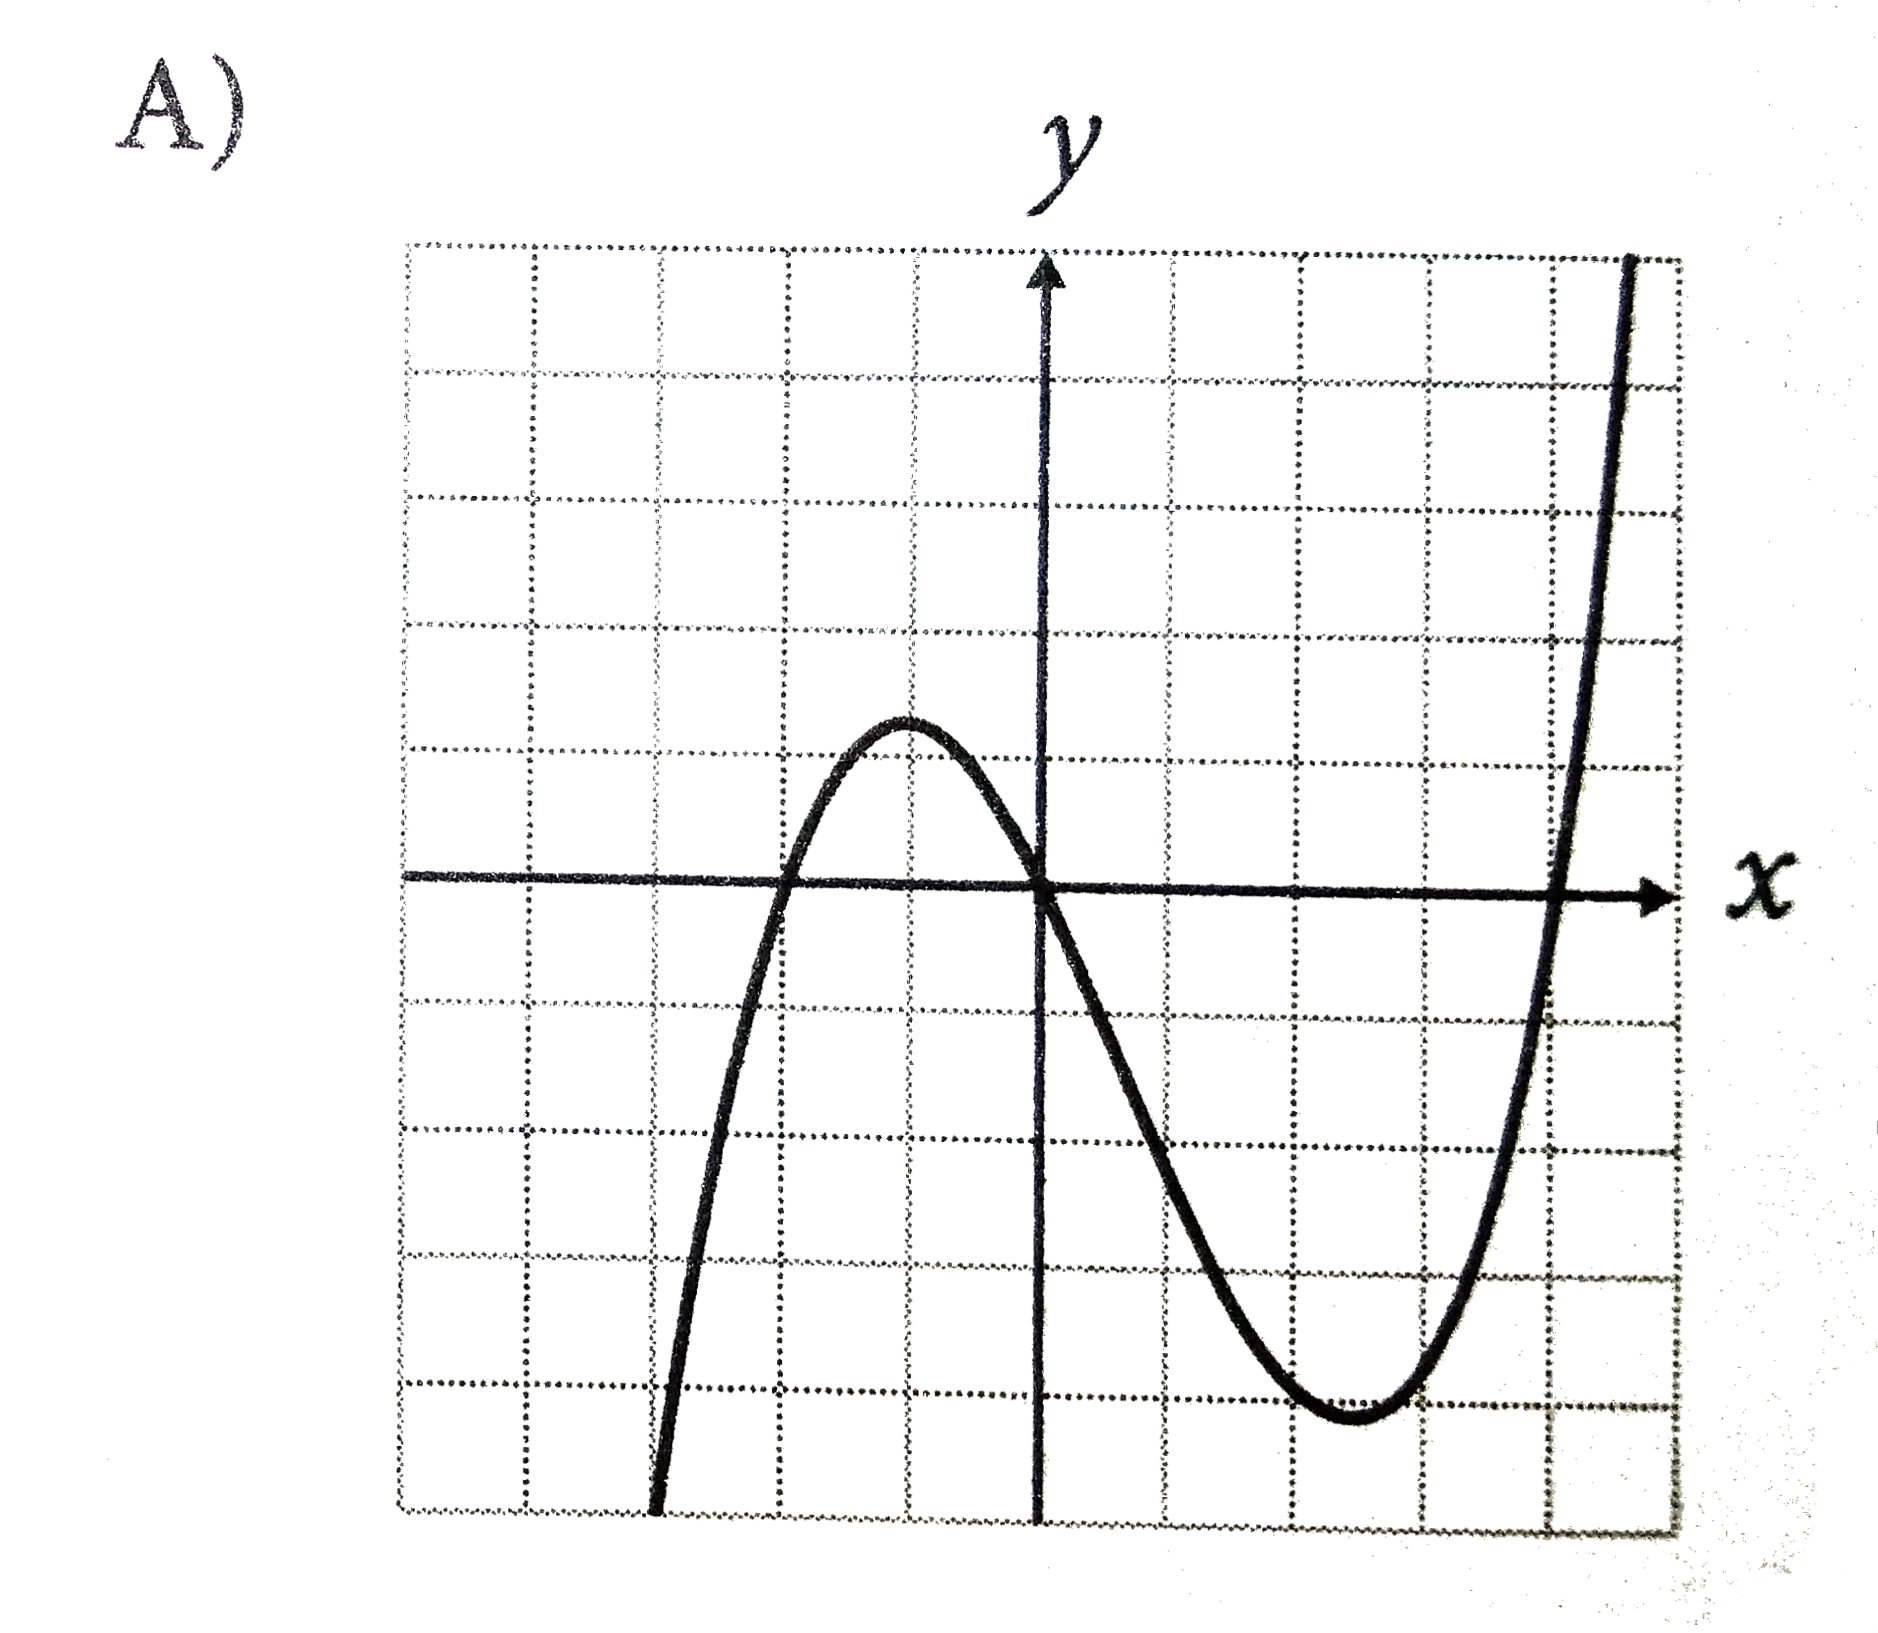 B
B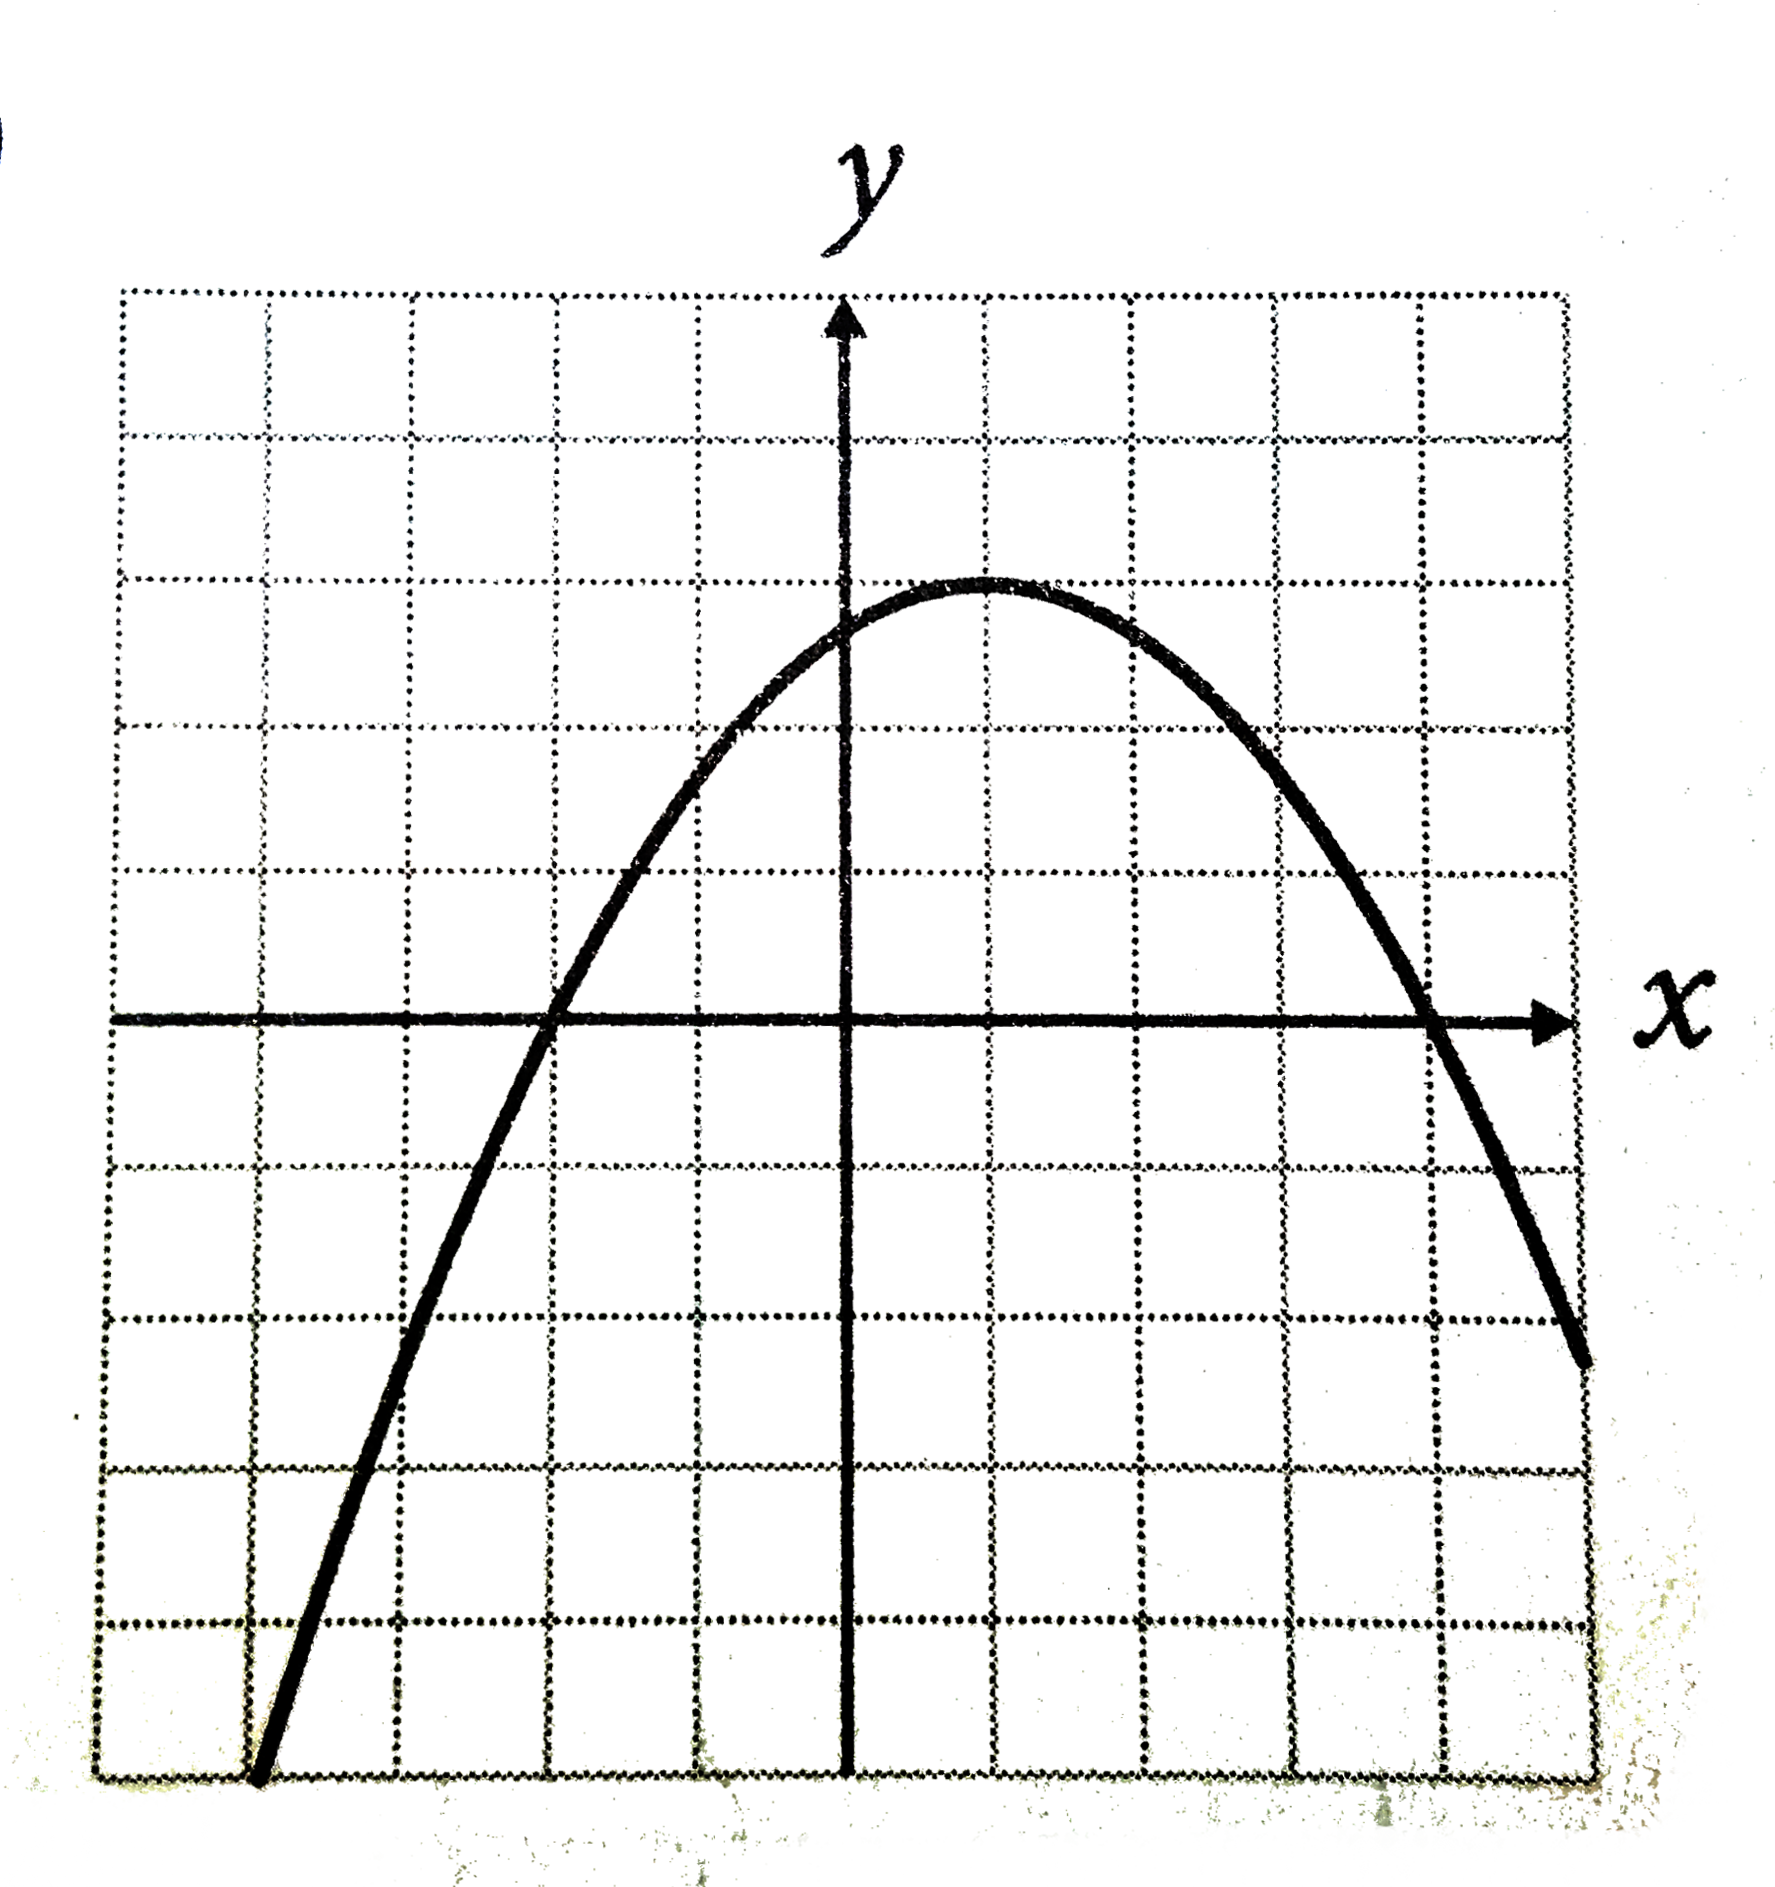 C
C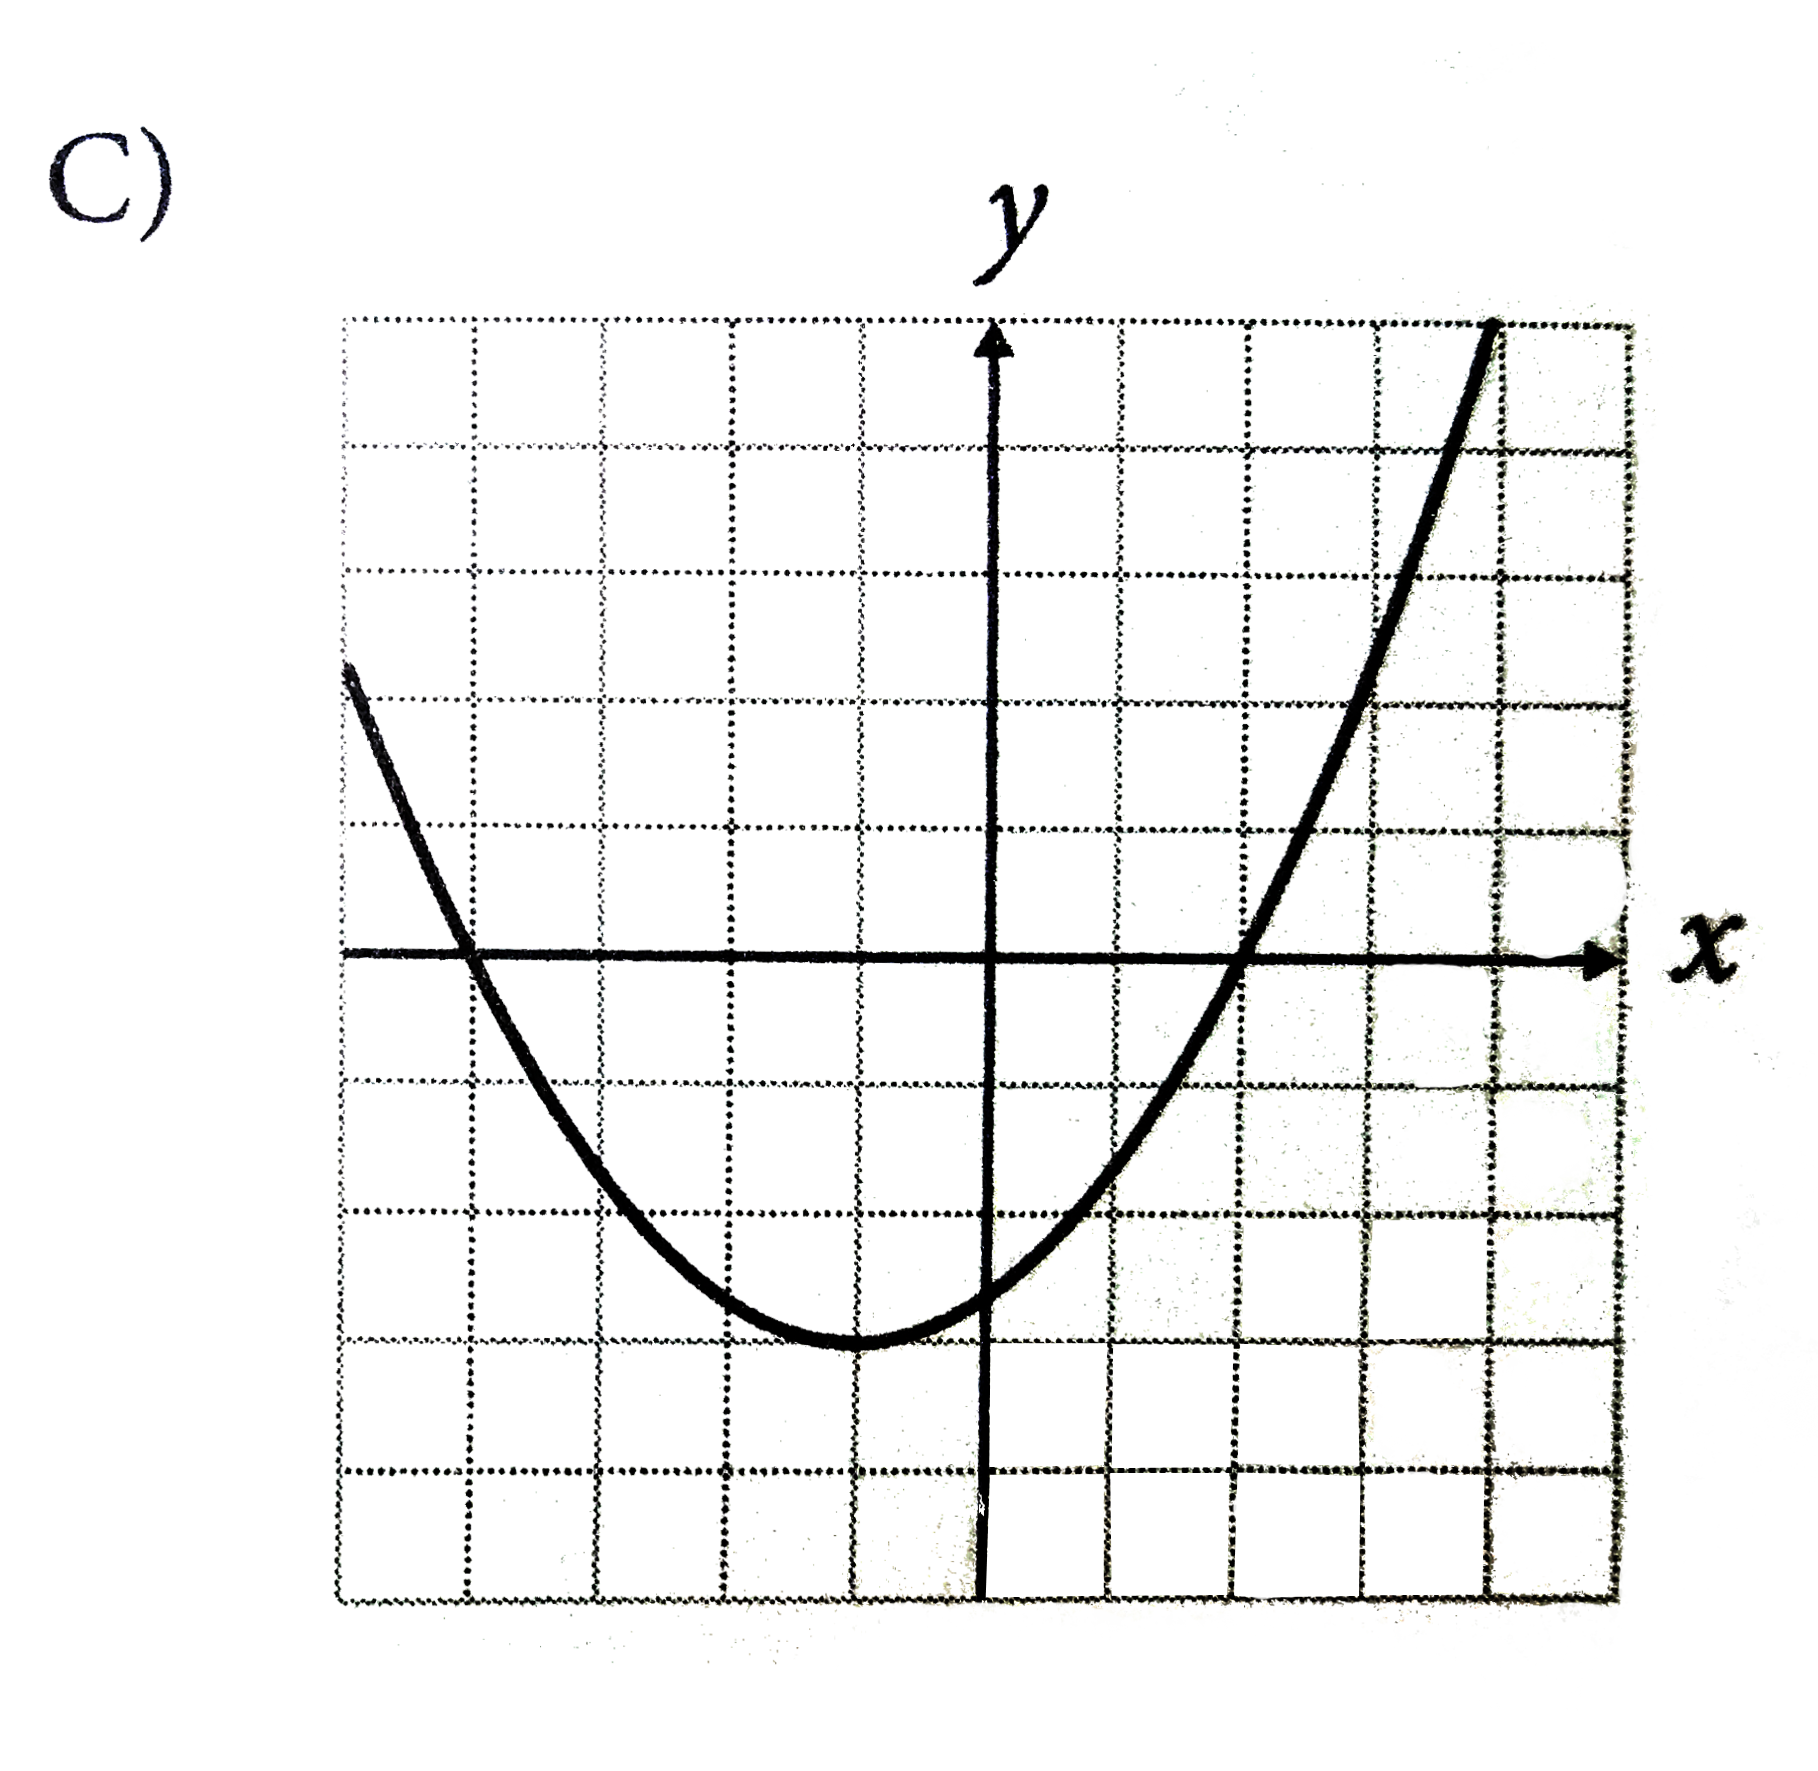 D
D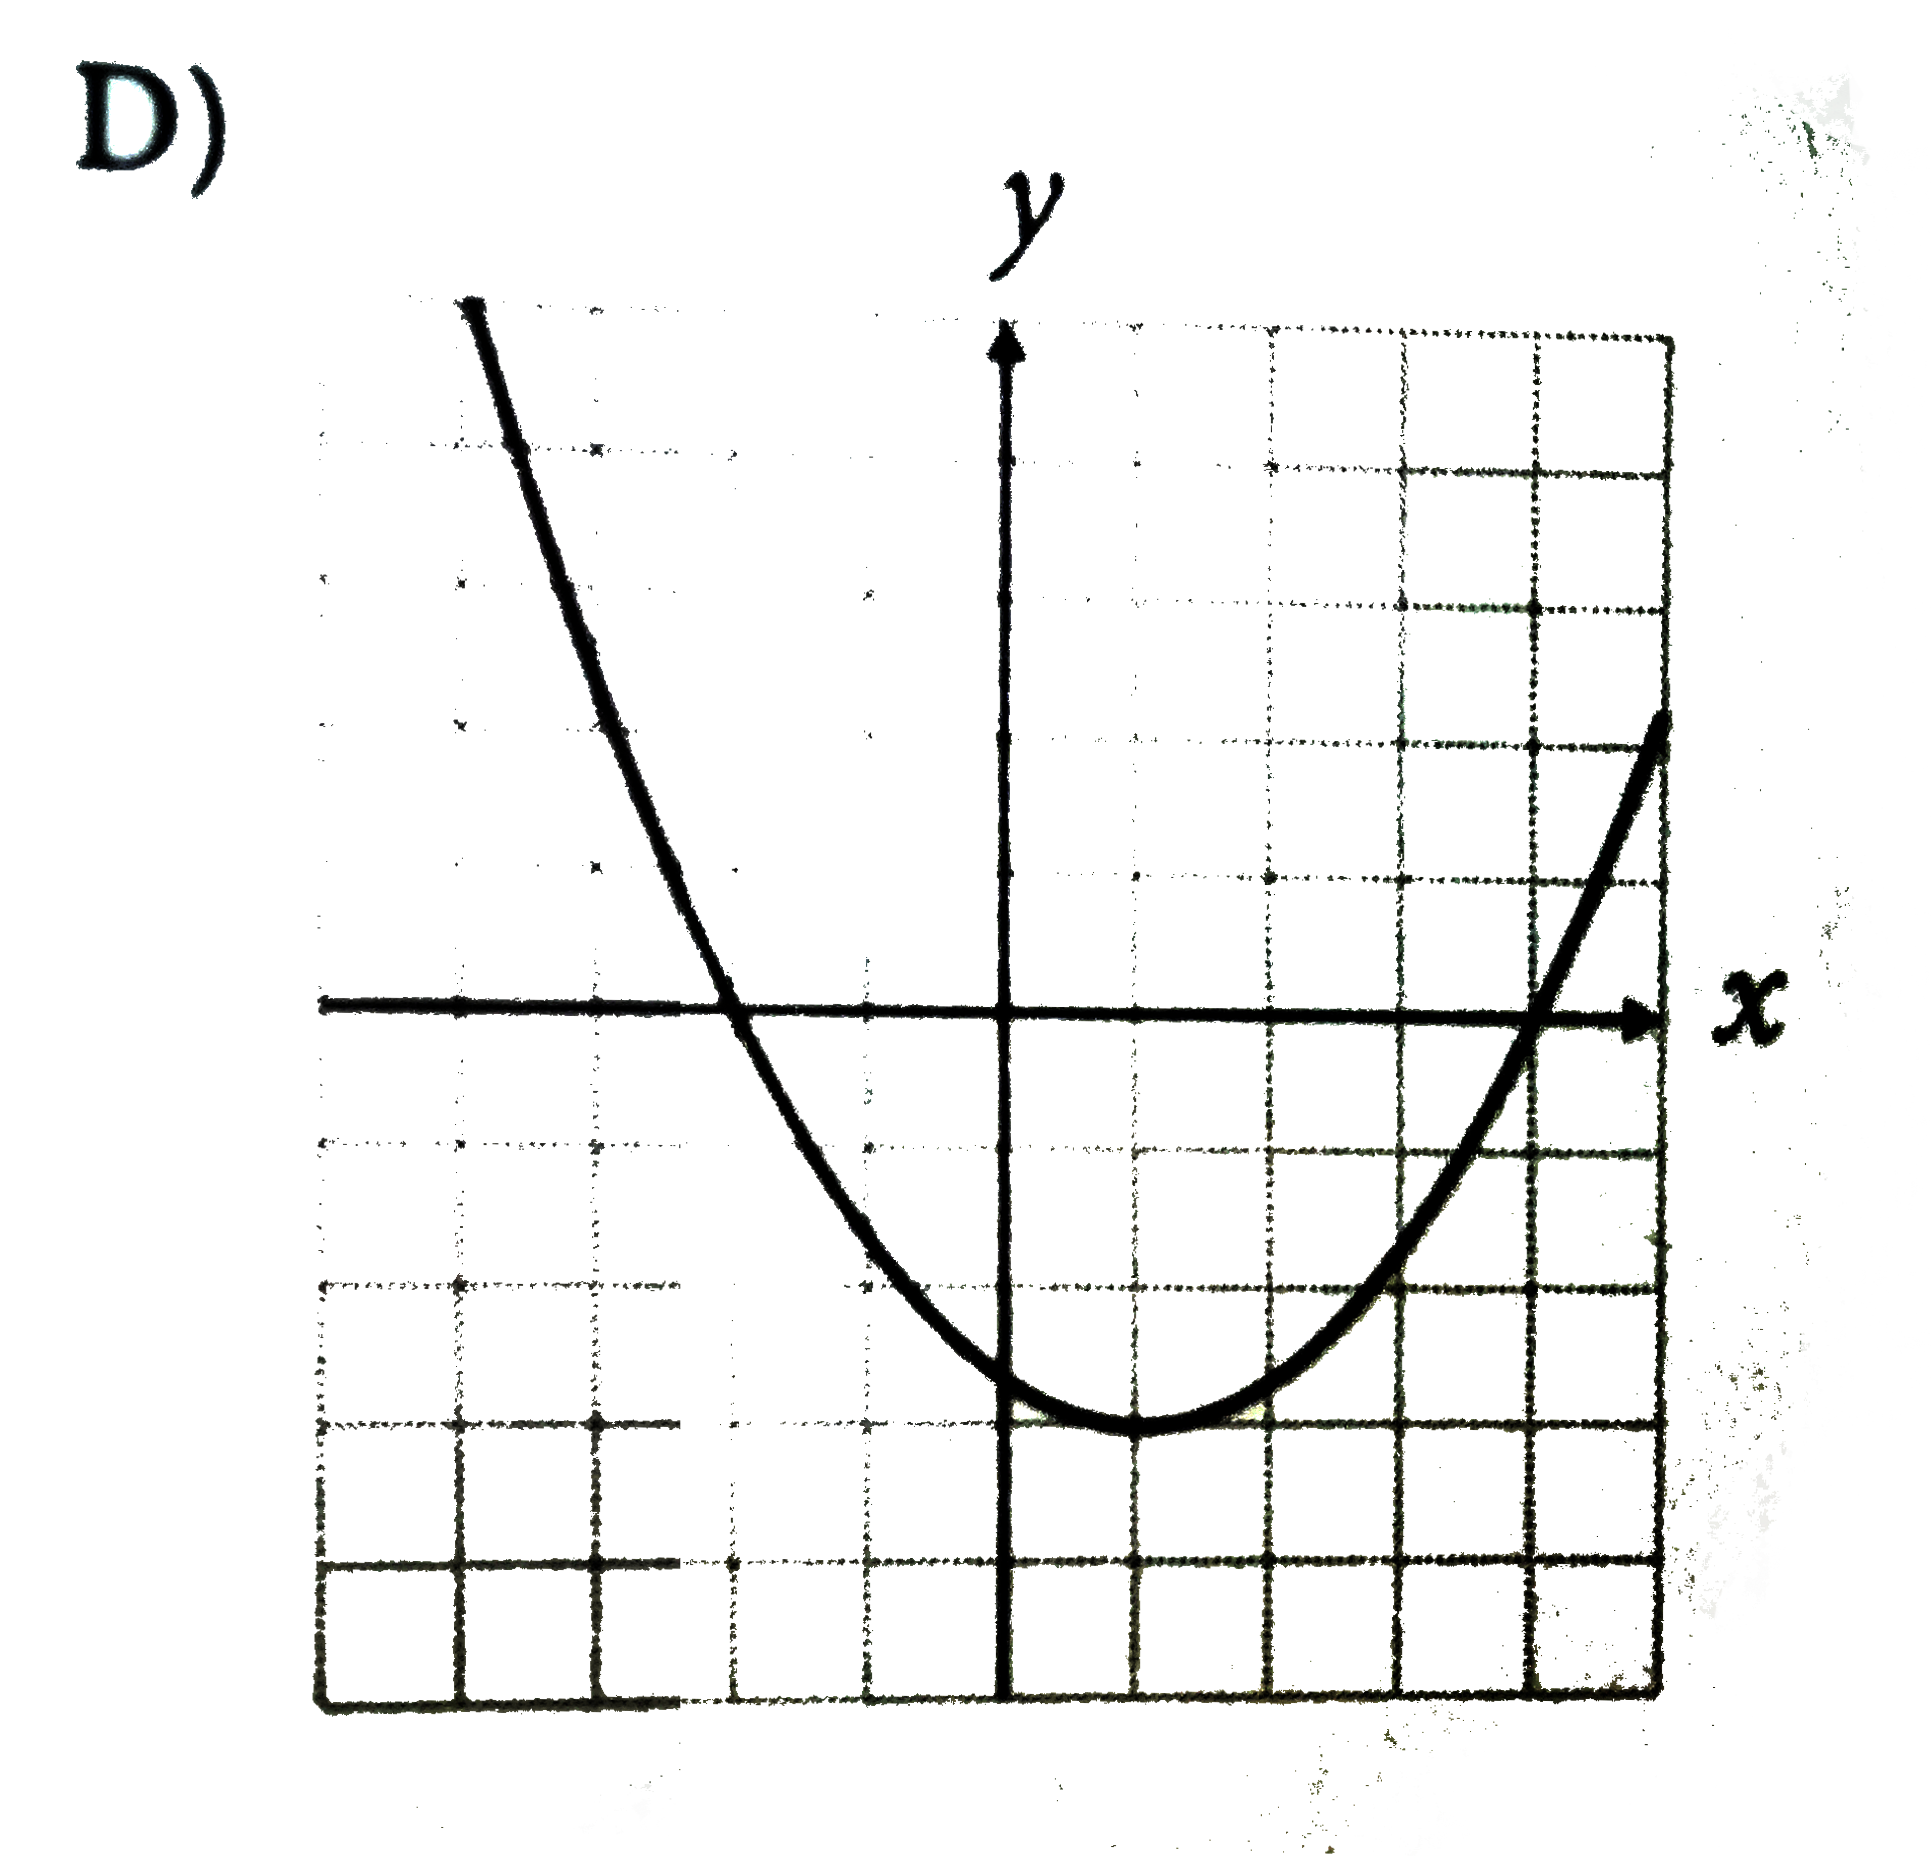
Functiuon g is related to function f by the equation g(x)=f(x−1)−2. If the point (4,3) is on the graph of function f, what are the coordinates of the corresponding point on the graph of function g?
A(3,1)B(5,1)C(1,3)D(1,5)
Consider the following function f whose graph is given below.
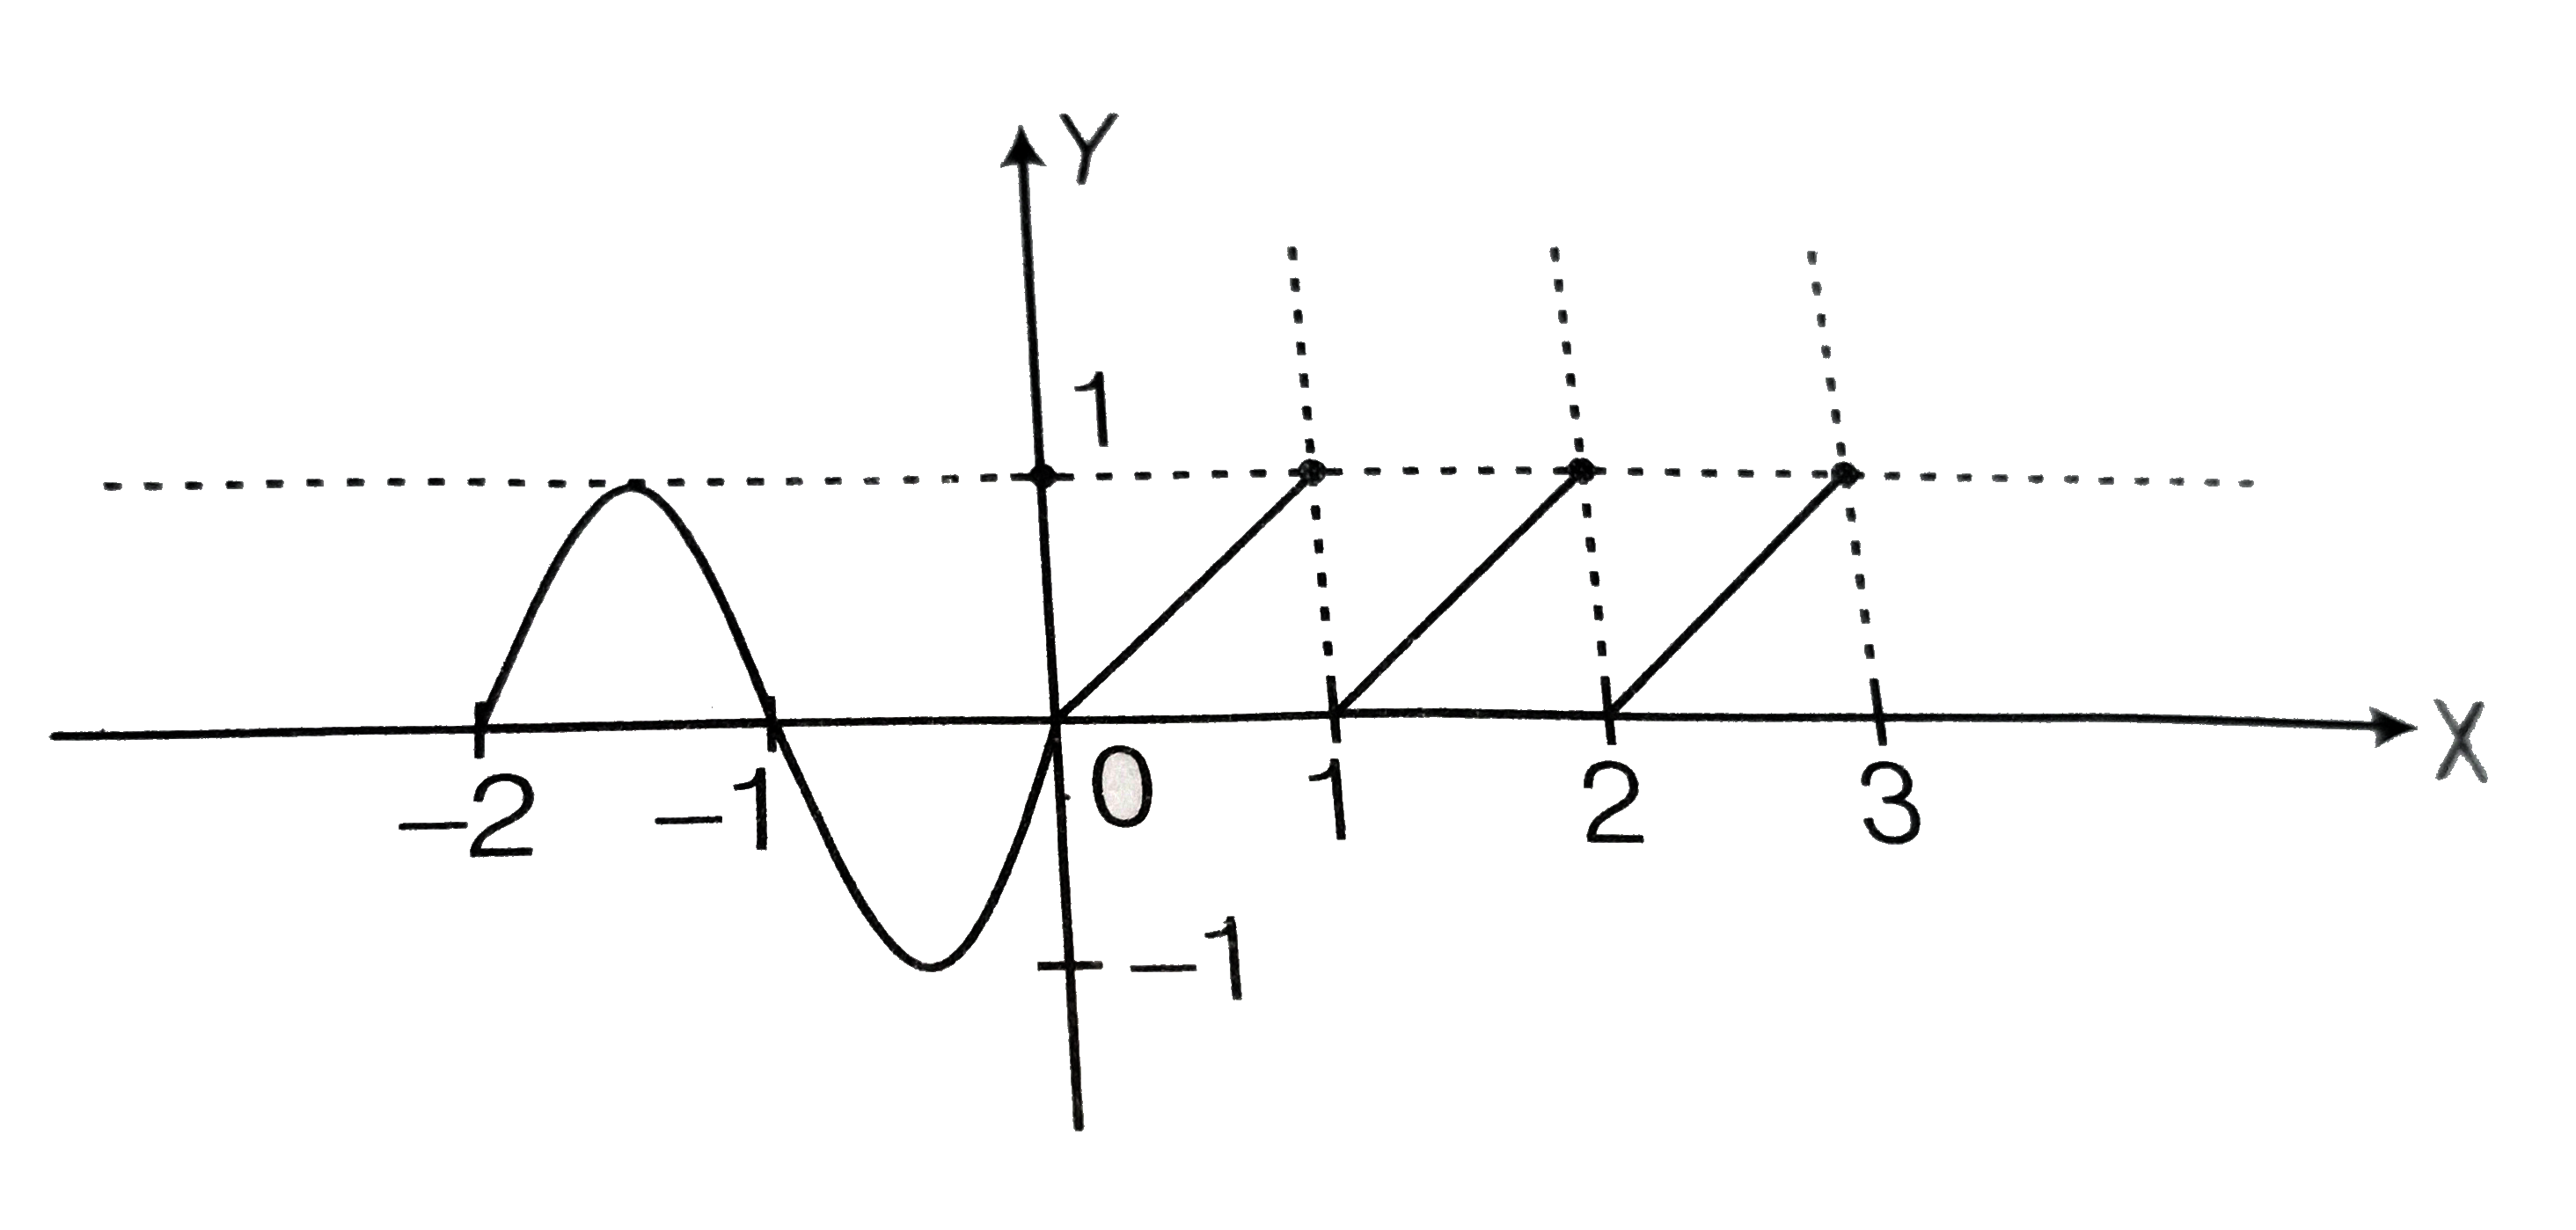
Draw the graph of following functions.
(g) f(x−[x])
View SolutionConsider the following function f whose graph is given below.
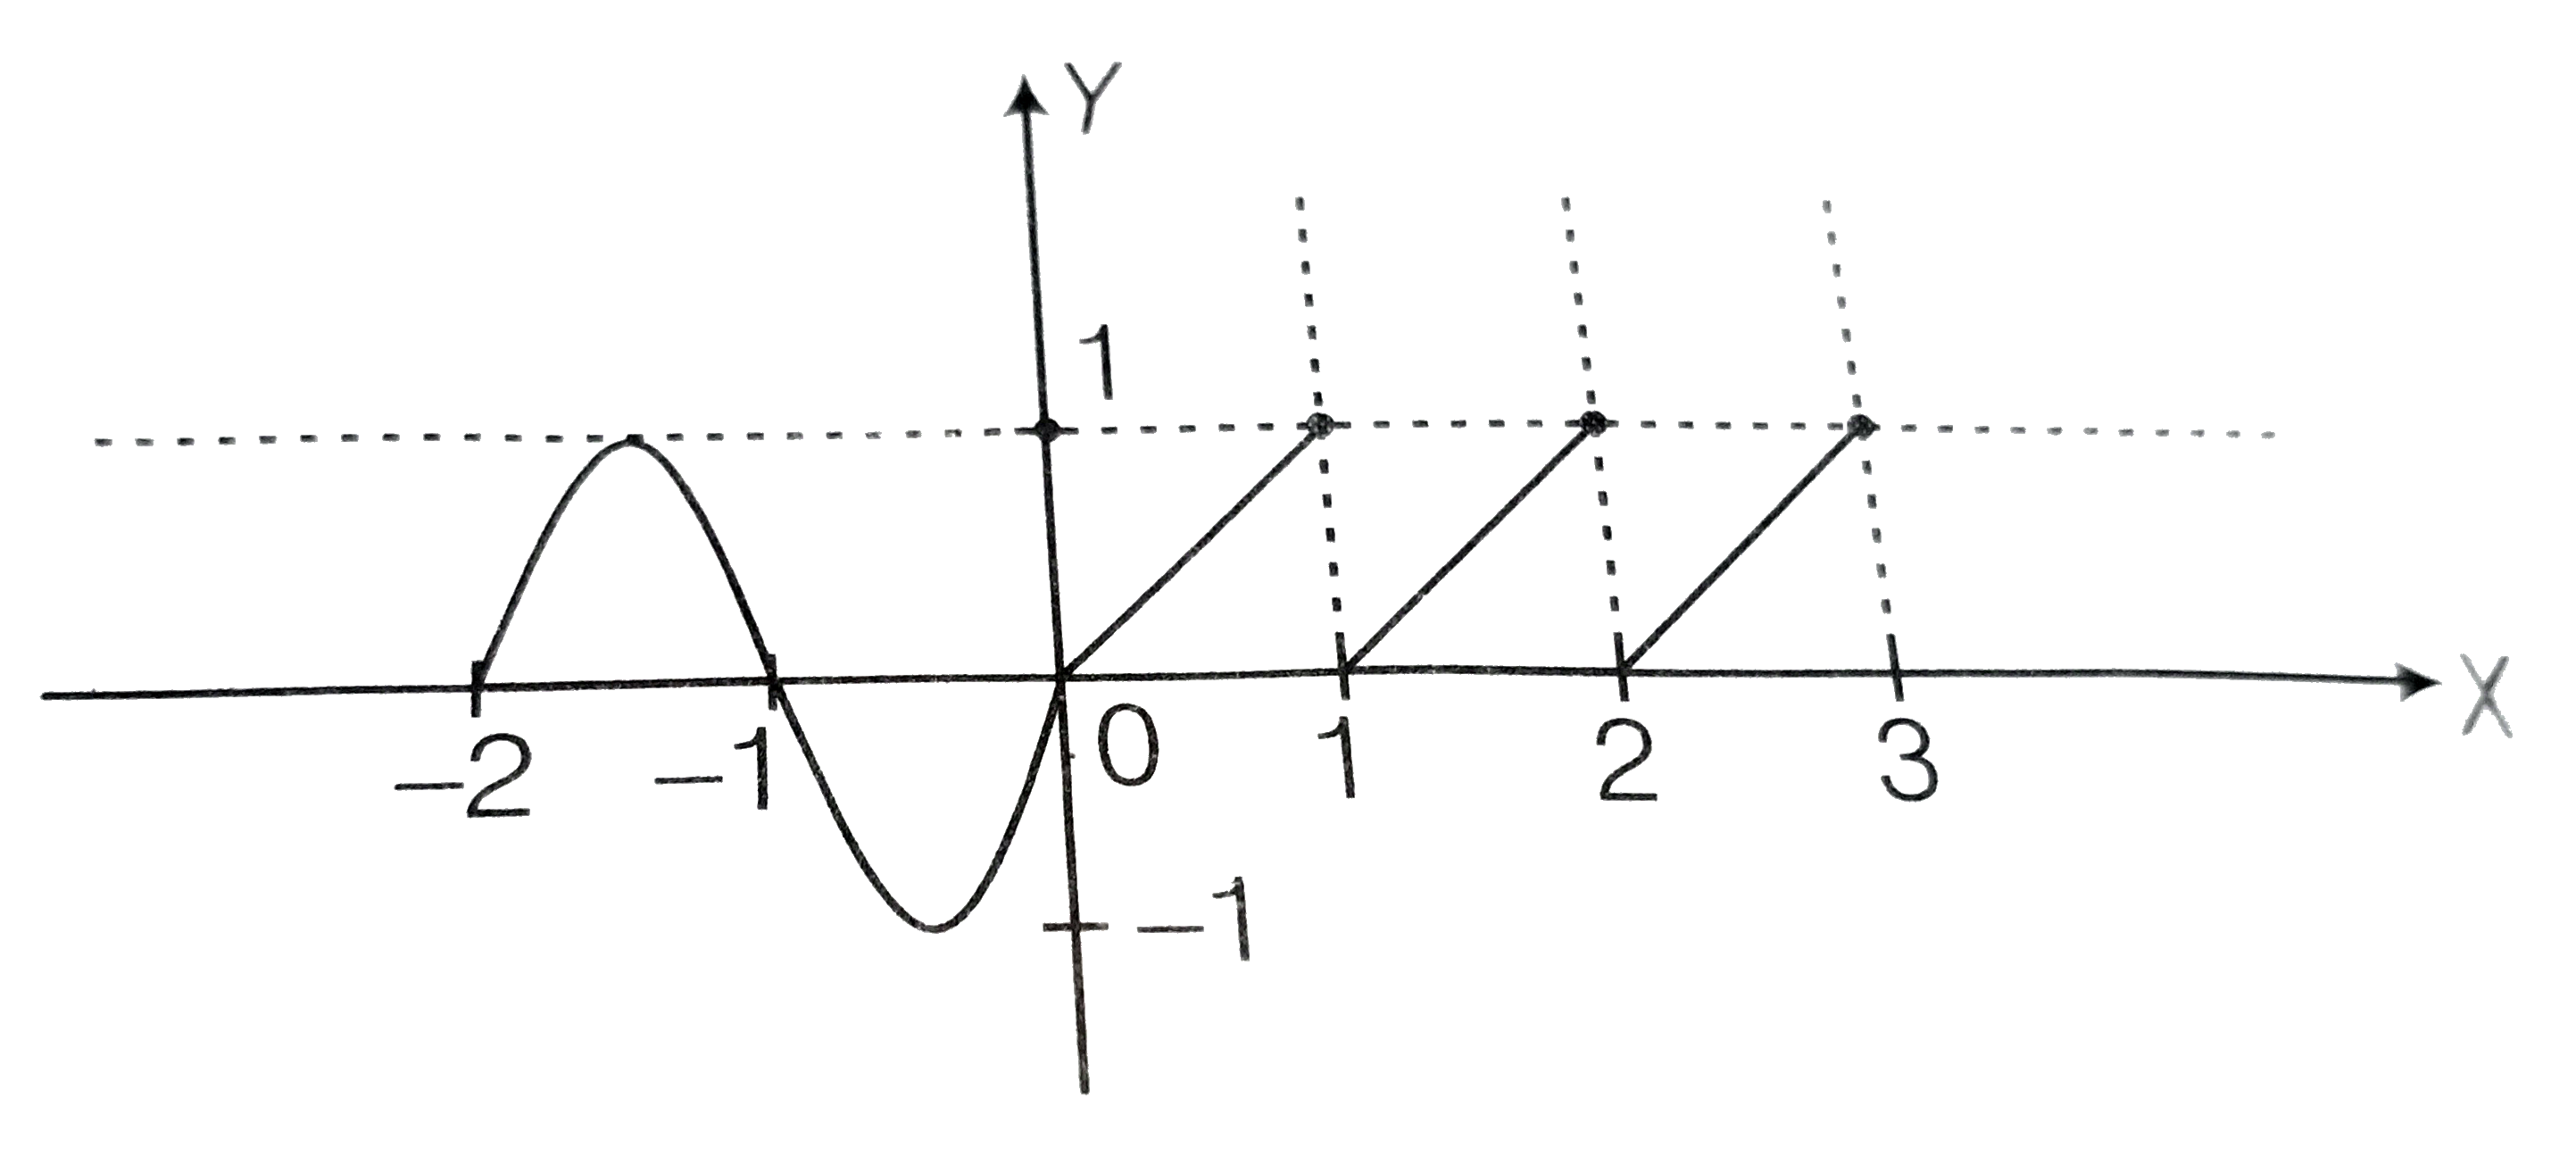
Draw the graph of following functions.
(g) 2f(x)
View SolutionIf f(x)=3−xandg(x)=x22, which of the following is NOT in the range of f(g(x) ?
View SolutionIf g(x+3)=x2+2x+1, then which of the following gives g(x)?
View SolutionIf f(x)=cosxandg(x)=2x+1, which of the following are even functions?
I. f(x)⋅g(x)
II f(g(x))
III. g(f(x))
View Solution
