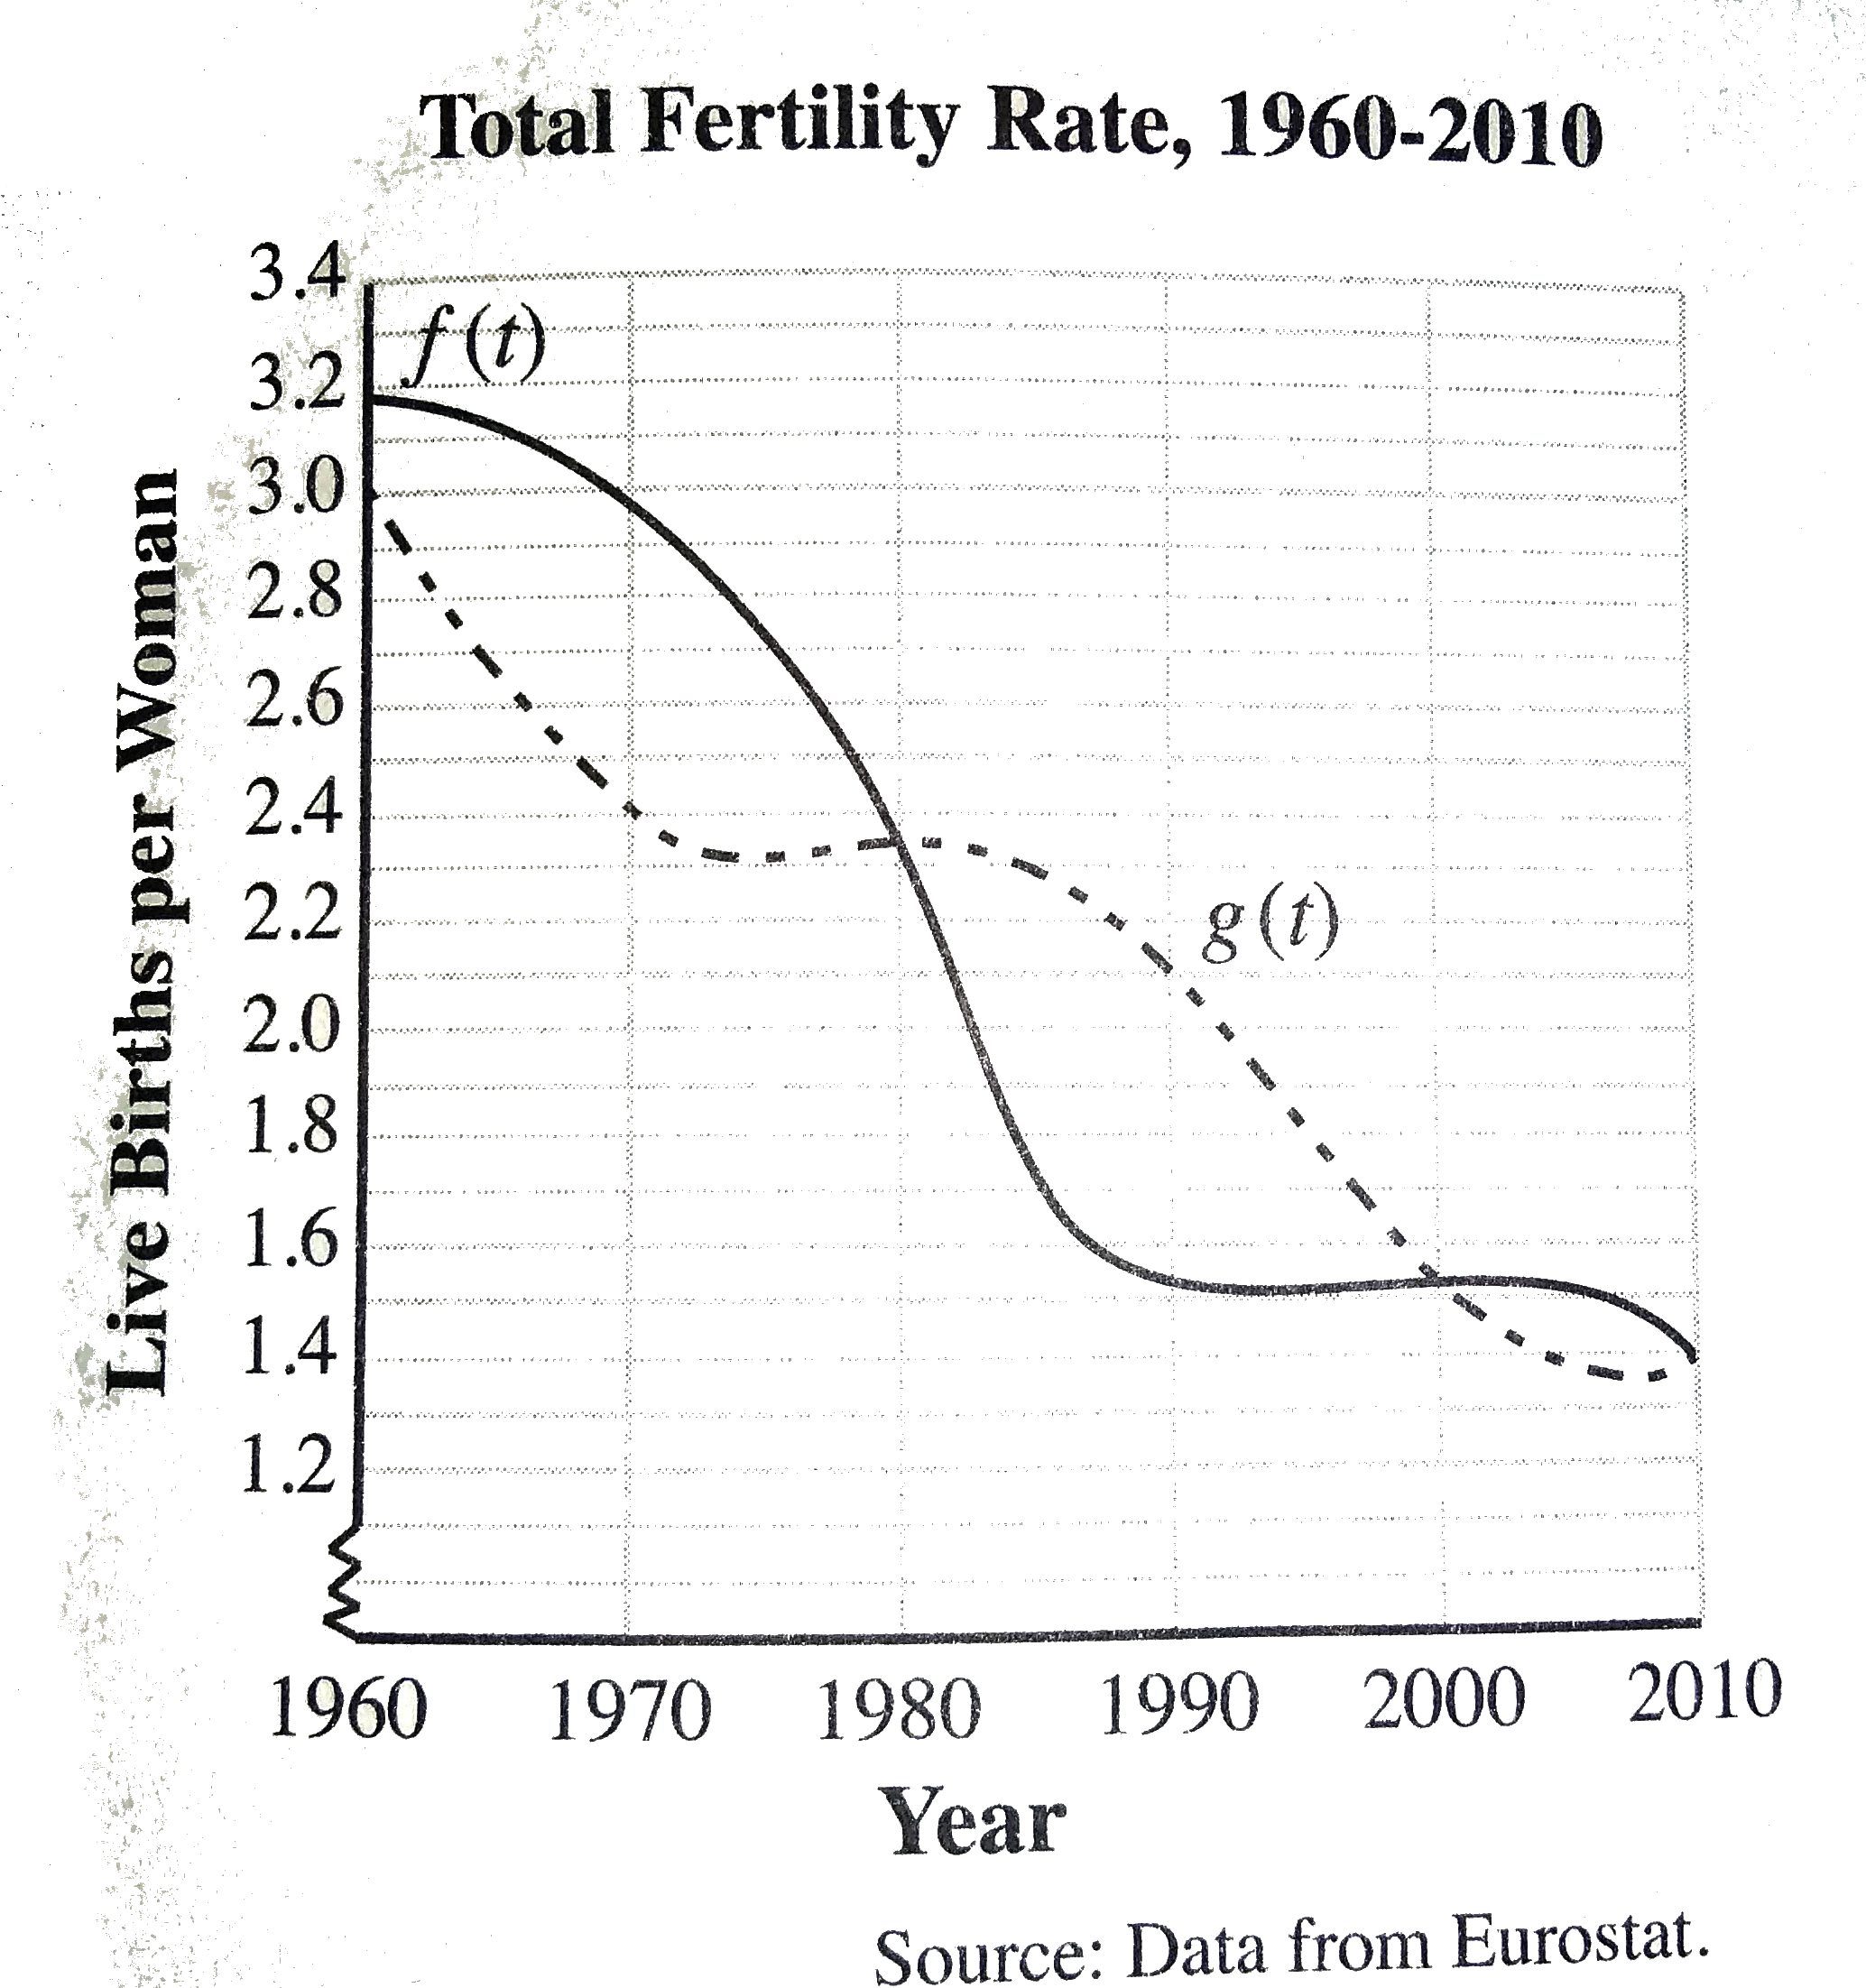
One indicator of a declining economy is a continued decline in birth rates. In 2010, birth rates in Europe were at an all-time low, with the average number of children that a women has in her lifetime at well below two. In the figure above, f(t) represents birth rates for Portugal between 1960 and 2010, and g(t) represents birth in Slovakia for the same time period. For which value (s) of t is f(t)>g(t)?
1960<t<1980 only
1980<t<2000 only
1960<t<1980and1990<t<2000
1960<t<1980and2000<t<2010
The correct Answer is:D
Step by step video & image solution for One indicator of a declining economy is a continued decline in birth rates. In 2010, birth rates in Europe were at an all-time low, with the average number of children that a women has in her lifetime at well below two. In the figure above, f(t) represents birth rates for Portugal between 1960 and 2010, and g(t) represents birth in Slovakia for the same time period. For which value (s) of t is f(t)gtg(t)? by Maths experts to help you in doubts & scoring excellent marks in Class 10 exams.
Updated on:21/07/2023Topper's Solved these Questions
Similar Questions
Congenital present at birth
View SolutionWhy is oxytocin called a birth hormone?
View SolutionExplain the birth rate and death rate in population with the help of an example.
View SolutionThe diseases that are present from birth are called
View SolutionWhich one is not legitimate for reducing birth rate :-
View SolutionIn which one of the following the birth rate is high & death rate is normal
View SolutionAt the time of birth , ovum arrested is the form of :-
View SolutionWhich one is not included in "barrier methods" of birth control?
View SolutionImmunity present at the time of birth is called
View SolutionIncrease in concentration of which hormone determines the time of child birth?
View Solution
