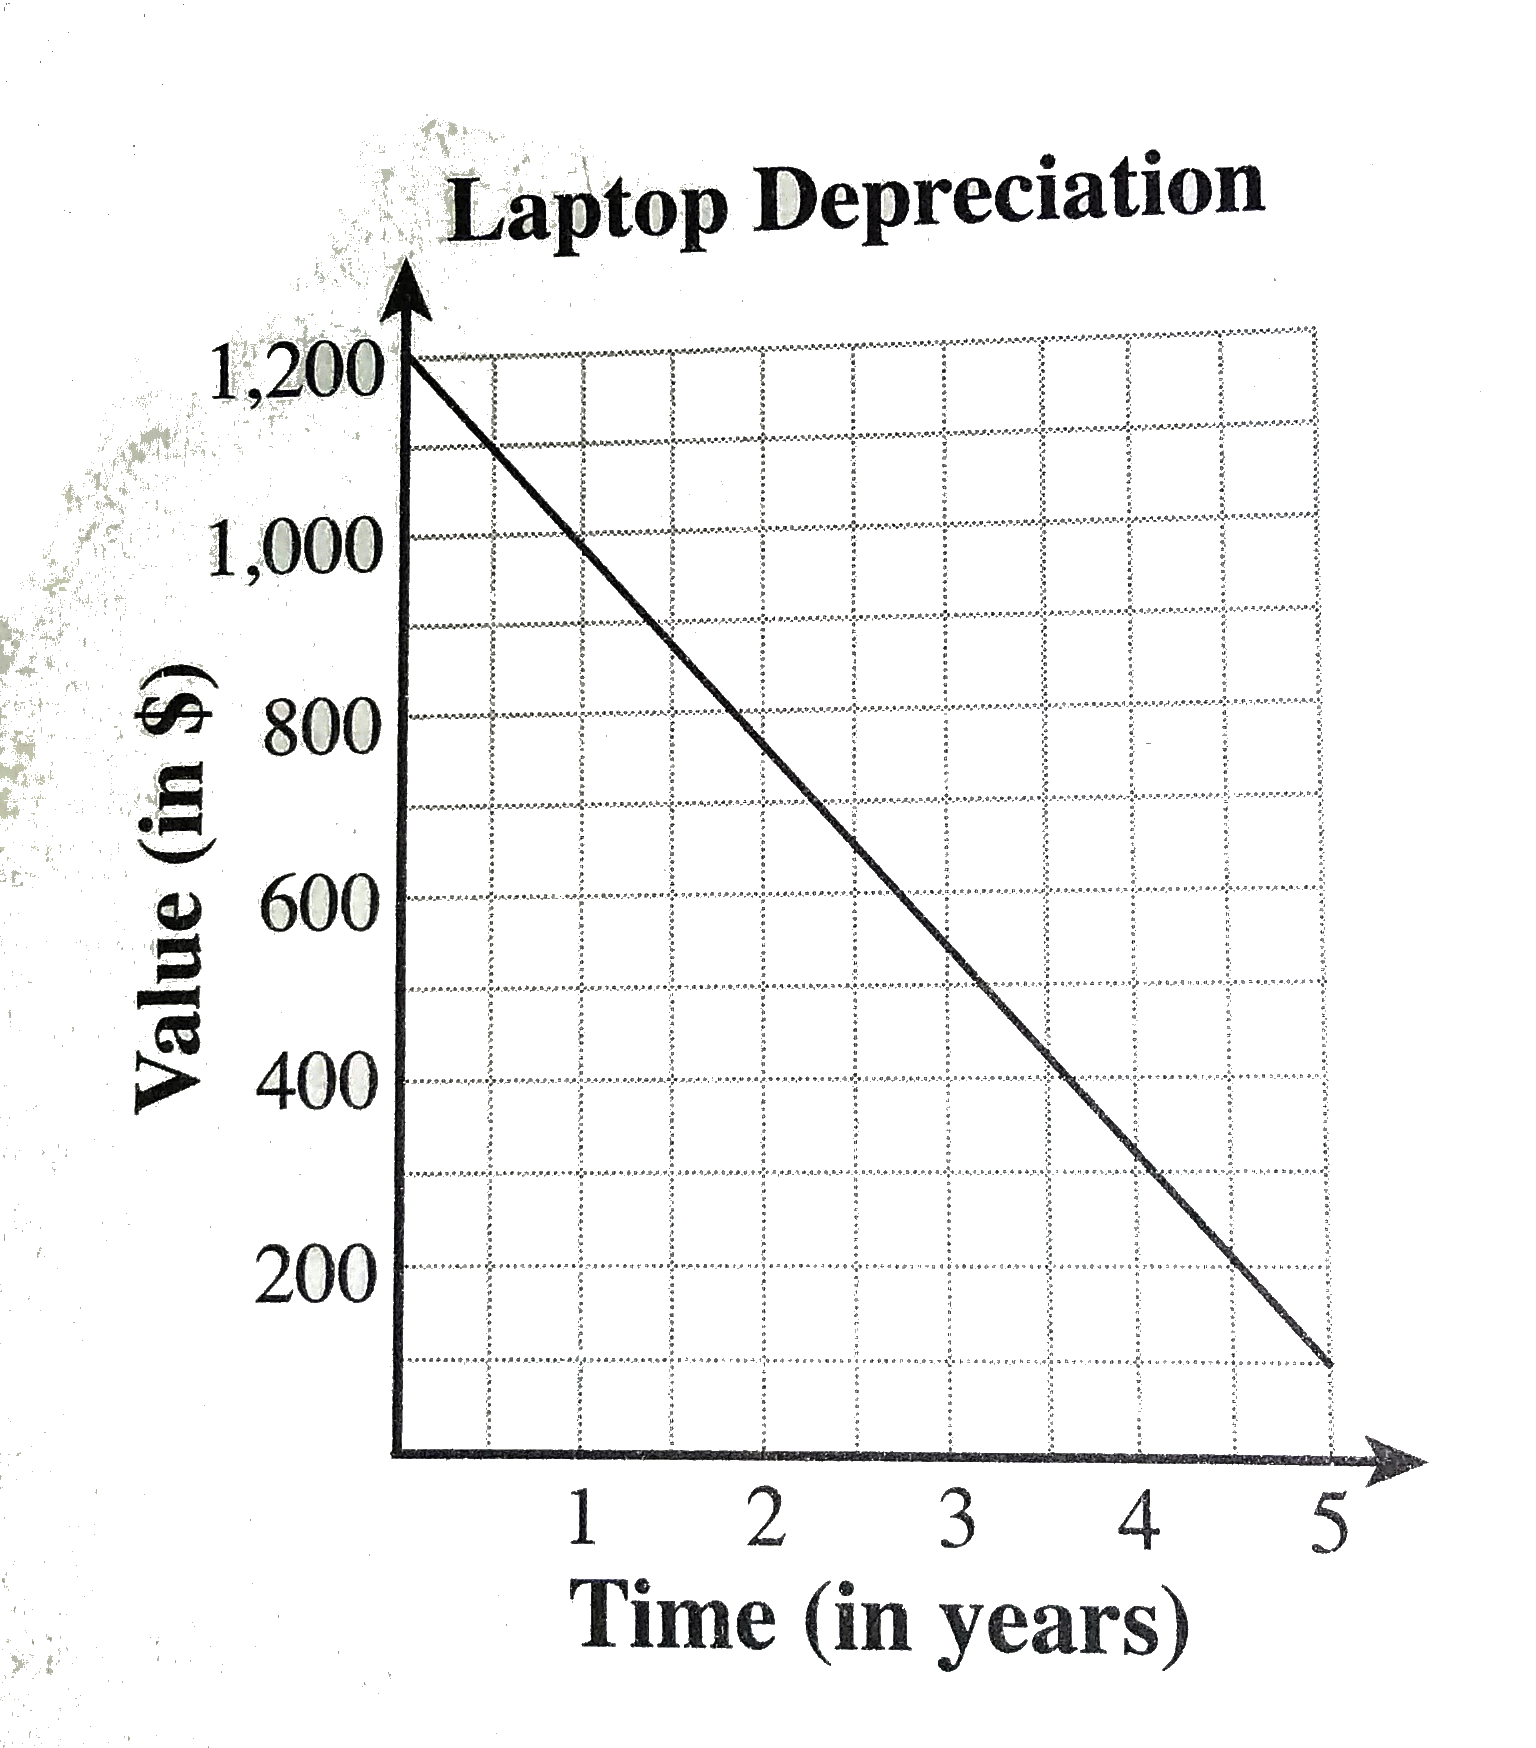
The figure above shows the straight-line depreciation of a laptop computer over the first five years of its use. According to the figure, what is the average rate of change in dollars per year of the value of the computer over the five-year period?
−1,100
−220
−100
100
The correct Answer is:B
Step by step video & image solution for The figure above shows the straight-line depreciation of a laptop computer over the first five years of its use. According to the figure, what is the average rate of change in dollars per year of the value of the computer over the five-year period? by Maths experts to help you in doubts & scoring excellent marks in Class 10 exams.
Updated on:21/07/2023Topper's Solved these Questions
Similar Questions
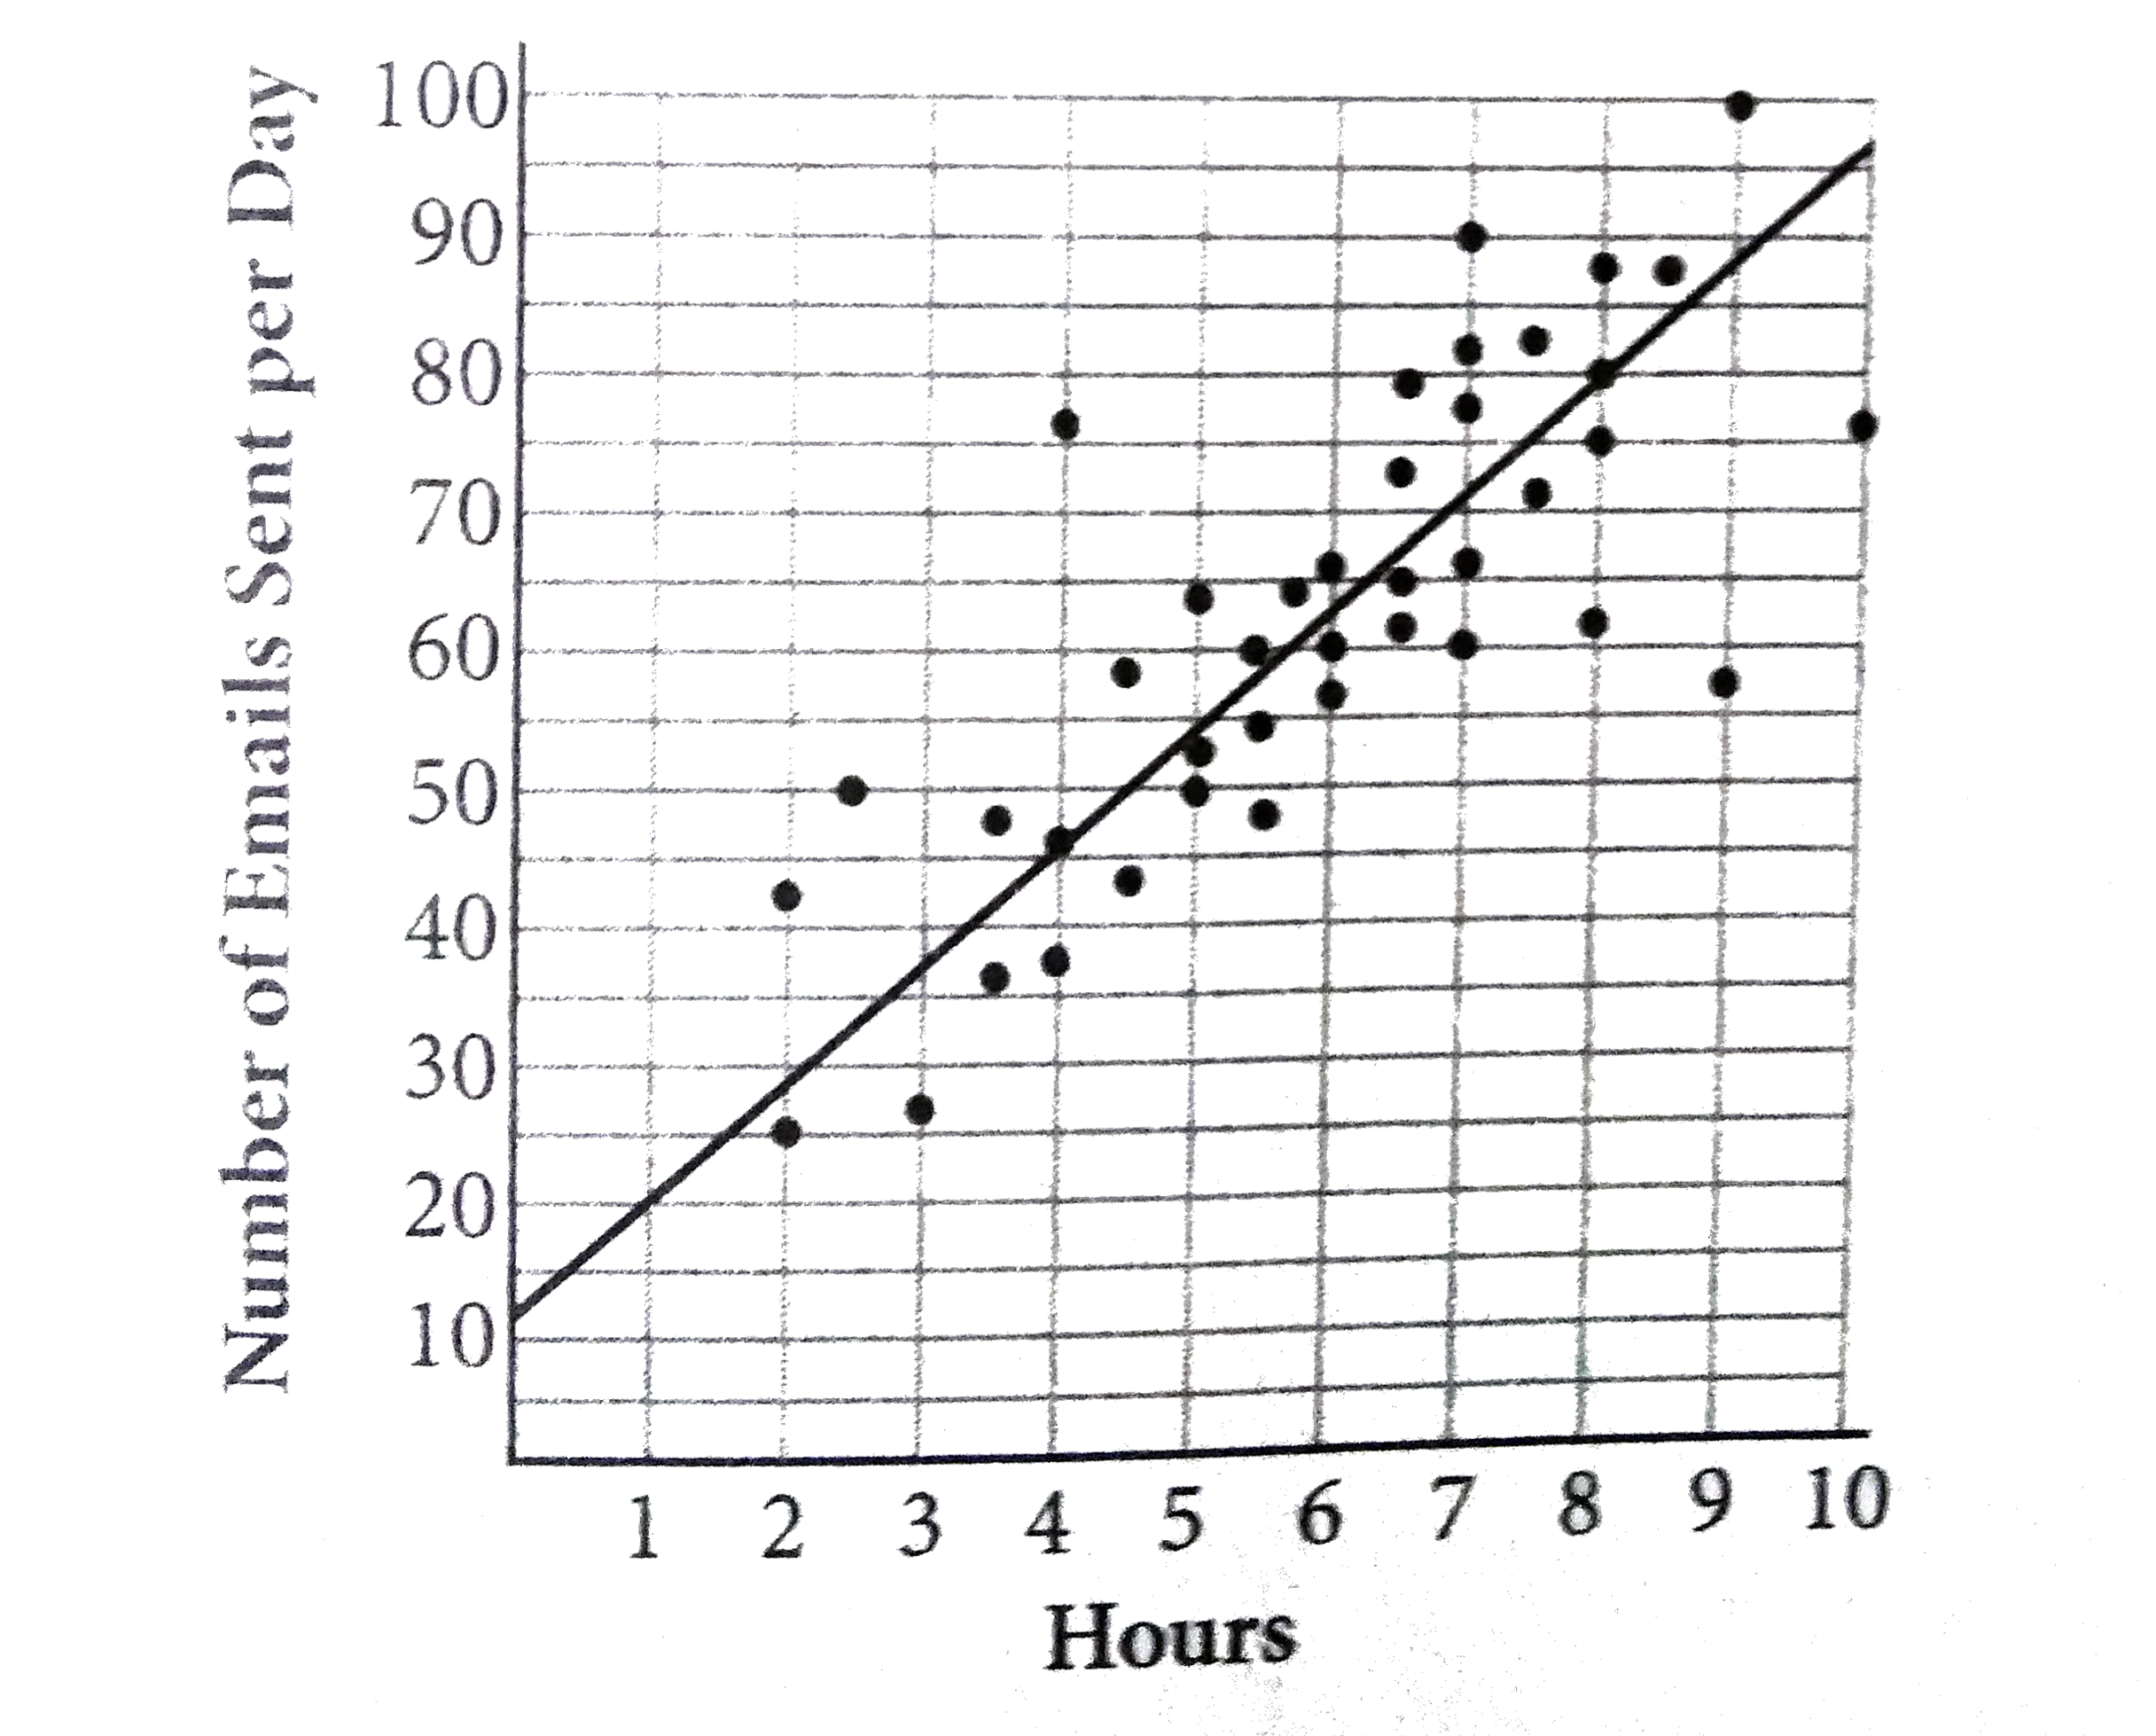
The figure above shows the number of emails sent per day plotted against the number of hours an adult works on a computer per day. Which of the following best estimates the average rate of change in the number of emails sent compared to the number of hours working on a computer?
View SolutionMohan purchased a house for Rs 30000 and its value is depreciating at the rate of 25% per year. Find the value of the house after 3 years.
View Solution
Knowledge Check
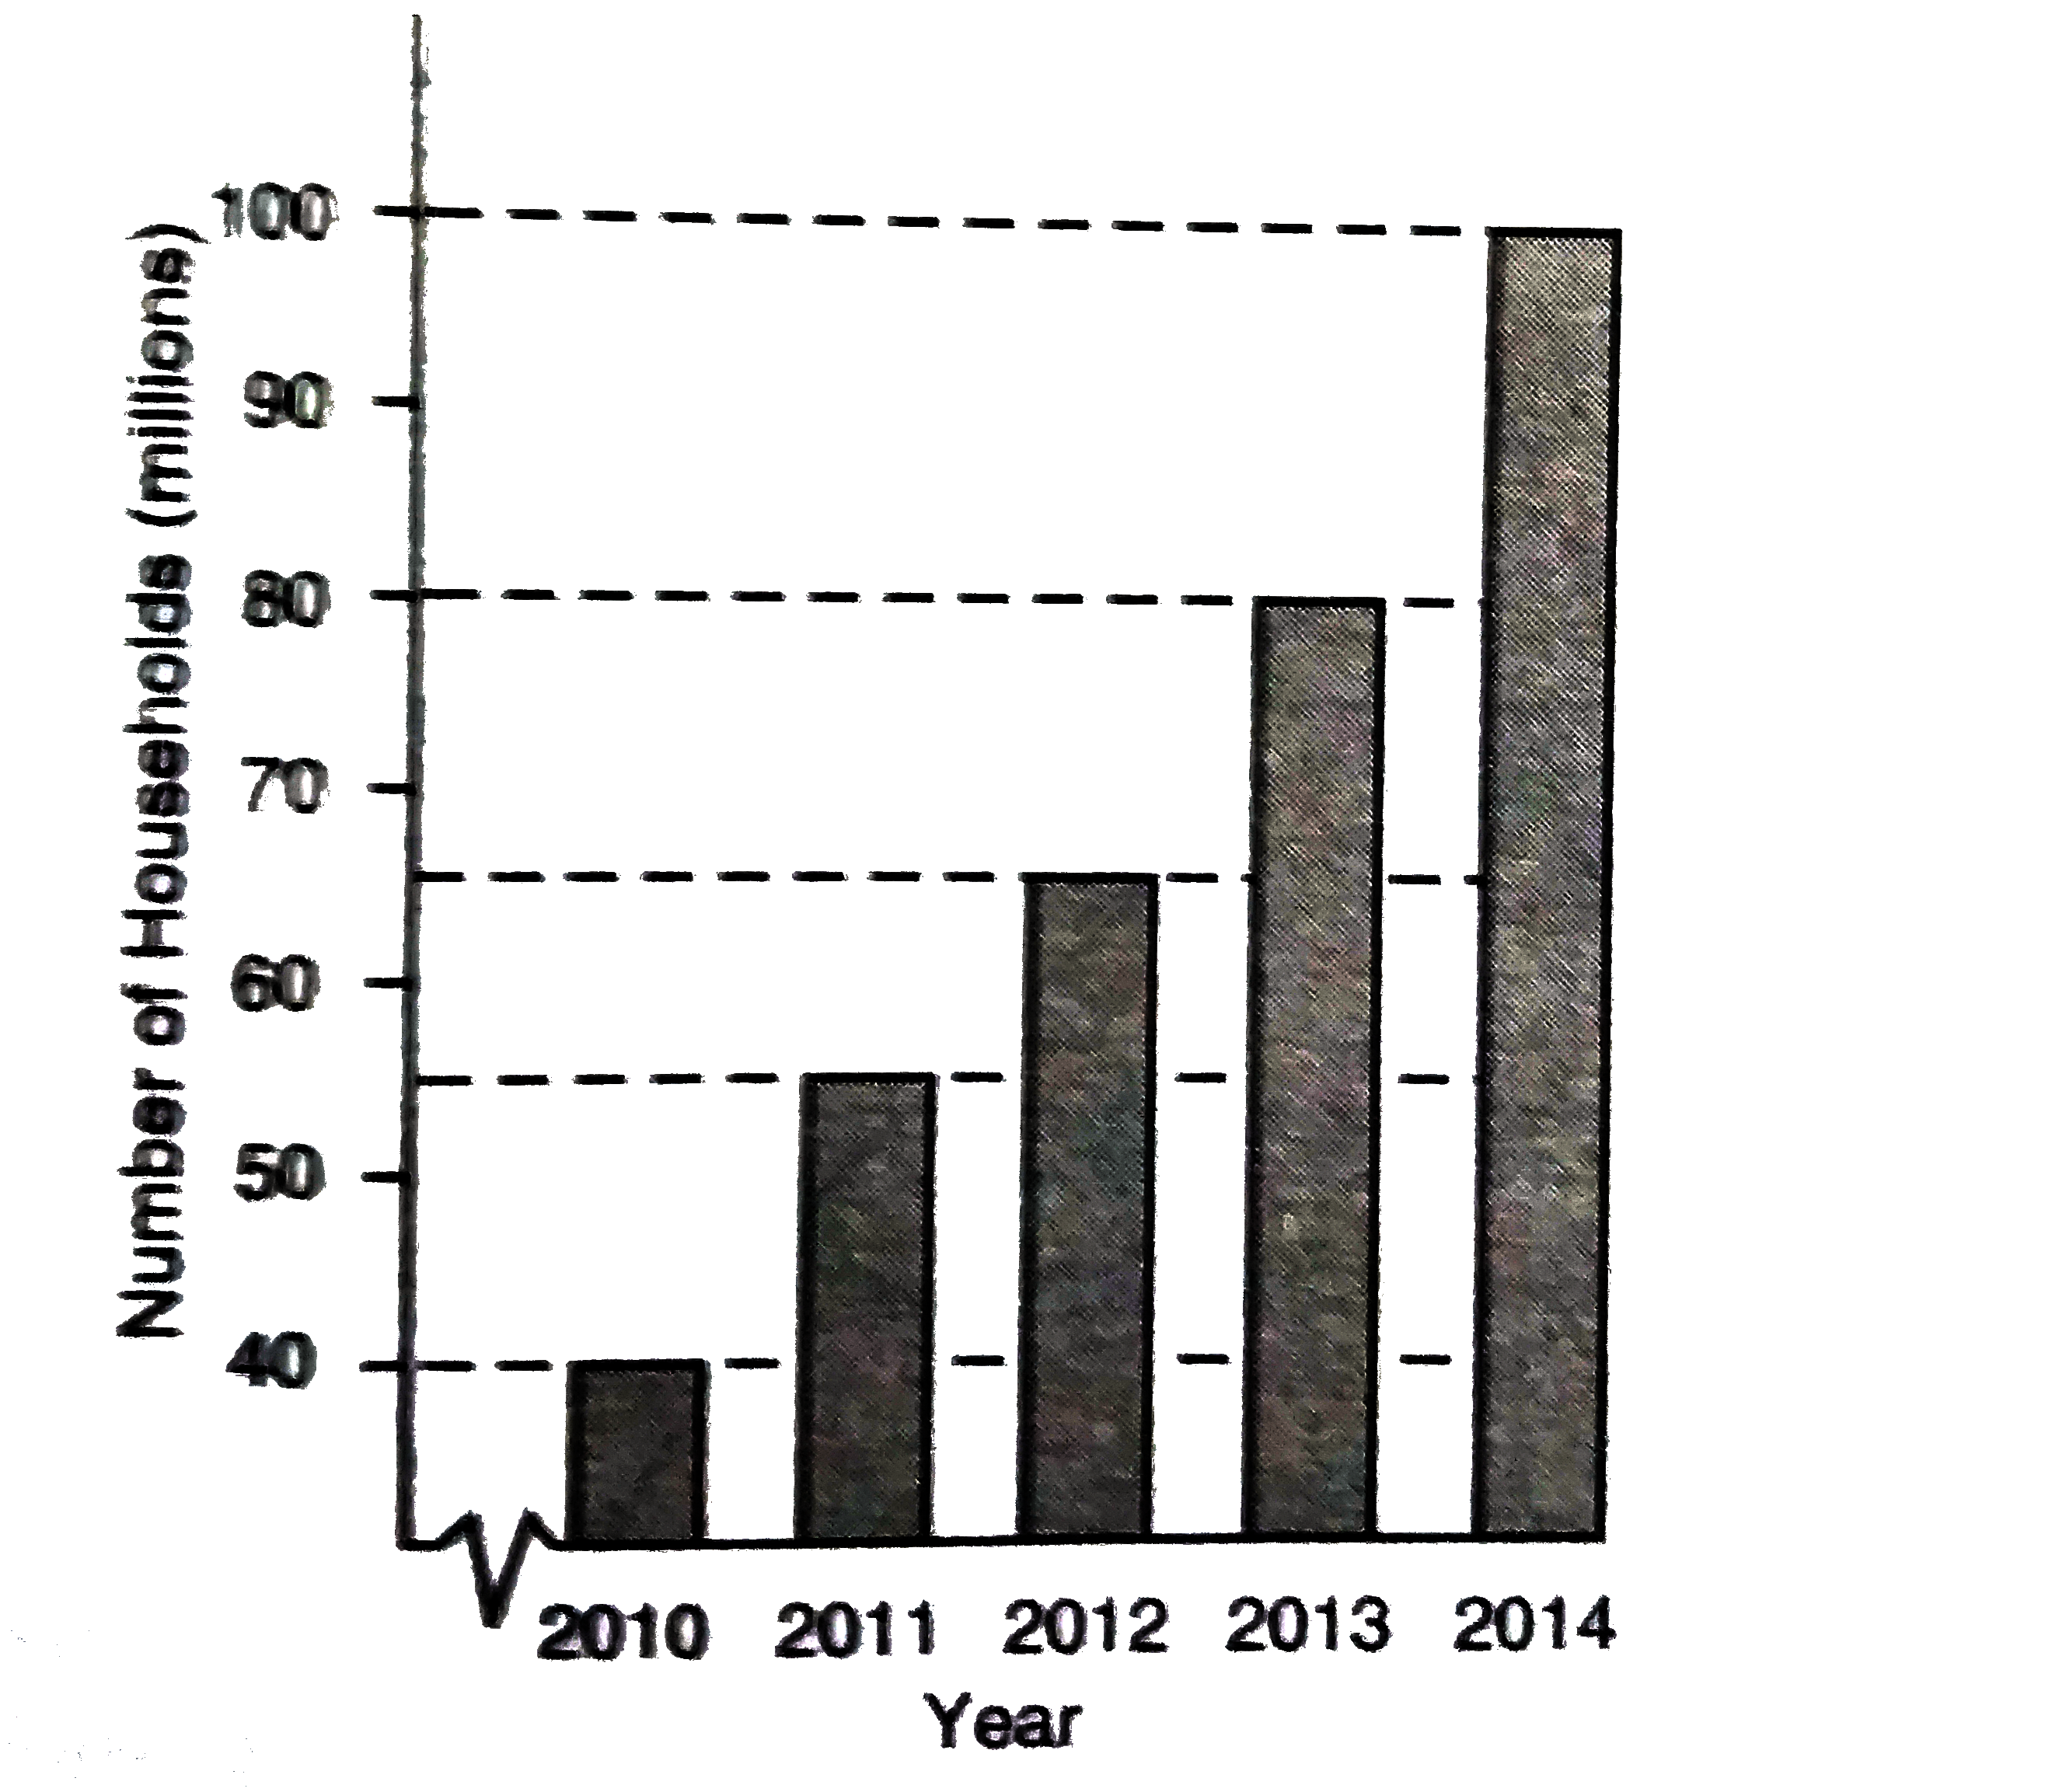
The graph above shows the number of U.S. households with laptop computers for the years 2010 to 2014.
Q. What was the percent of increase in the number of households with laptops from 2010 to 2014?A40%B60%C120%D150%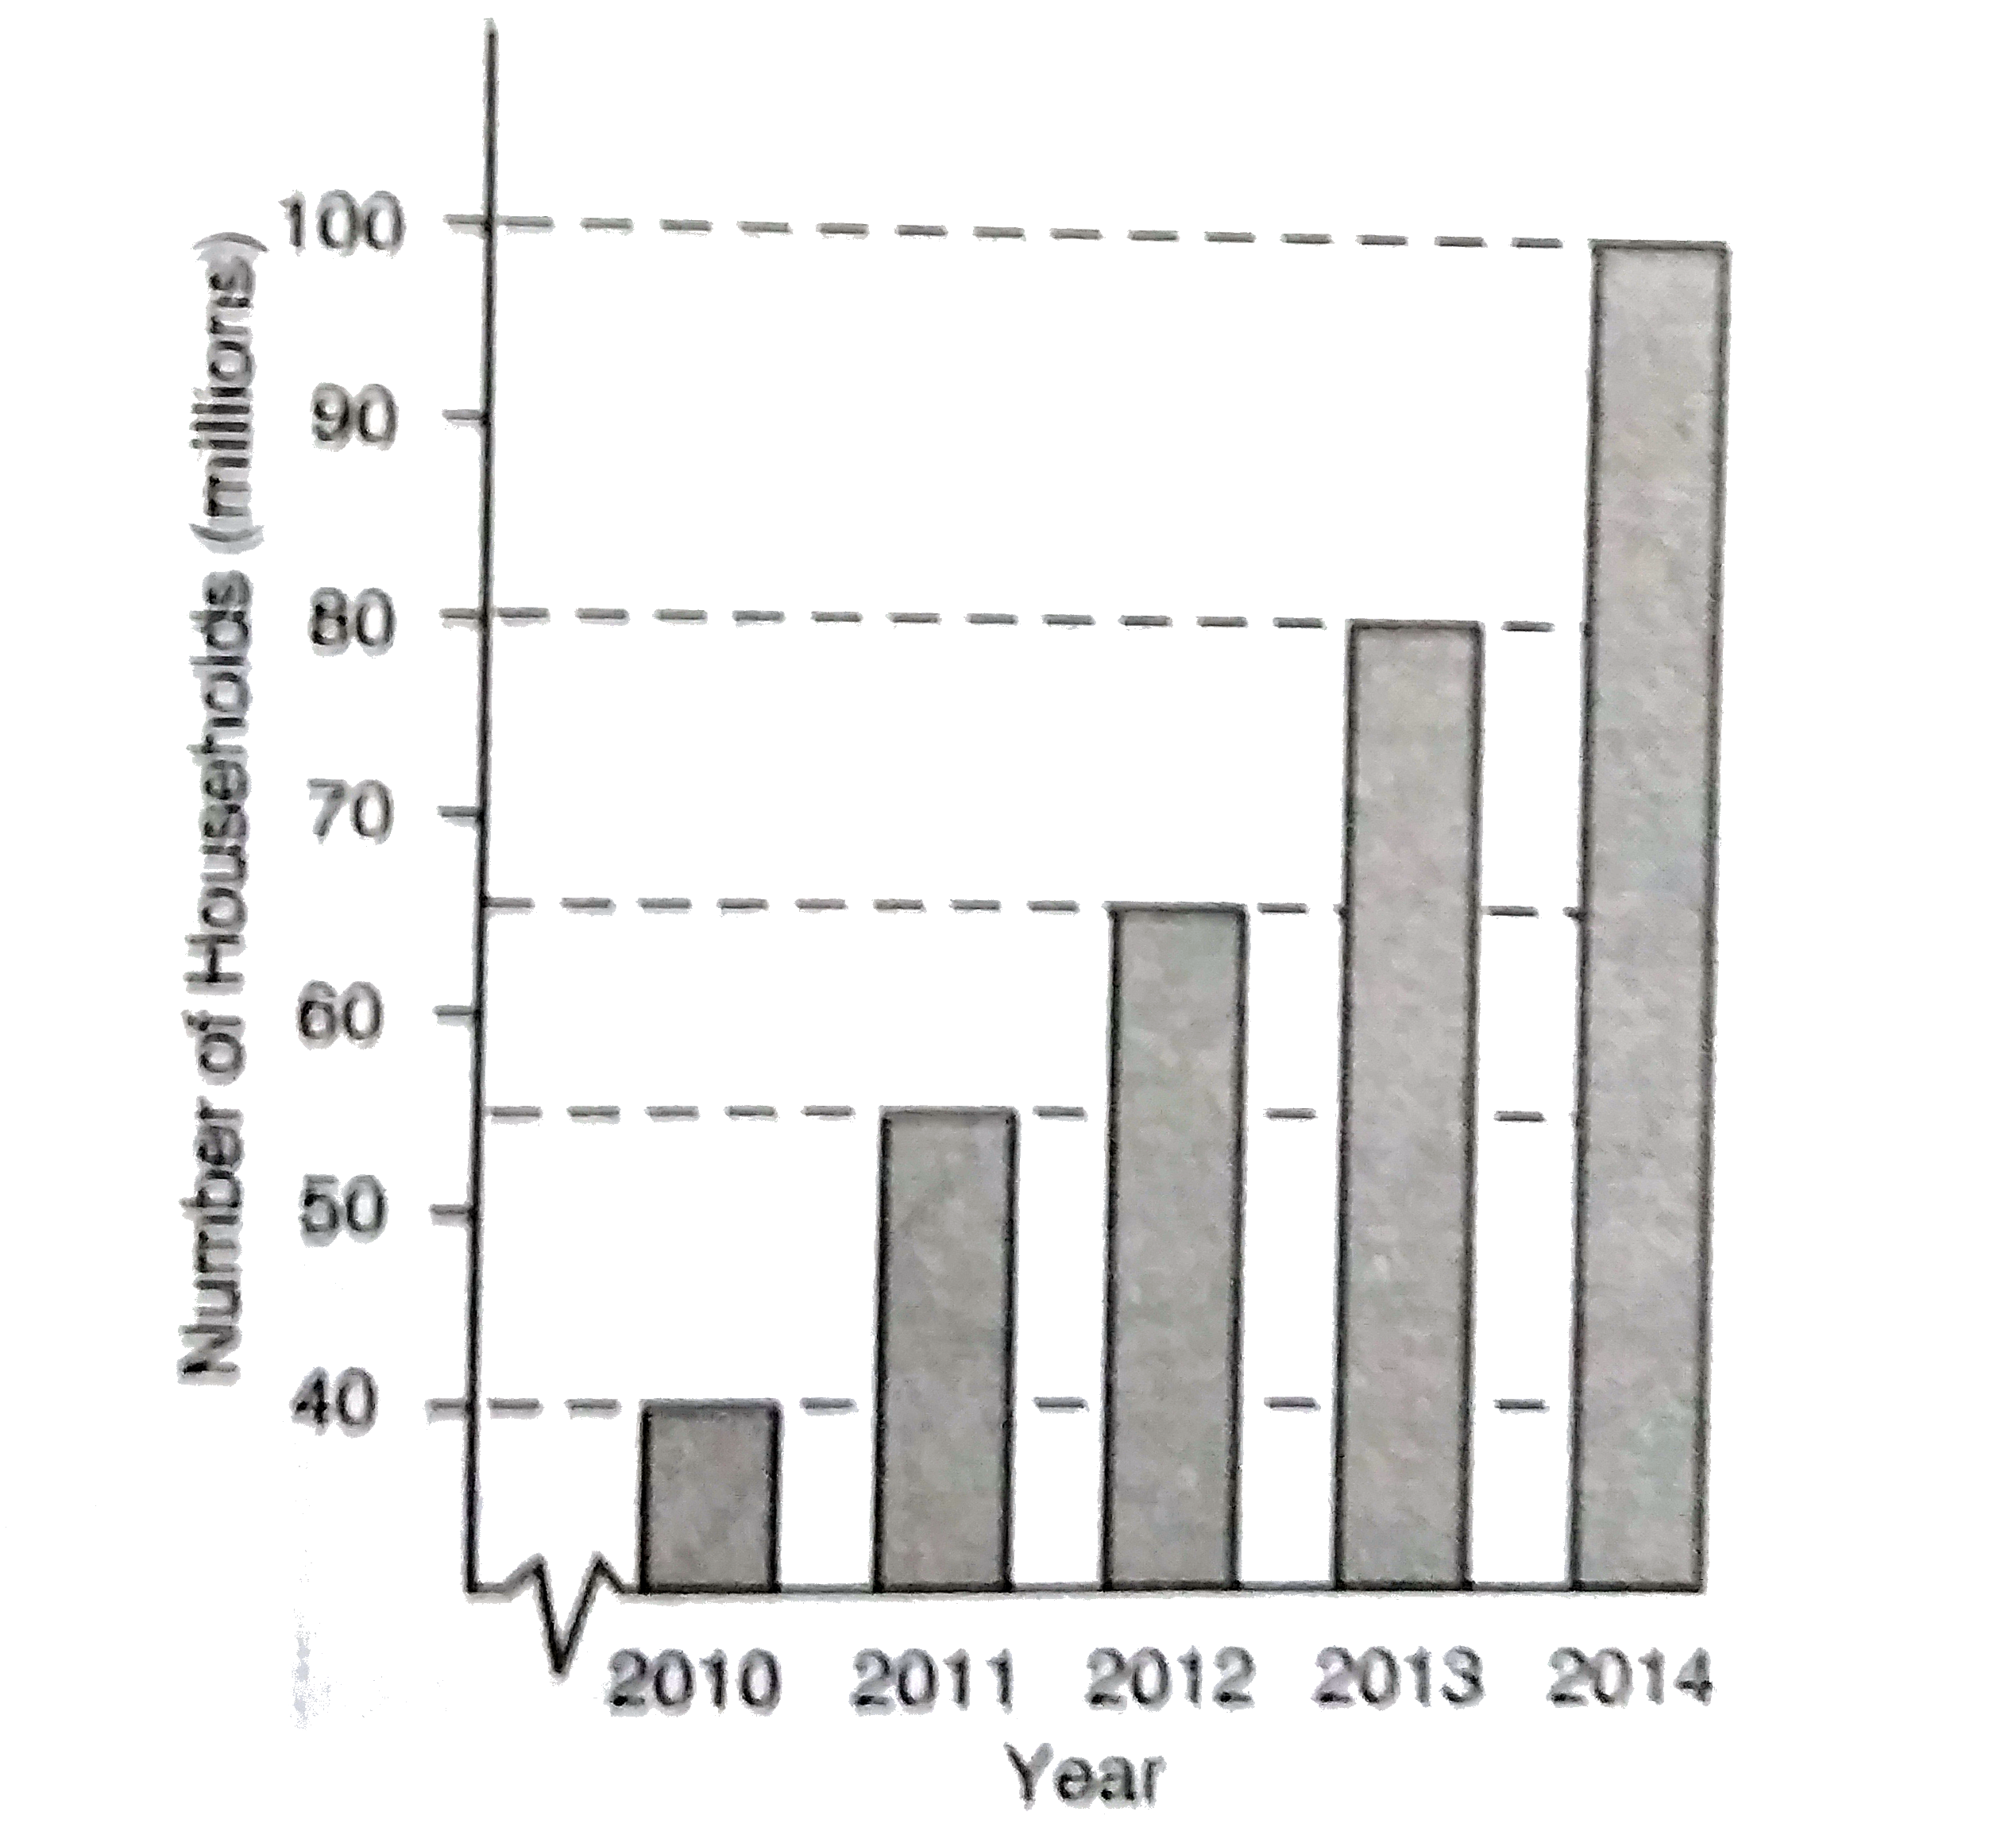
The graph above shows the number of U.S. households with laptop computers for the years 2010 to 2014.
Q. The greatest percent of increase in the number of households with laptops occurred in which two consecutive years?A2010 to 2011B2011 to 2012C2012 to 2013D2013 to 2014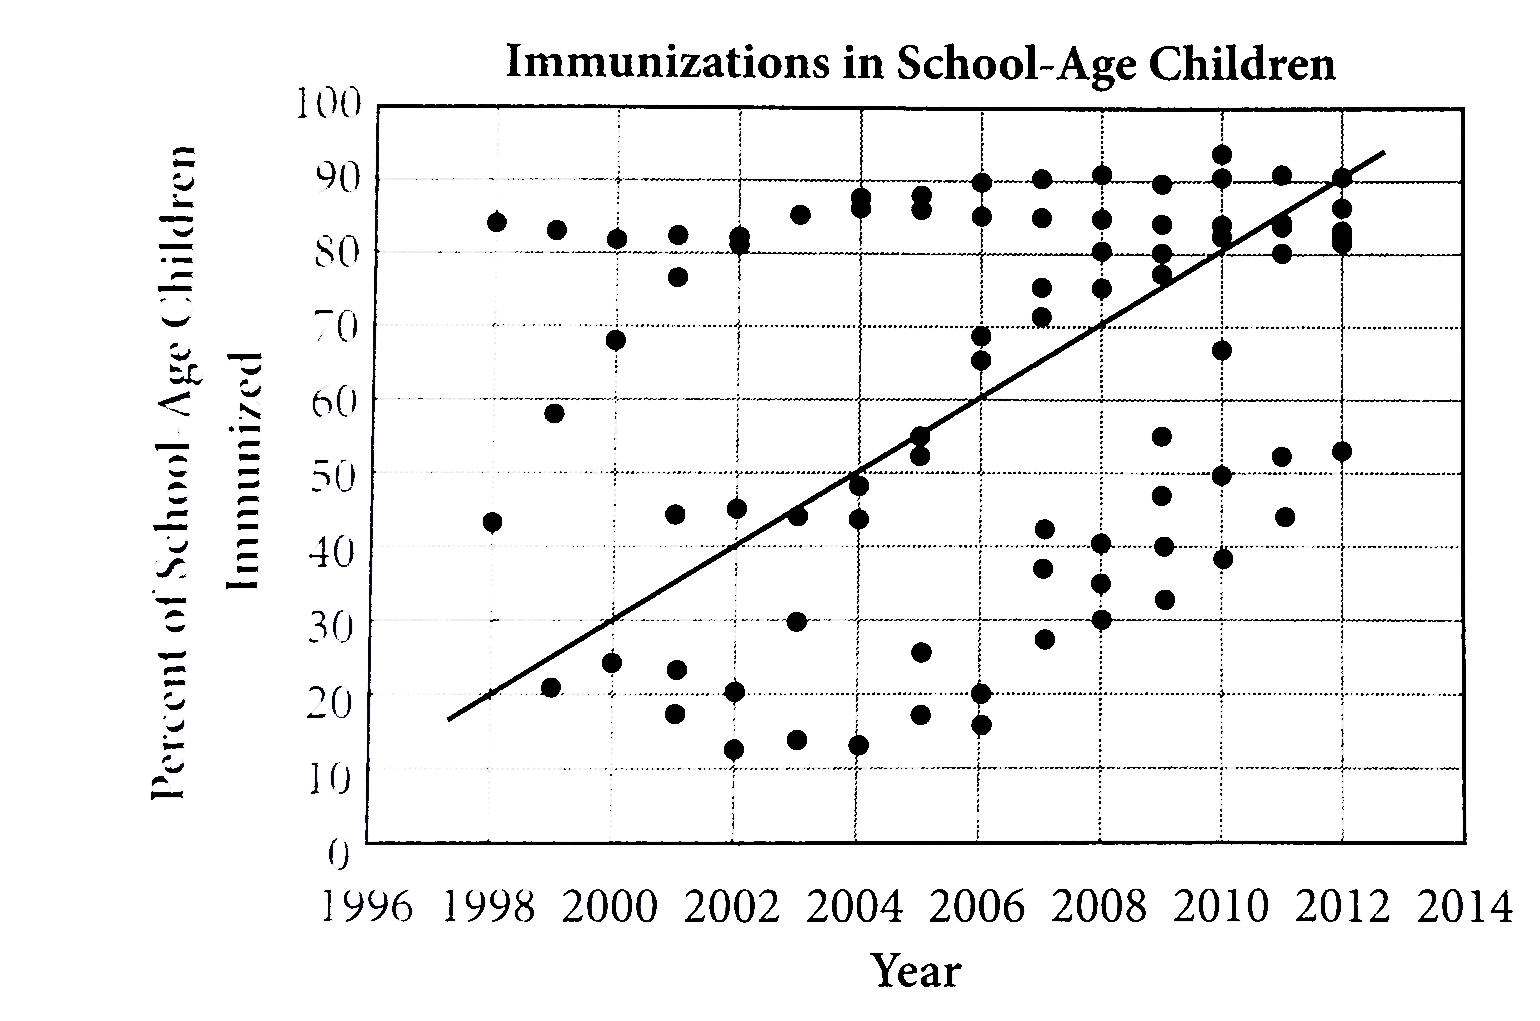
The graph above shows the percent of school-age children in the United States who received immunization for various illnesses beetween 1996 and 2012. What was the average rate of increase in the percent of children immunized per year over the given time period ?A5 percent per yearB10 percent per yearC25 percent per yearD70 percent per year
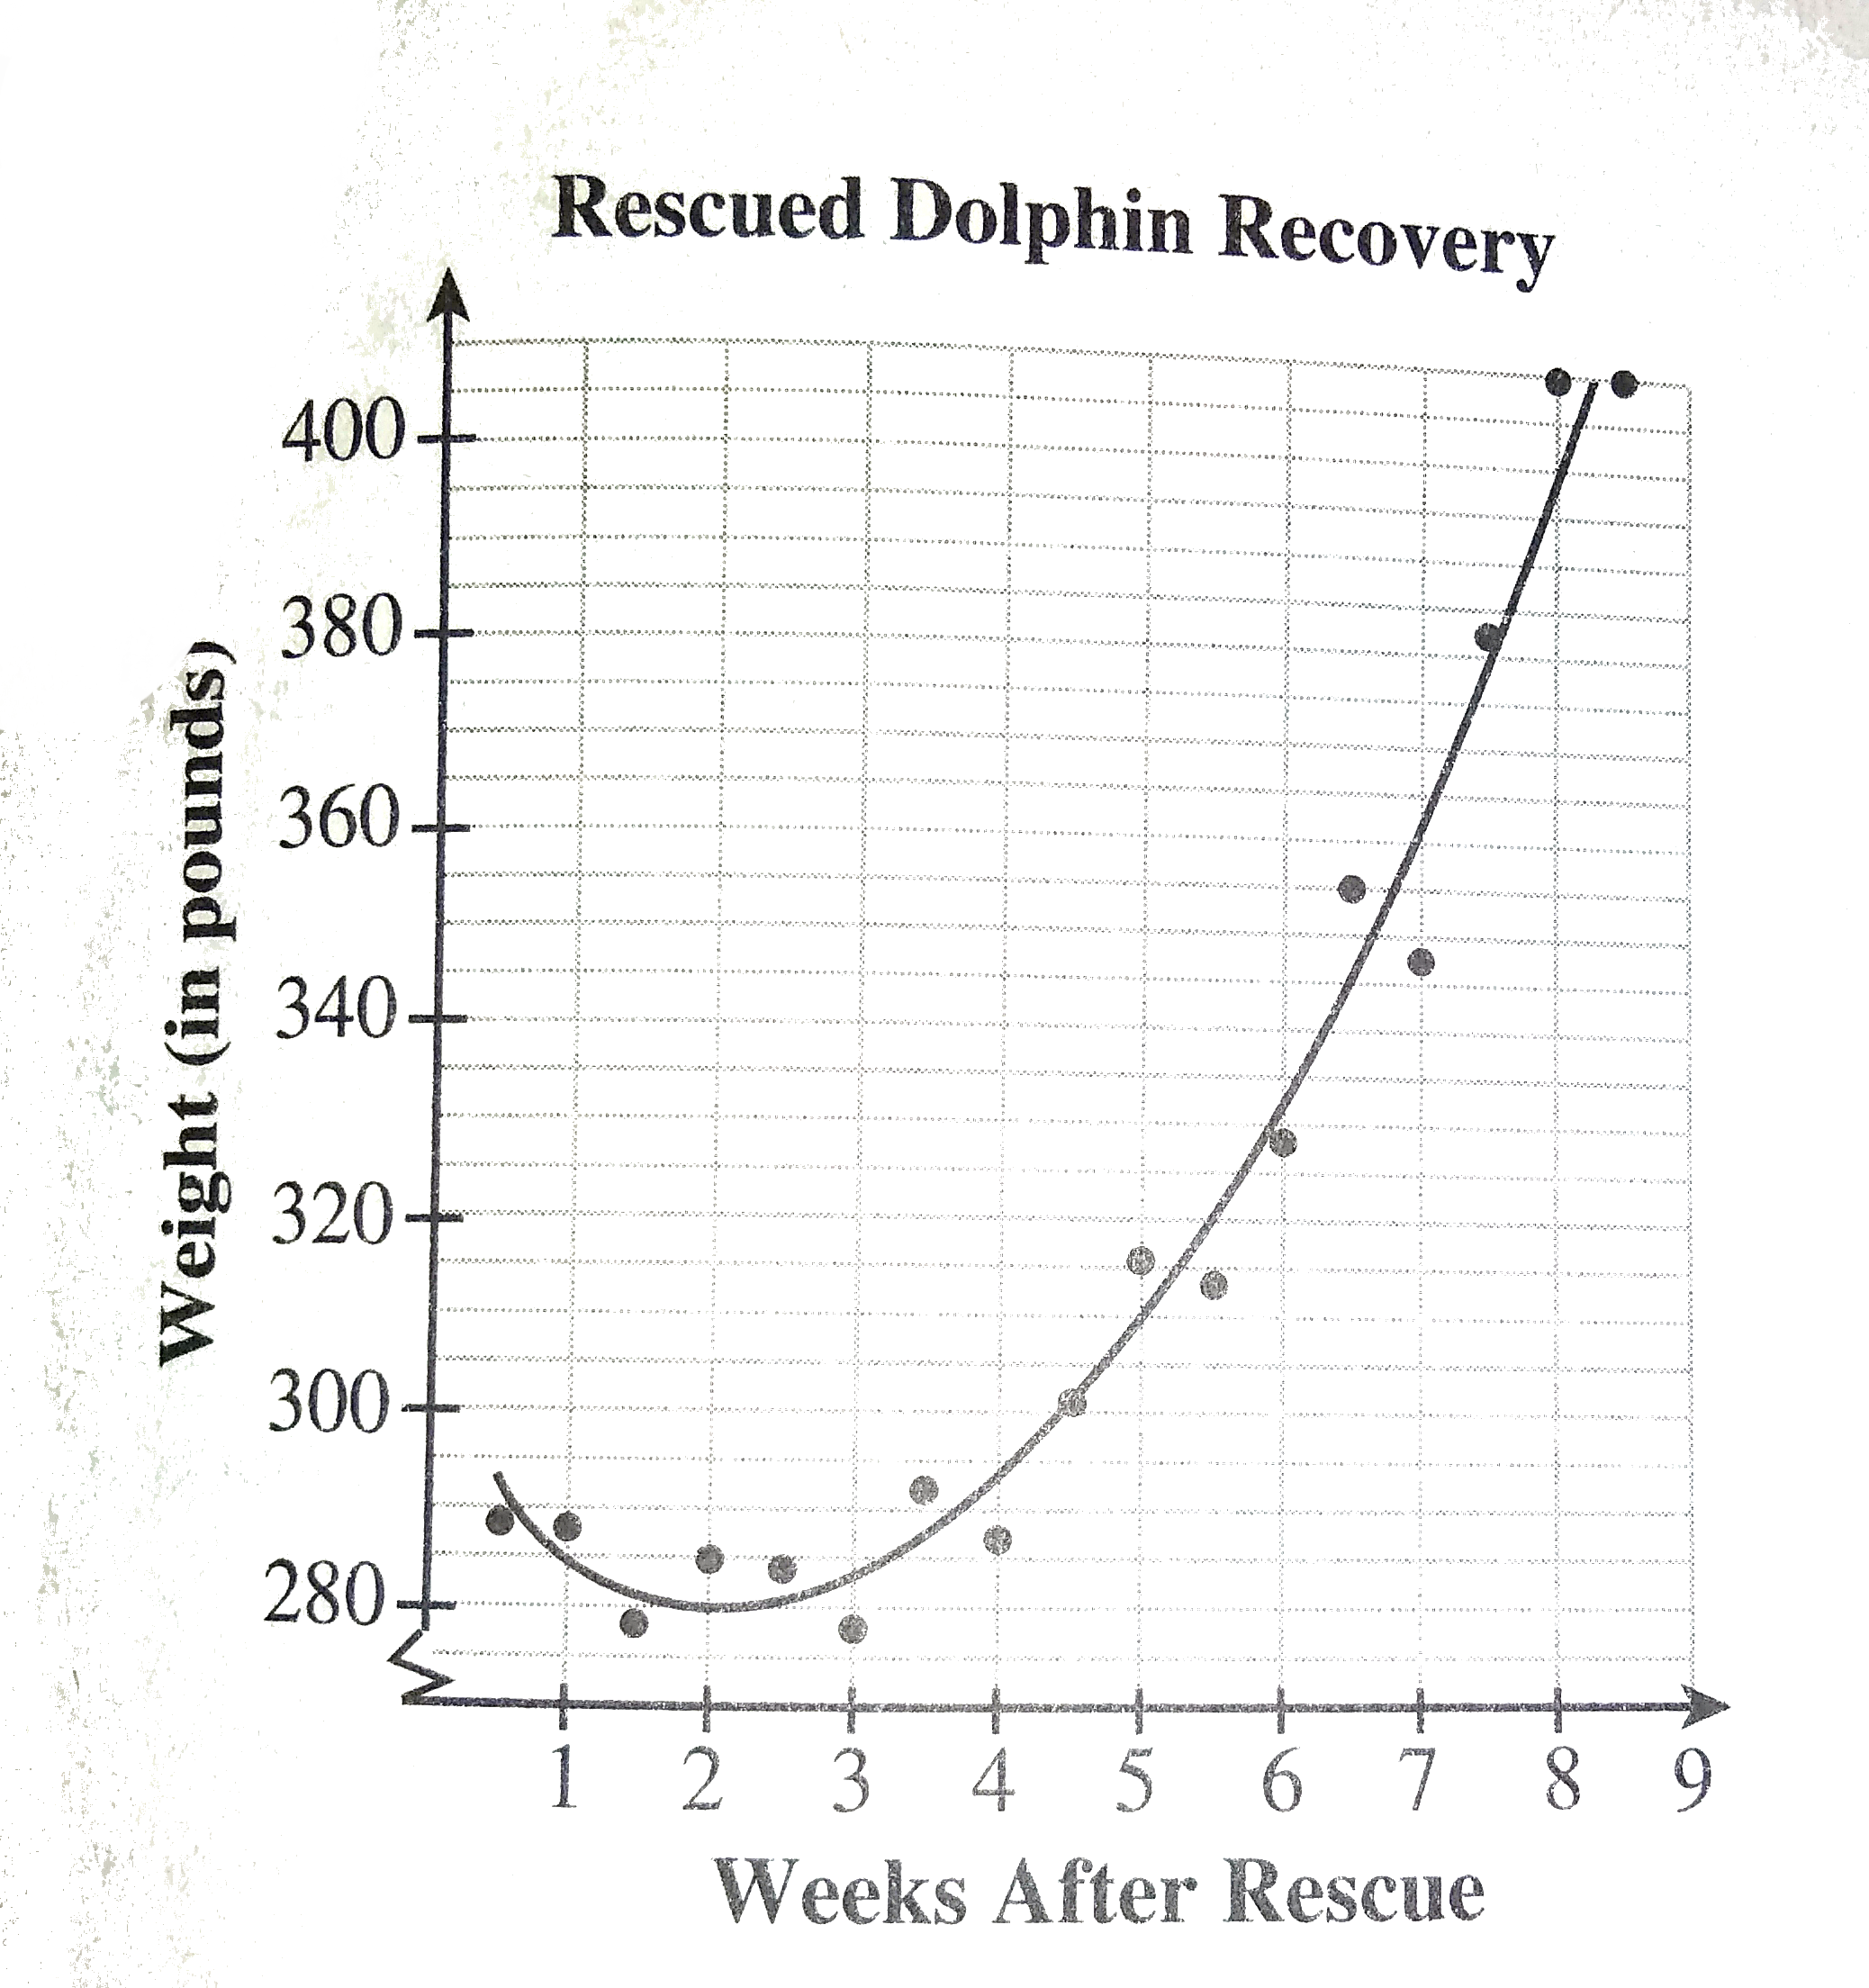
Following the catastrophic oil spill in the Gulf of Mexico in April of 2010, more than 900 bottlenose dolphins were found dead or stranard in the oil spill area. The figure above shows the weight of a recued dolphin during its recovery. Based on the quadratic model fit to the data shown, which of the following is the closest to the average rate of change in the dolphin's weight between week 2 and week 8 of its recovery?
View SolutionA new car costs Rs 360000. Its price depreciates at the rate of 10% a year during the first two years and at the rate of 20% a year thereafter. What will be the price of the car after 3 years?
View SolutionA tree grows at a rate of 0.5 m/yr . What will be the height of a board fixed at 1.5 m above the base, five years ago
View SolutionJack is putting together gift boxes at a rate of 3 per hour in the first hour. Then jill comes over and yells, ''Work faster!'' jack, now nervous, works at the rate of only 2 gift boxes per hour for the next 2 hours. Then Alexandra comes to Jack and whispers. ''The steadiest hand is capable of the divine. Jack, calmer, then puts together 5 gift boxes in the fourth hour. What is the average rate at which Jack puts together gift boxes over the entire period?
View Solution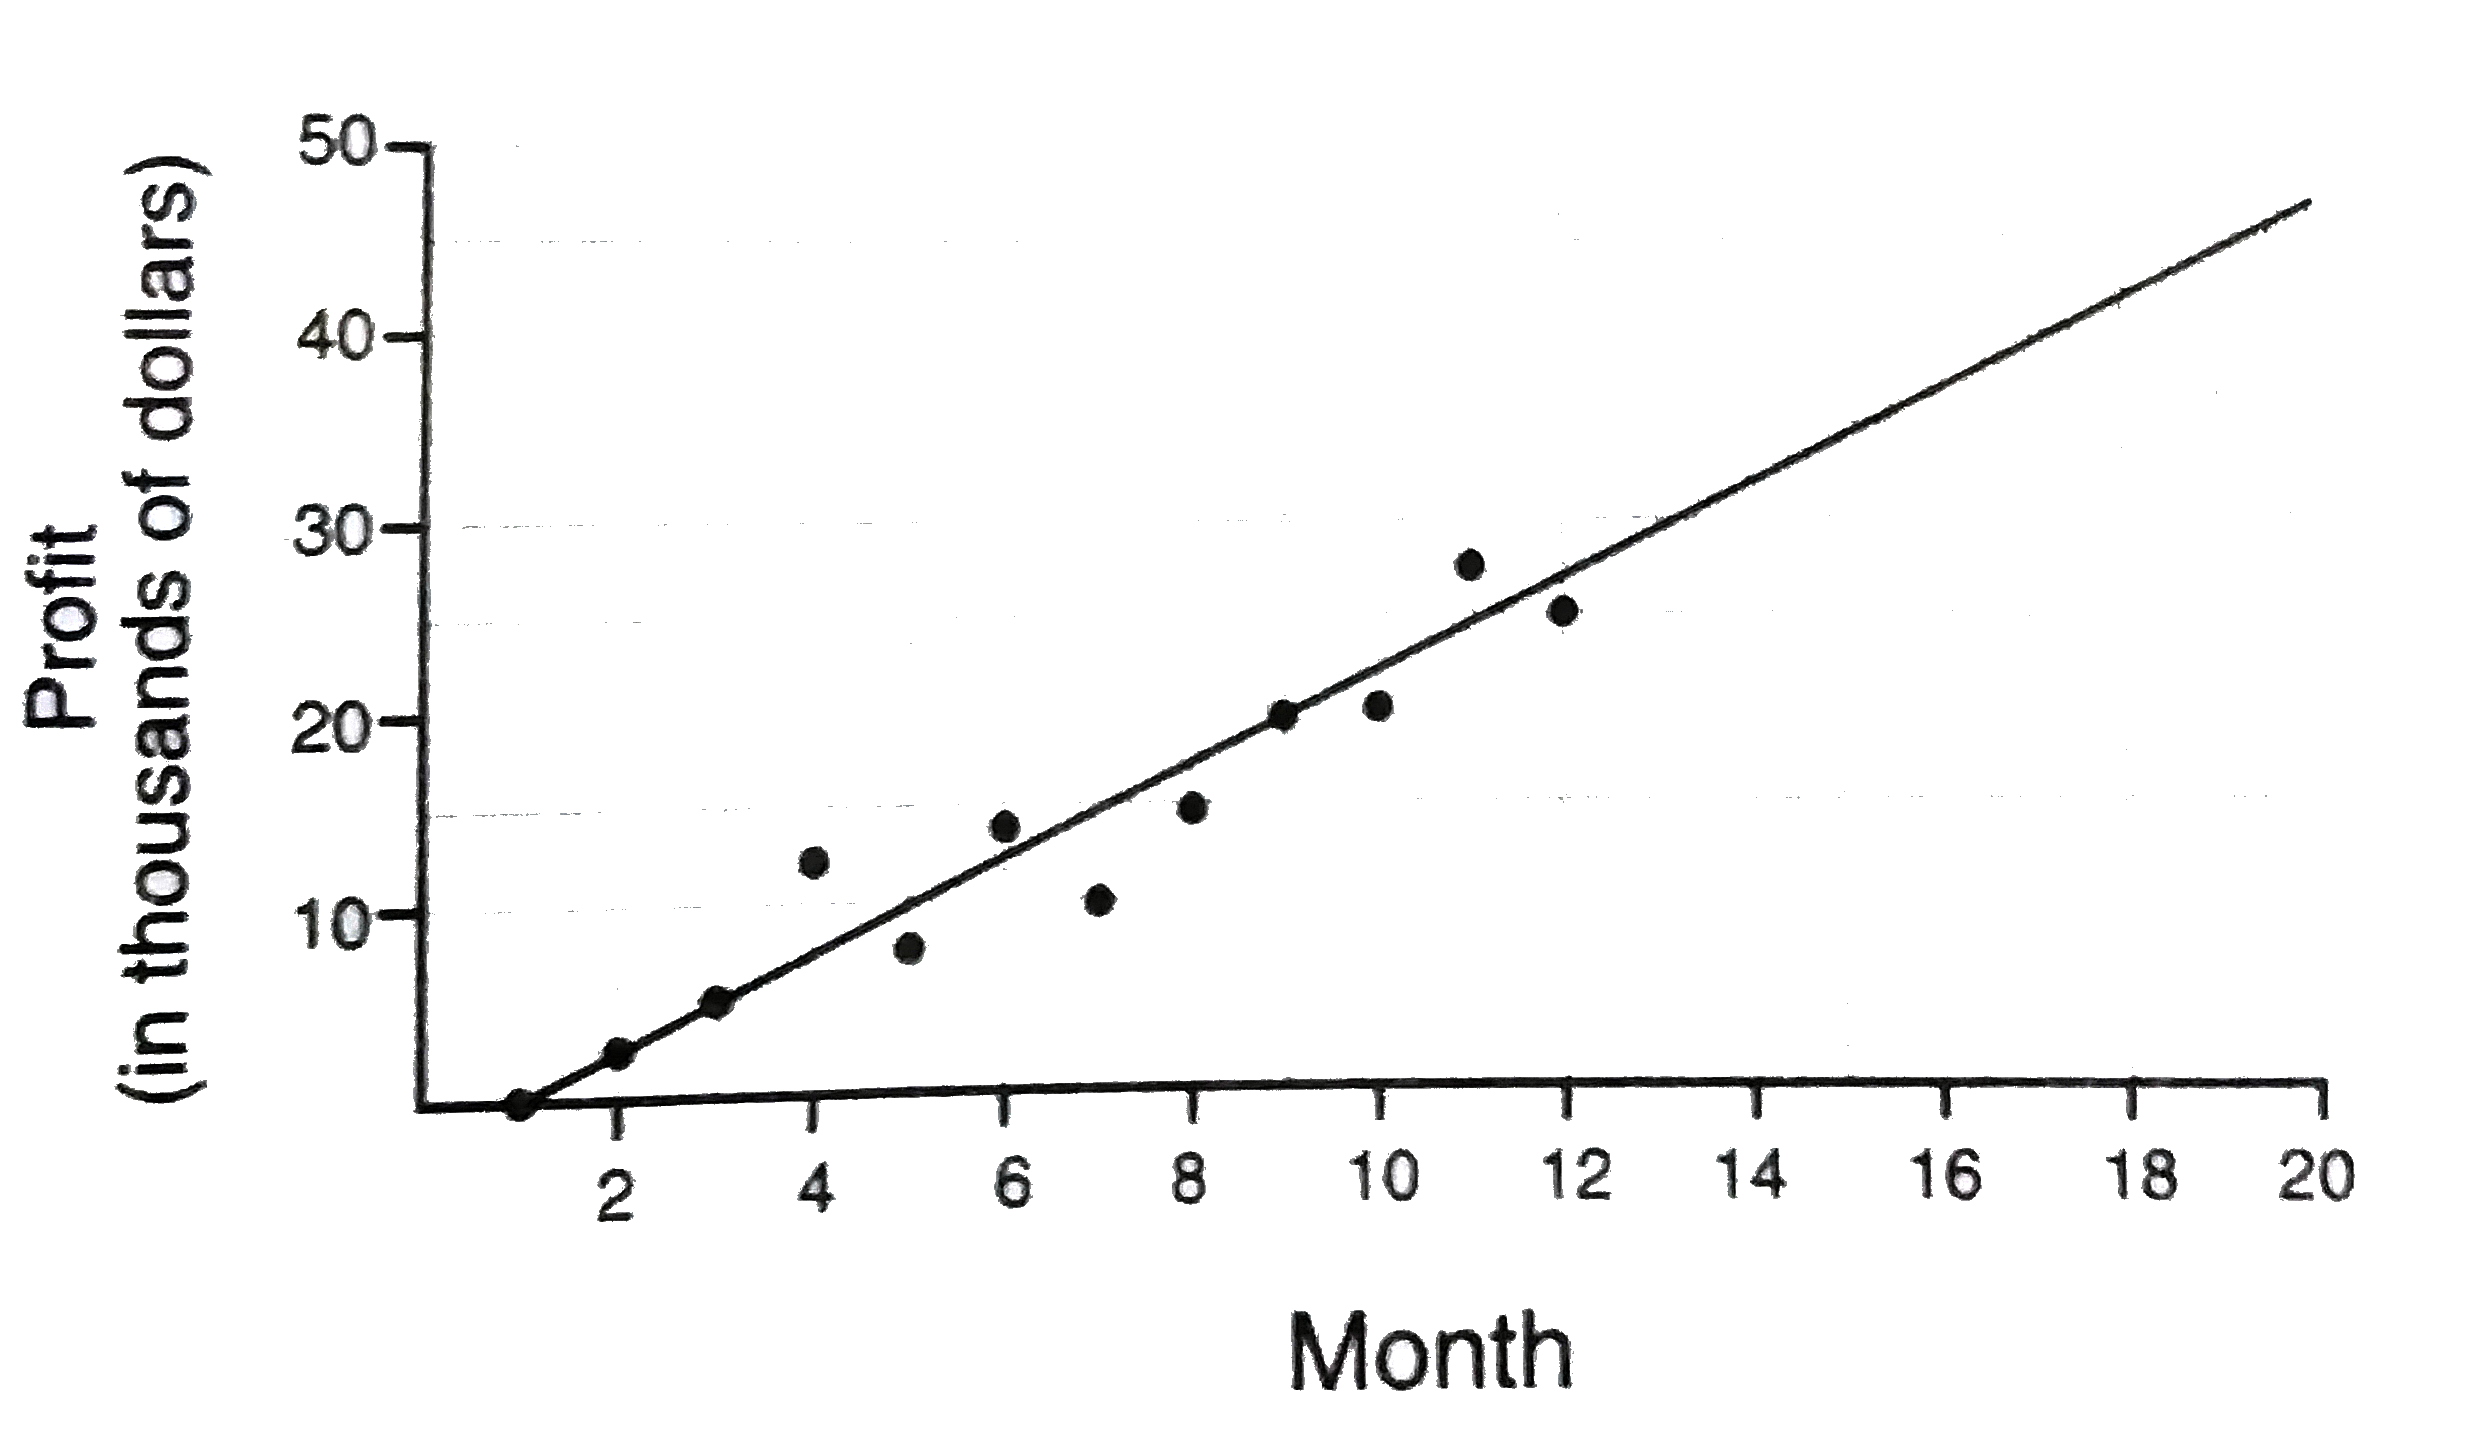
The scatterplot above shows the profit, by month, for a new company for the first year of operation. A line of best fit is also shown. Using this line, by what dollar amount did the profit in the 8th month exceed the profit in the 13th month?
View Solution
