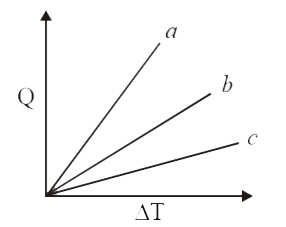
Figure shows the variation in temperature (DT) with the amount of heat supplied (Q) in an isobaric process corresponding to a monoatomic (M), diatomic (D) and a polyatomic (P) gas. The initial state of all the gases are the same and the scales for the two axes coincide. Ignoring vibrational degrees of freedom, the lines a, b and c respectively correspond to
P.MandD
M,DandP
P,D and M
D,M and P
Step by step video & image solution for Figure shows the variation in temperature (DT) with the amount of heat supplied (Q) in an isobaric process corresponding to a monoatomic (M), diatomic (D) and a polyatomic (P) gas. The initial state of all the gases are the same and the scales for the two axes coincide. Ignoring vibrational degrees of freedom, the lines a, b and c respectively correspond to by Physics experts to help you in doubts & scoring excellent marks in Class 11 exams.
Topper's Solved these Questions
Similar Questions
The straight lines in the figure depict the variations in temperature ΔT as a function of the amount of heat supplied Q is different process involving the change of state of a monoatomic and a diatomic ideal gas . The initial states, (P,V,T) of the two gases are the same . Match the processes as described, with the straight lines in the graph as numbered.
_E01_155_Q01.png)
Column-IColumn-II(A)Isobaric process of monoatomic gas.(p)1(B)Isobaric process of diatomic gas(q)2(C)Isochoric process of monoatomic gas(r)Minimum at section B(D)Isochoric process of diatomic gas(s)x-axis (i.e.'Q' axis)View SolutionThe amount of heat supplied to an ideal gas is laid off on the horizontal axis and the amount of work performed by the g-as is laid off on the vertical axis. One of the straight lines in the ligure is an isotherm and the other two are isobars of two gases. The initial states of hoth gases (pressure, temperature, volume) are the same, and the scales on the two axes coincide. Which straight line corresponds to which process? How many degrees of freedom does each gas have? (Vibrational degrees of freedom are not to be taken into account.) The graphs of what processes coincide with the coordinate axes?
View Solution
Knowledge Check
- Question 1 - Select One
Figure shows an isochore, an isotherm, an adiabatic and two isobars of two gases on a work done versus heat supplied curve. The initial states of both gases are the same and the scales for the two axes are same.
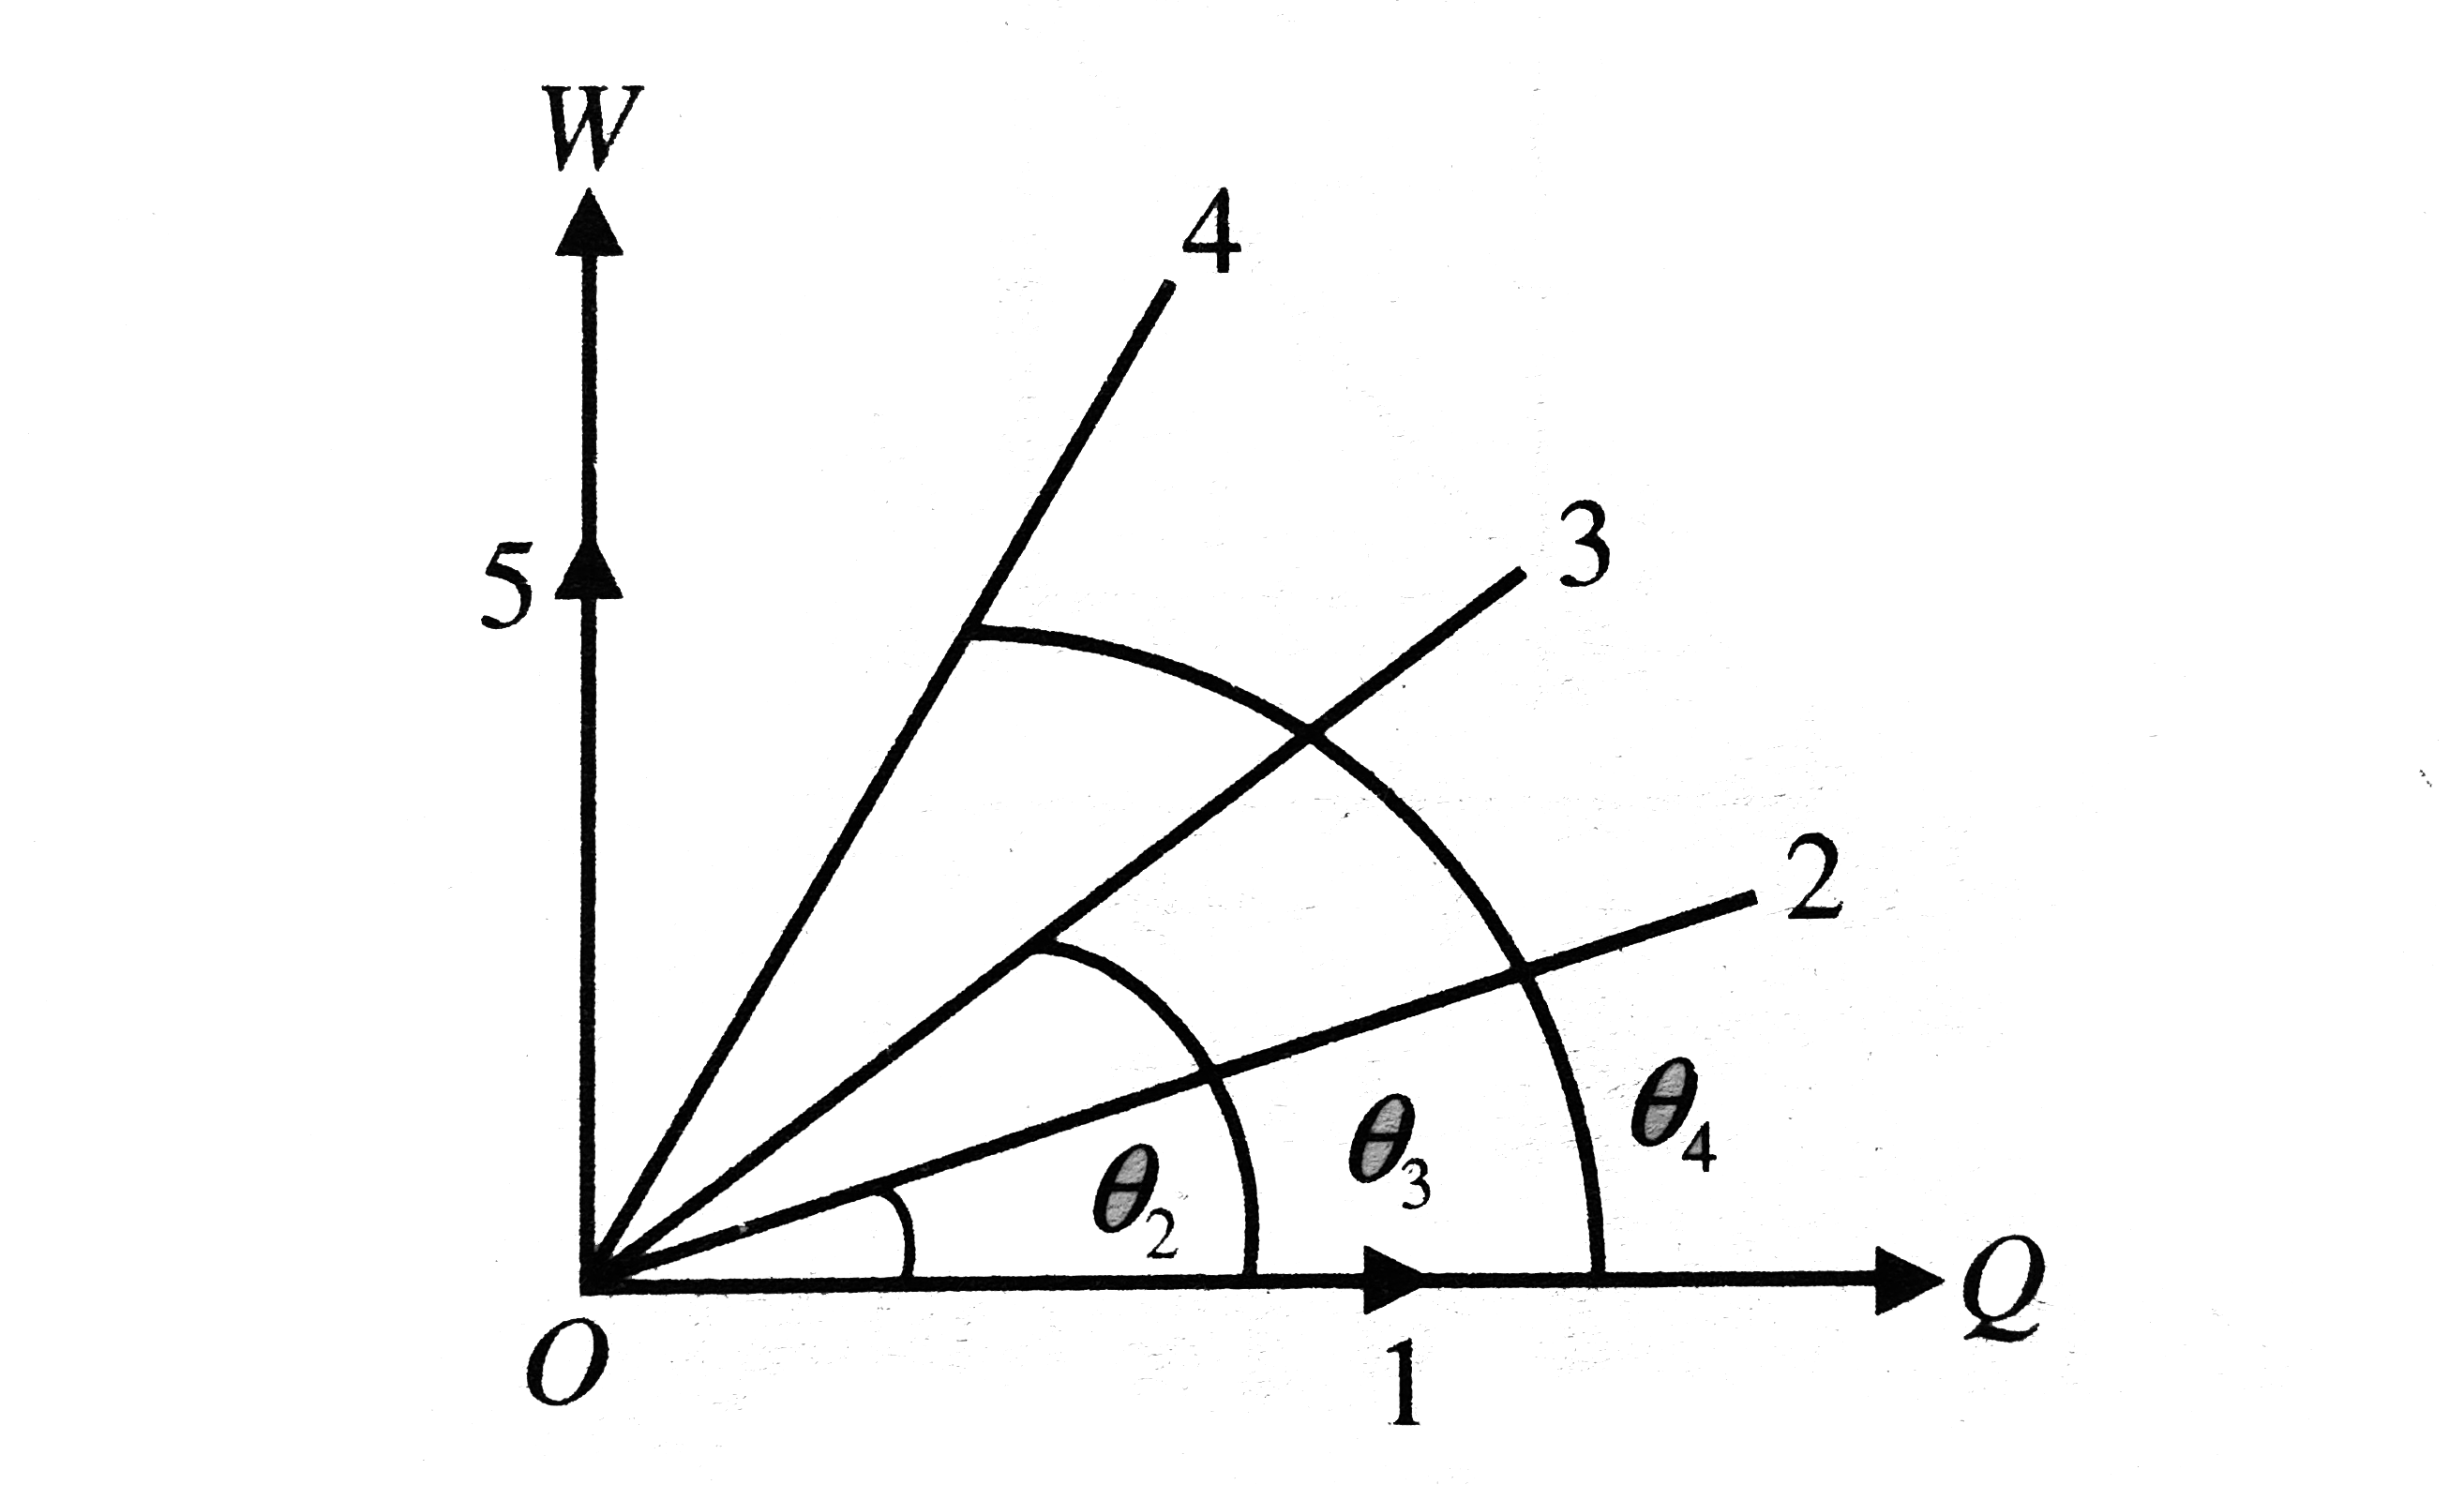 AStraight line 1 corresponds to an isochoric process.BStraight line 2 corresponds to an isobaric process for diatomic gas.CStraight line 4 corresponds to an isothermal process.DStraight line 5 corresponds to an isothermal process.
 - Question 2 - Select One
Figure shows a long cylindrical container with ideal gas in two chambers. Lower chamber is filled with one mole of a mono atomic gas, while upper chamber has one mole of a diatomic gas. The gases initially are at temperature 300K, the container walls as well as pistons are conducting. Both the pistons are identical with mass 'M' and area 'A' such that MgA=P0 (atmosphere pressure).
Assuming the ideal gas constant to be R, answer the following questions:

Total work done by the ideal gases in this process isA300Rln(3)B300Rln(95)CzeroD300Rln(2) - Question 3 - Select One
Figure shows a long cylindrical container with ideal gas in two chambers. Lower chamber is filled with one mole of a mono atomic gas, while upper chamber has one mole of a diatomic gas. The gases initially are at temperature 300K, the container walls as well as pistons are conducting. Both the pistons are identical with mass 'M' and area 'A' such that MgA=P0 (atmosphere pressure).
Assuming the ideal gas constant to be R, answer the following questions:

The upper piston is pulled up slowly by 16cm and held there. the displacement of the lower piston till it reaches new equilibrium state is:A2cmB4cmC8cmD12cm
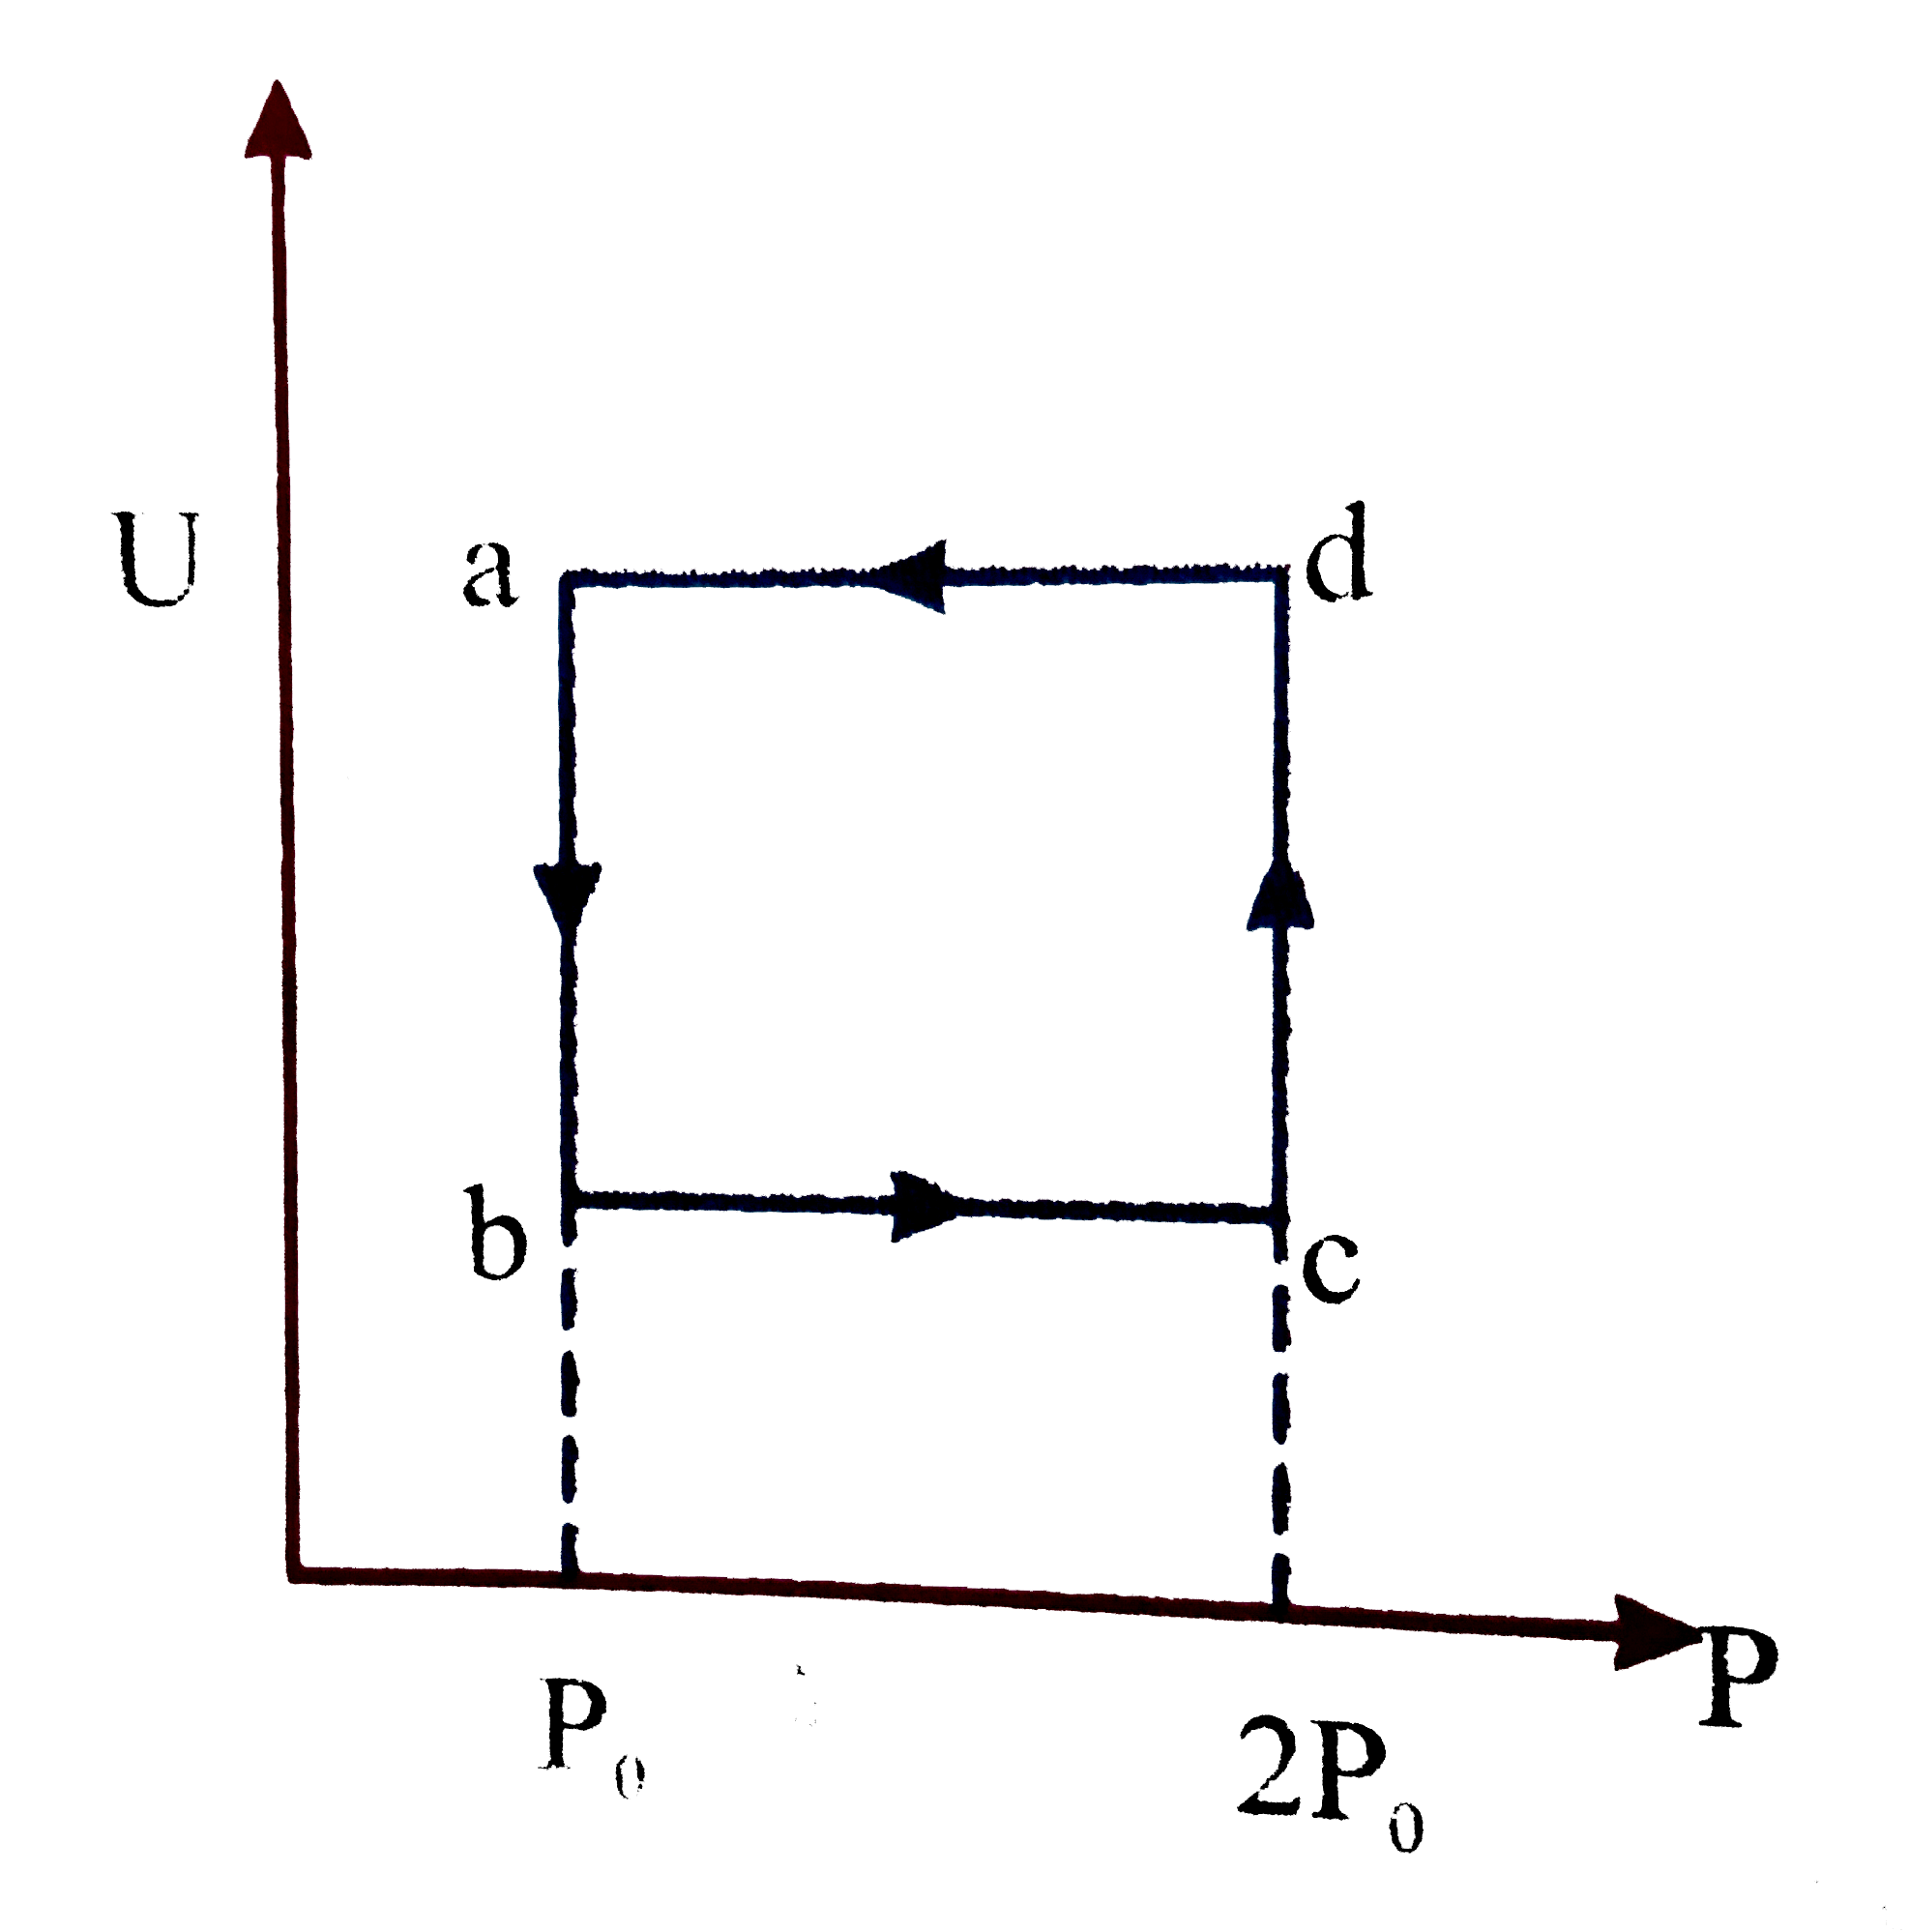
Figure shows the variation of internal energy (U) with the pressure (P) of 2.0 mole gas in cyclic process abcda.The temperature of gas at c and d are 300and500K respectively. The heat absorbed by the gas during the process is X×10Rln2 . Find the value of x.
 View Solution
Two moles a monatomic gas in state A having critical pressure P0 and temperature 3T0 is taken to a state B having pressure 3P0 and temperature T0/3 by the process of equation P2T = constant. Then state B is taken to state C keeping the volume constant and it comes back to initial state A keeping temperature constant.
a. Plot a P and T graph. (P on the y-axis and T on the x-axis).
Find the net work done and heat supplied to the gas during the complete cycle.View SolutionFigure, shows the variation of potential energy (U) of 2 mol of Argon gas with its density in a cyclic process ABCA. The gas was initiallly in the state A whose pressure and temperature are PA=2atm,TA=300K, respectively. It is also stated the path AB is a rectangular hyperbola and the internal energy of the gas at state C is 3000r. Based on the above information answer the following question :
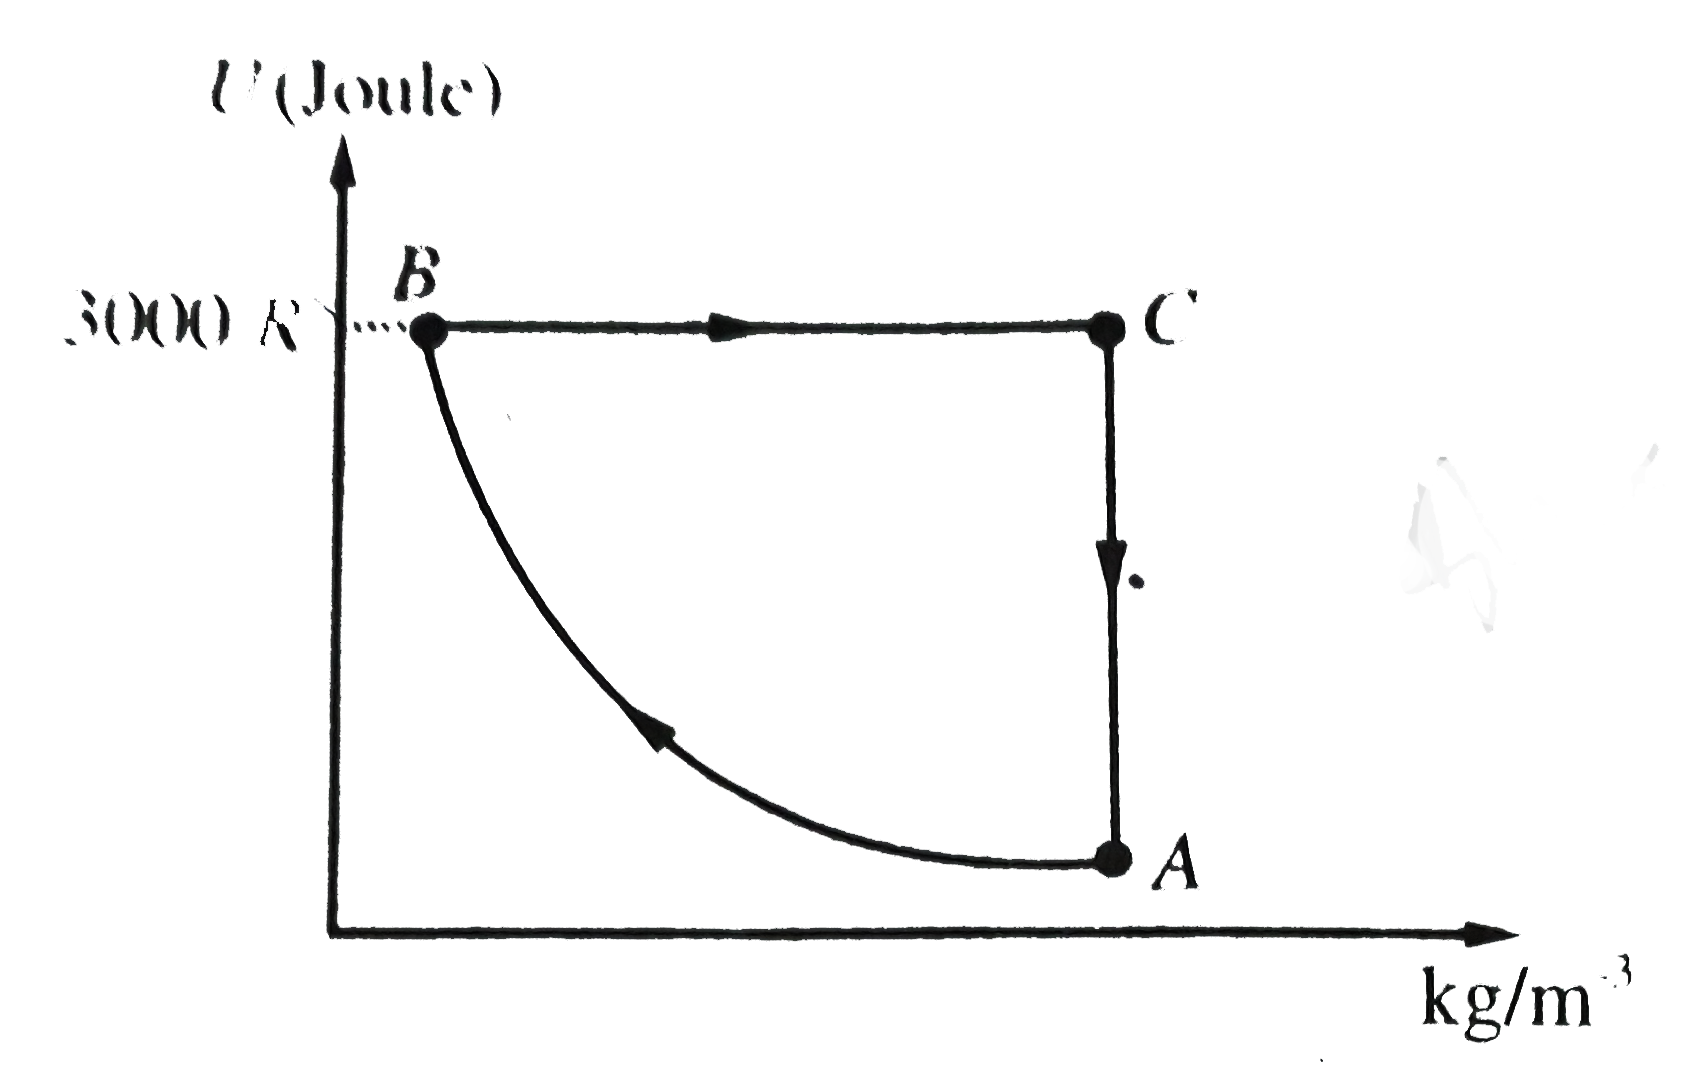
The heat supplied to the gas in the process AB isView SolutionFigure, shows the variation of potential energy (U) of 2 mol of Argon gas with its density in a cyclic process ABCA. The gas was initiallly in the state A whose pressure and temperature are PA=2atm,TA=300K, respectively. It is also stated the path AB is a rectangular hyperbola and the internal energy of the gas at state C is 3000r. Based on the above information answer the following question :
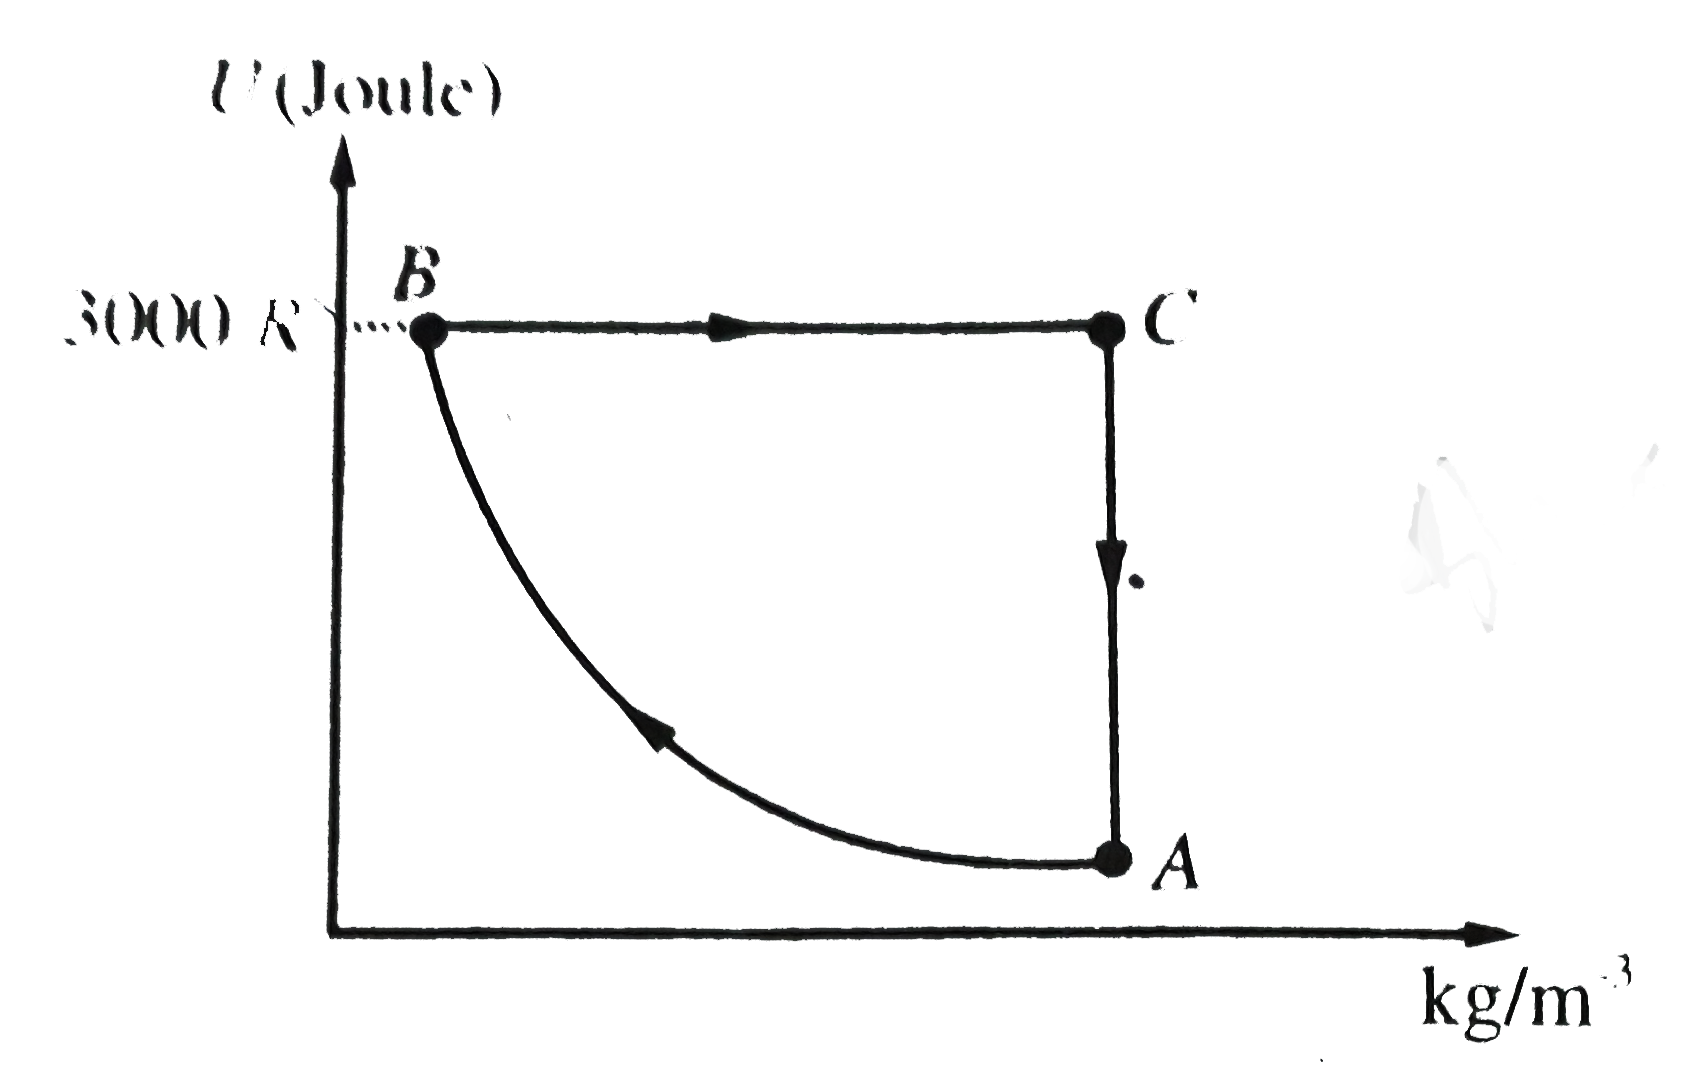
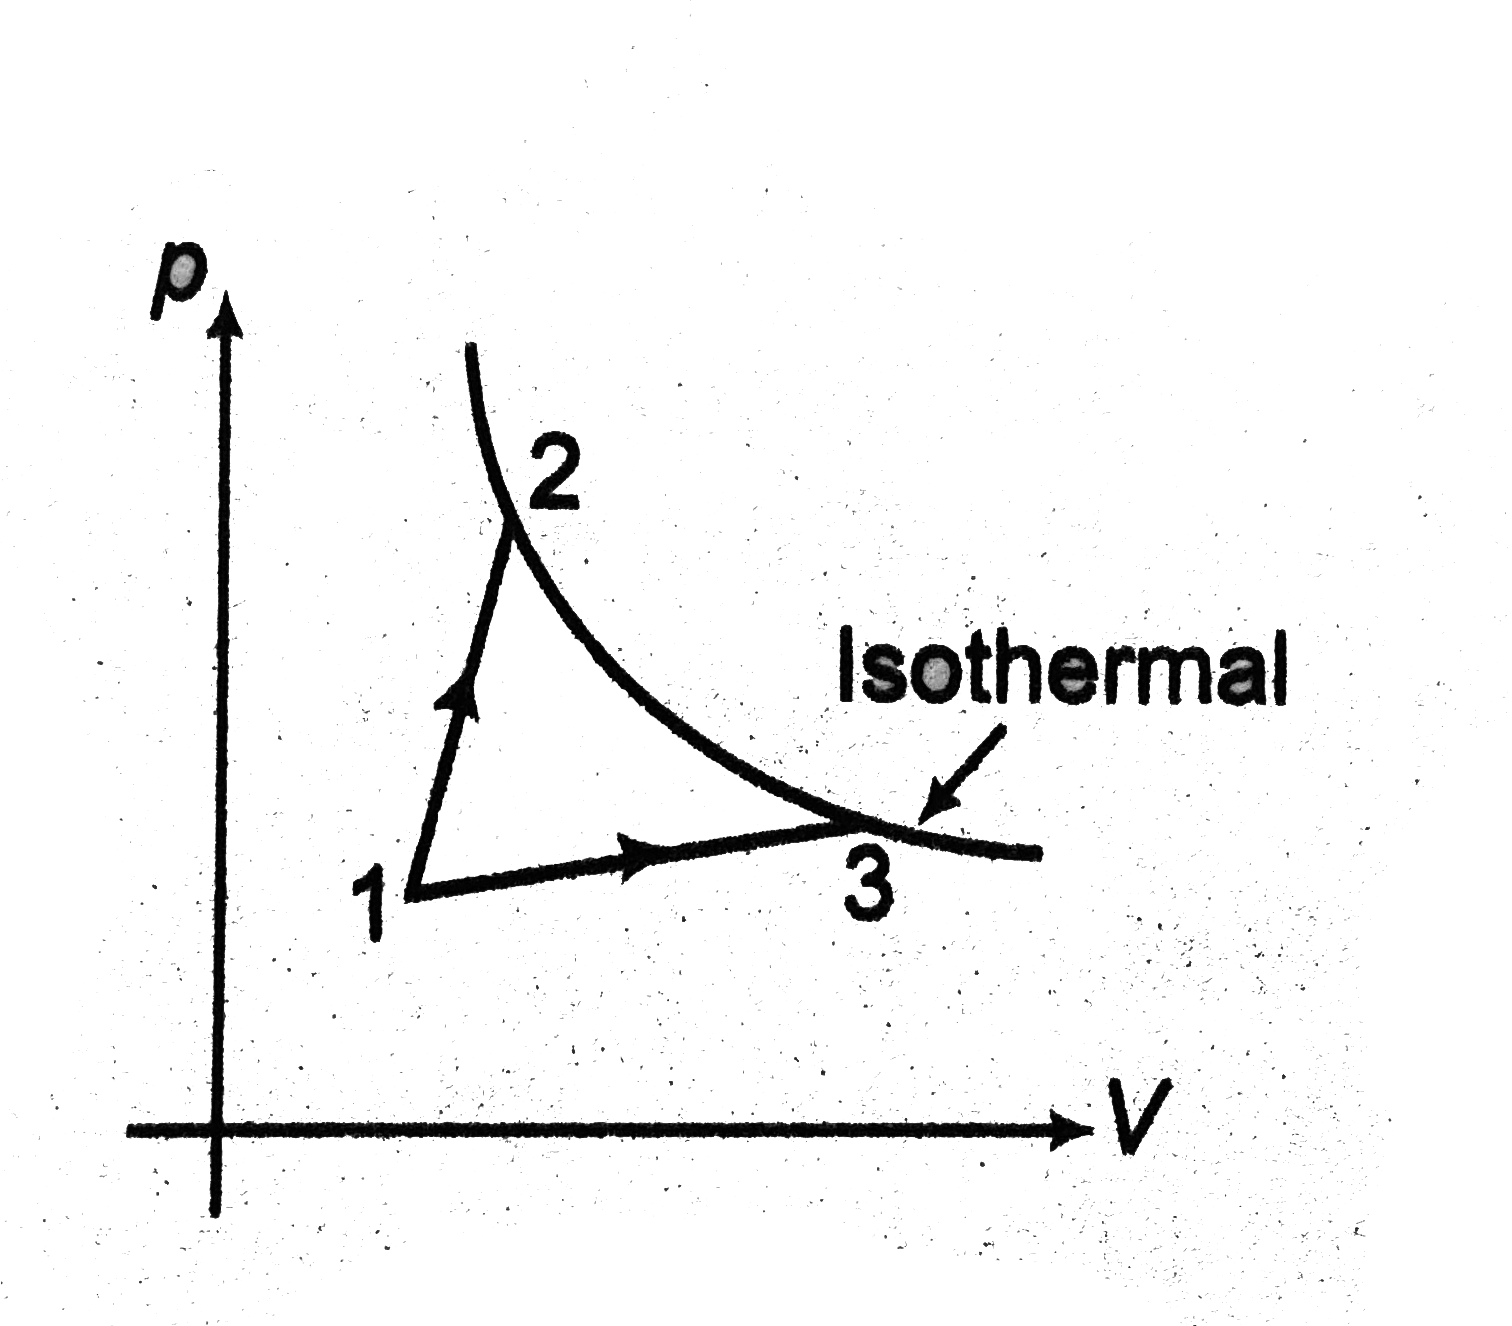
Heat supplied in the process CA isView SolutionA gas takes part in two processes in which it is heated from the same initial state 1 to the same final temperature. The processes are shown on the p-V diagram by the straight lines 1-3 and 1-2. 2 and 3 are the points on the same isothermal curve. Q1 and Q2 are the heat transfer along the two processes. Then,
 View Solution

