a graph between prssure P (along y-axis) and absolute temperature, T(along x-axis) for equal moles of two gases has been drawn . Given that volume of second gas is more than volume of first gas. Which of the following statement is correct?
Slope of gas 1 is less than gas 2
Slope of gas 1 is more than gas 2
Both have some slopes
None of the above
The correct Answer is:B
Step by step video, text & image solution for a graph between prssure P (along y-axis) and absolute temperature, T(along x-axis) for equal moles of two gases has been drawn . Given that volume of second gas is more than volume of first gas. Which of the following statement is correct? by Physics experts to help you in doubts & scoring excellent marks in Class 11 exams.
Topper's Solved these Questions
- BOOK - DC PANDEYCHAPTER - SOLVD PAPERS 2017 NEET, AIIMS & JIPMEREXERCISE - Solved paper 2018(NEET)22videos
SOLVD PAPERS 2017 NEET, AIIMS & JIPMER
- BOOK - DC PANDEYCHAPTER - SOLVD PAPERS 2017 NEET, AIIMS & JIPMEREXERCISE - Solved paper 2018(AIIMS)28videos
SOLVD PAPERS 2017 NEET, AIIMS & JIPMER
- BOOK - DC PANDEYCHAPTER - SOLVD PAPERS 2017 NEET, AIIMS & JIPMEREXERCISE - Solved Papers 2017(AIIMS)26videos
SOLVD PAPERS 2017 NEET, AIIMS & JIPMER
- BOOK - DC PANDEYCHAPTER - SIMPLE HARMONIC MOTIONEXERCISE - Integer type questions14videos
SIMPLE HARMONIC MOTION
- BOOK - DC PANDEYCHAPTER - SOUND WAVESEXERCISE - Exercise 19.74videos
SOUND WAVES
Similar Questions
Knowledge Check
- Question 1 - Select One
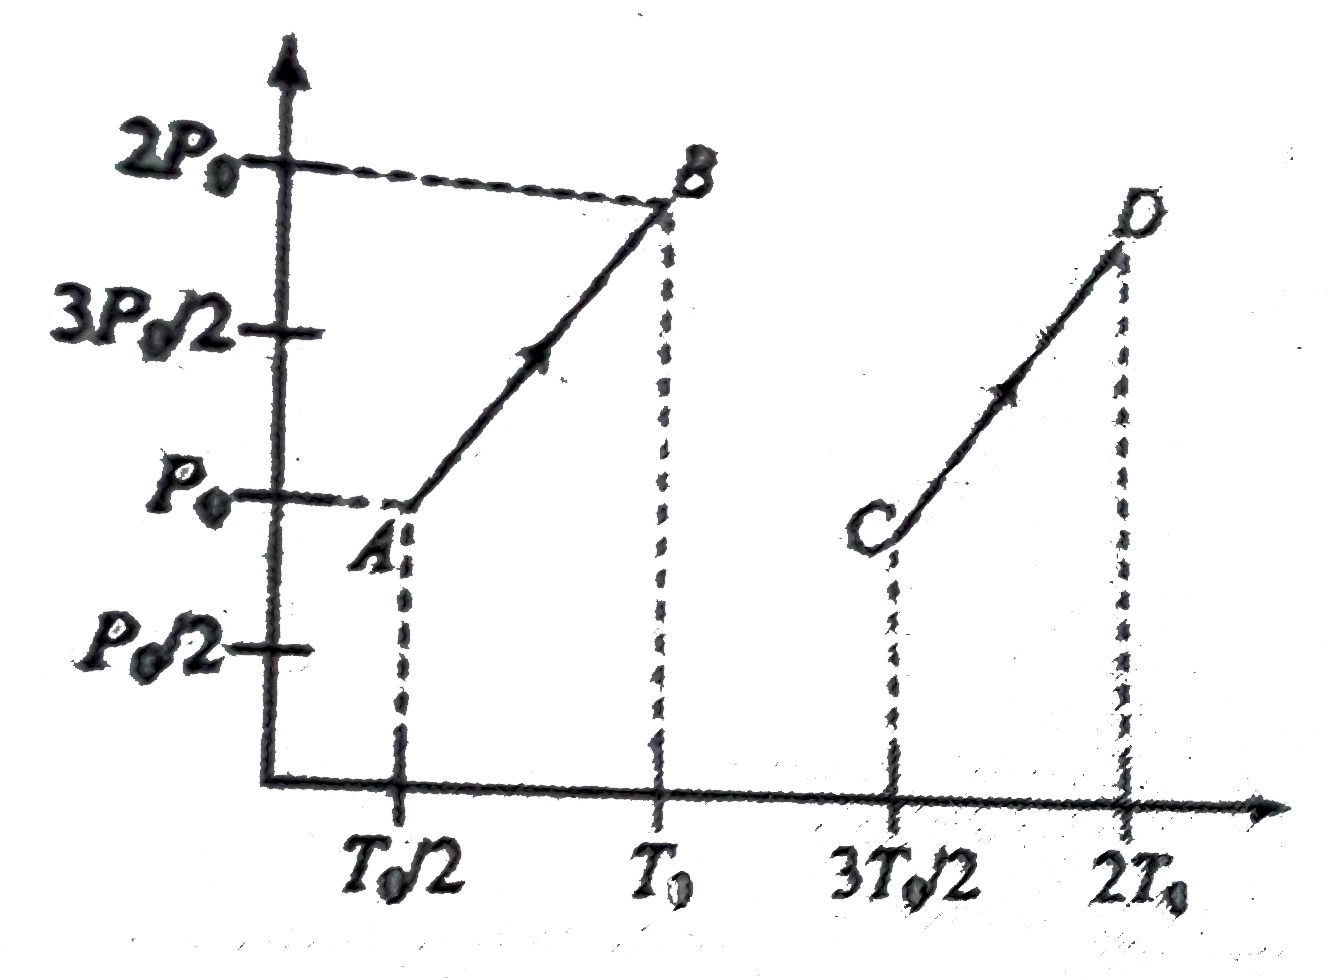
For 1 mole of an ideal gas, a graph of pressure vs volume is plotted as shown. Which of the following option is correct ?
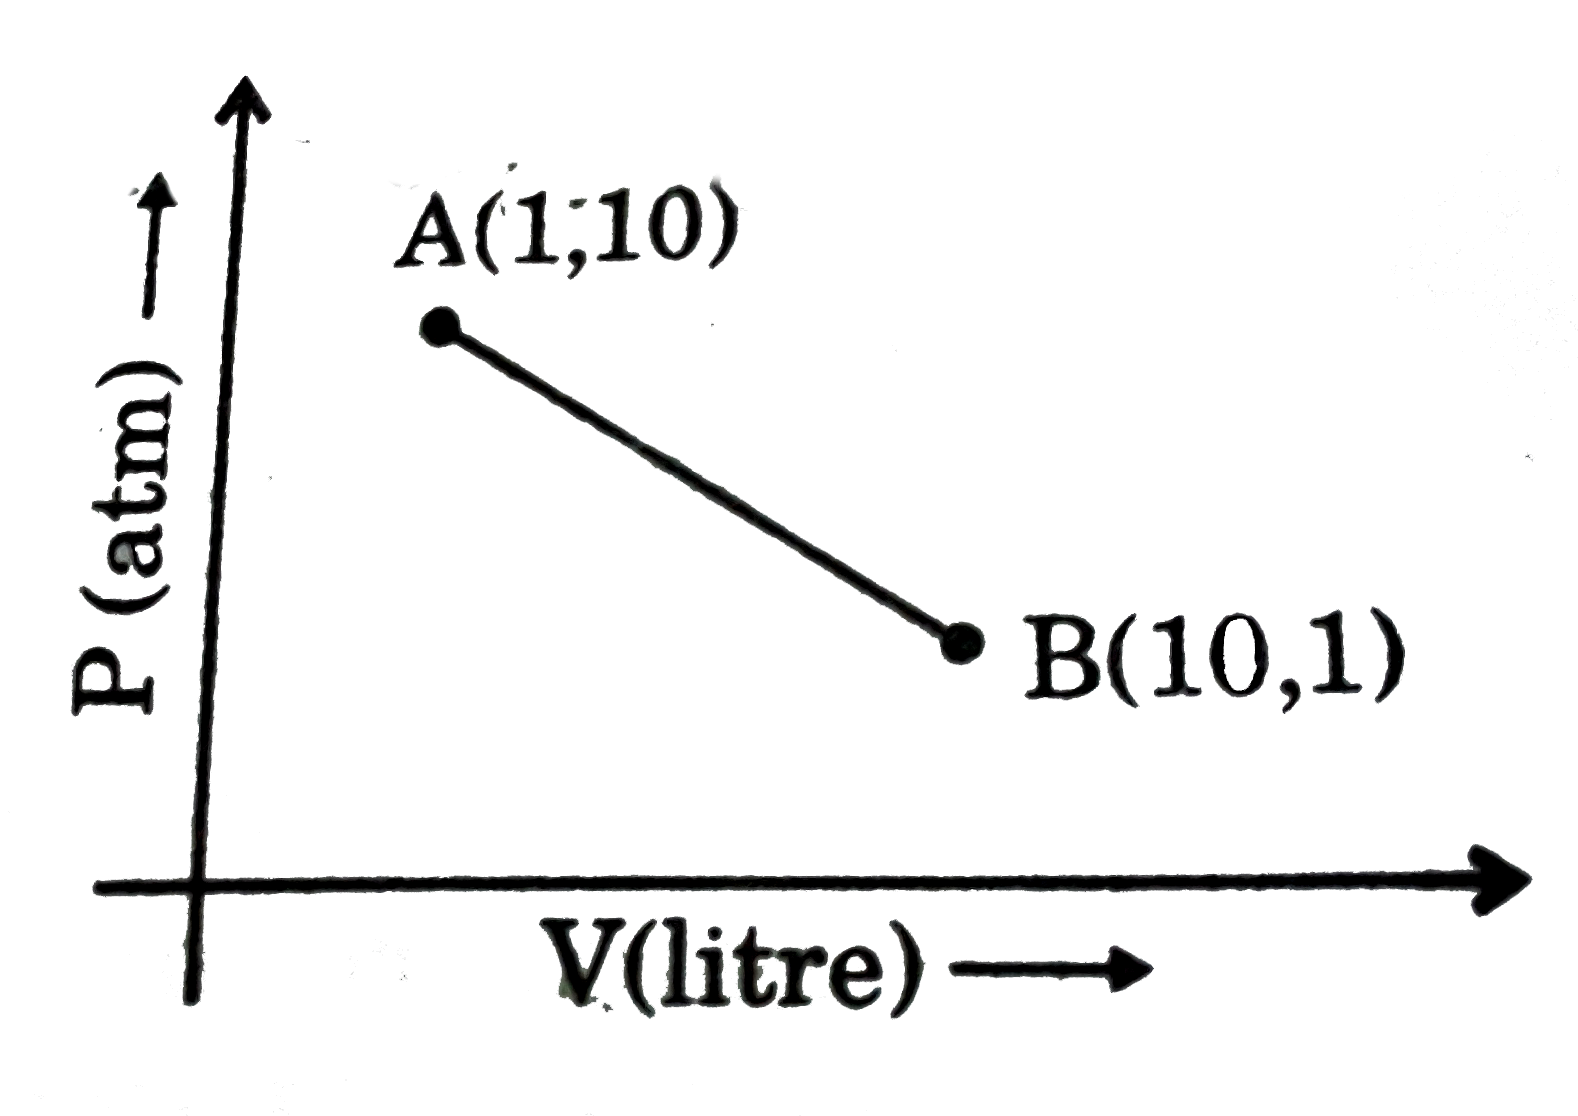 AAB process is isothermal.BMaximum temperature of the gas can be 100.0821K.CMinimum temperature of the gas can be 114×0.0821K.DNone of the above
 - Question 2 - Select One
For 1 mole of an ideal gas, a graph of pressure vs volume is plotted as shown. Which of the following options is correct ?
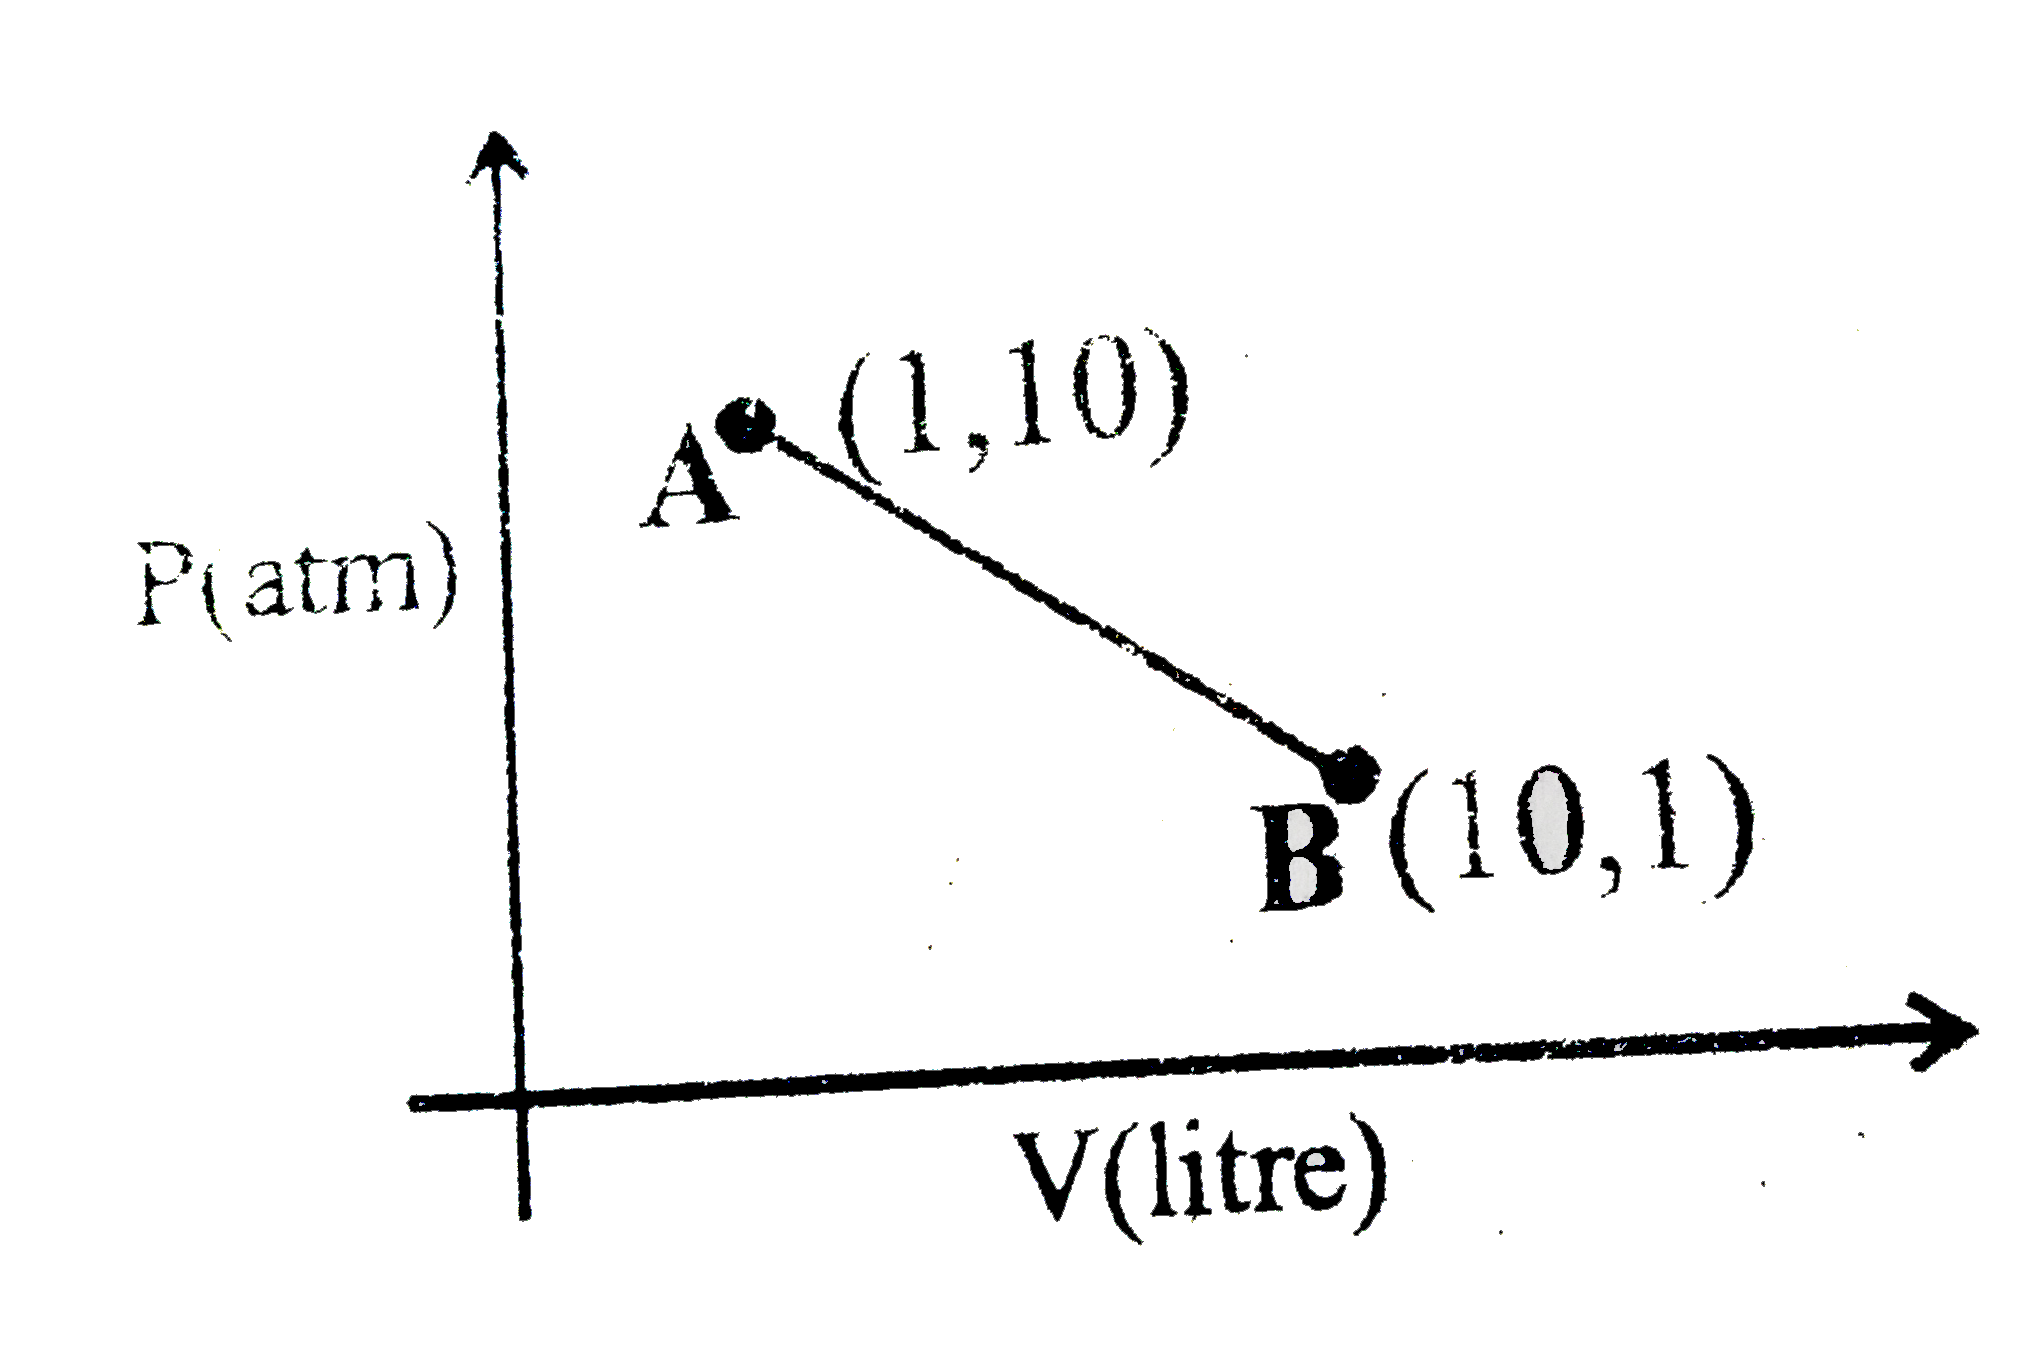 AAB process is isothermalBMaximum temperature of the gas can be 100.0821KCMinimum temperature of the gas can be 114×0.0821KDNone of these
 - Question 3 - Select One
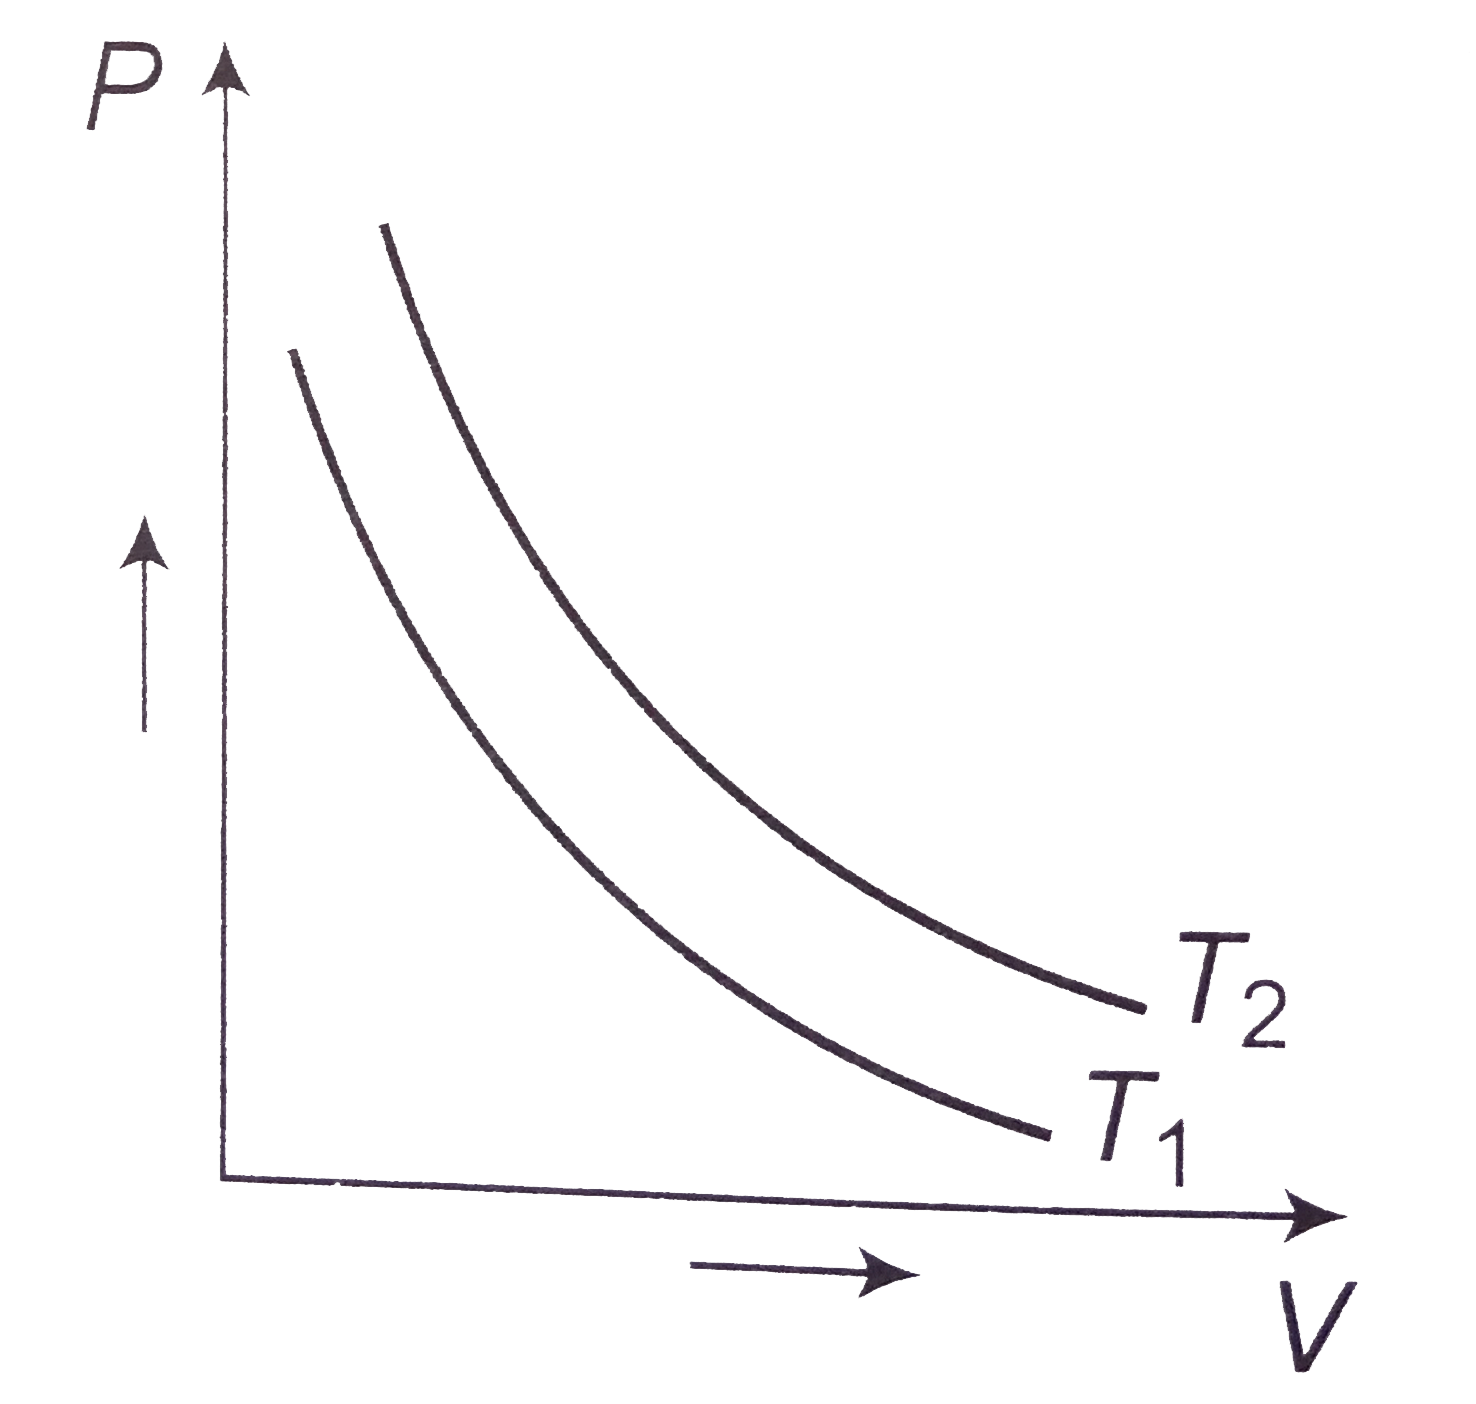
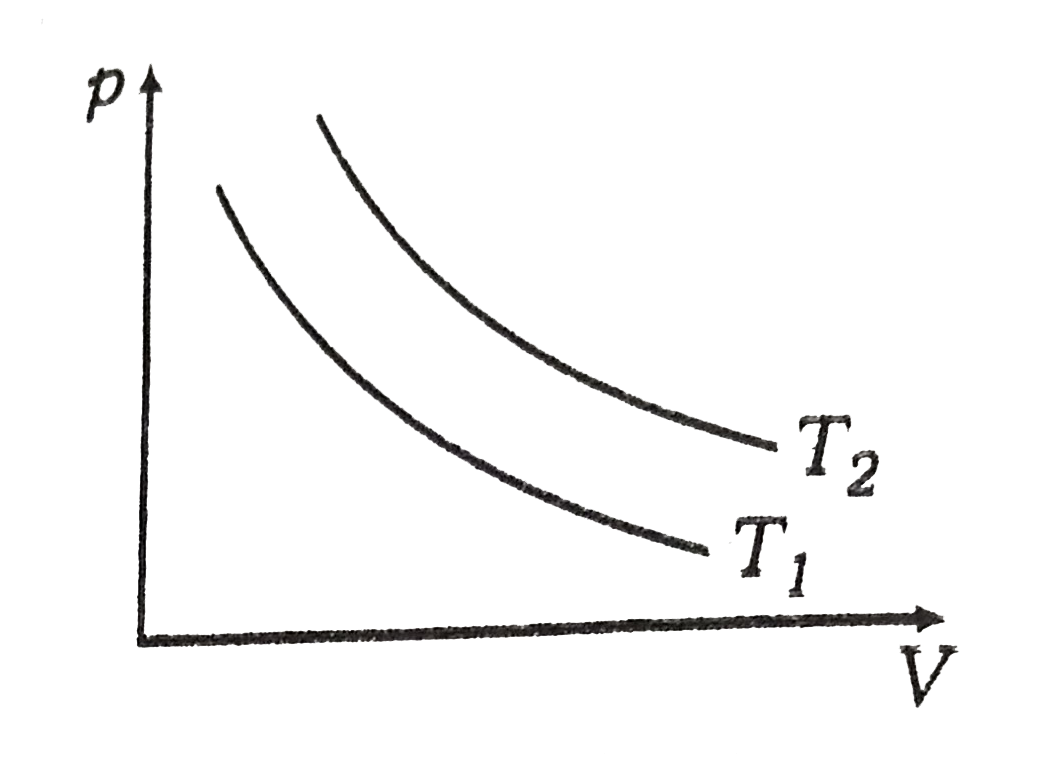
The adjoining figure shows graphs of pressure and volume of a gas at two temperature T1 and T2 Which of the following inferences is correct?AT1>T2BT1=T2CT1<T2Dnone
The graph between pressure P and volume V for a given mass of a gas a fixed temperature T is a ________ .
View SolutionThe ideal gas equation for 1 mol of ideal gas is PV = nRT
graph between P and T at constant volume, i.e. isochores are plotted as under
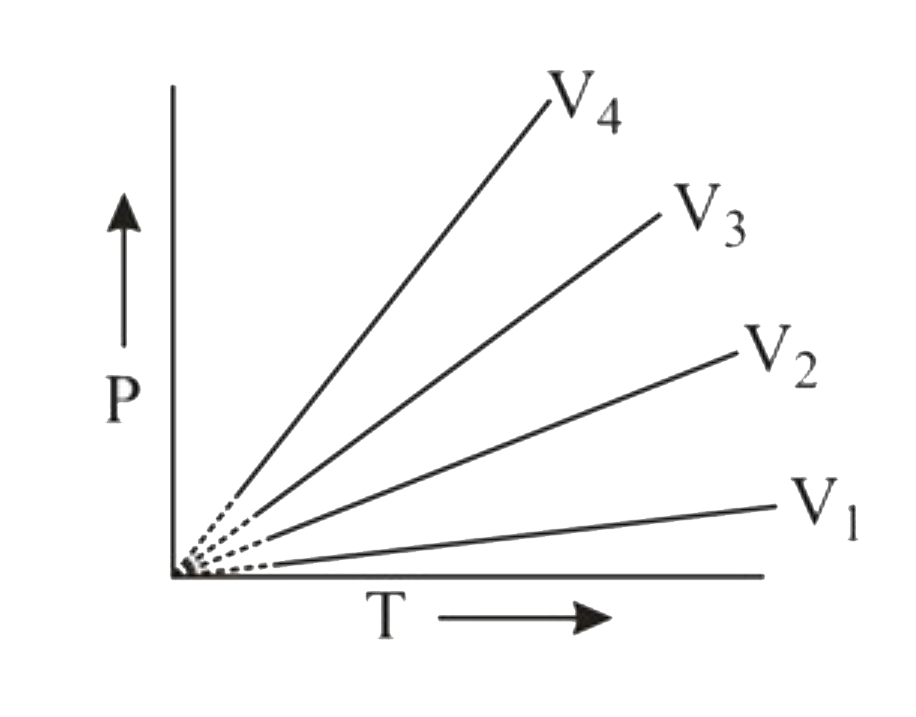
Which of the following order of volume is correct ?View SolutionP-T graph for same number of moles of two ideal gases are shown . Find the path along which volume decreases .
 View Solution
If a cooling curve is drawn taking t(s) along X−axis and temperature (θ) along Y−axis, it appers as
View SolutionThe adjoining fgure shows graph of pressure and volume of a gas at two temperatures T1 and T2 Which one the following is correct
 View Solution

