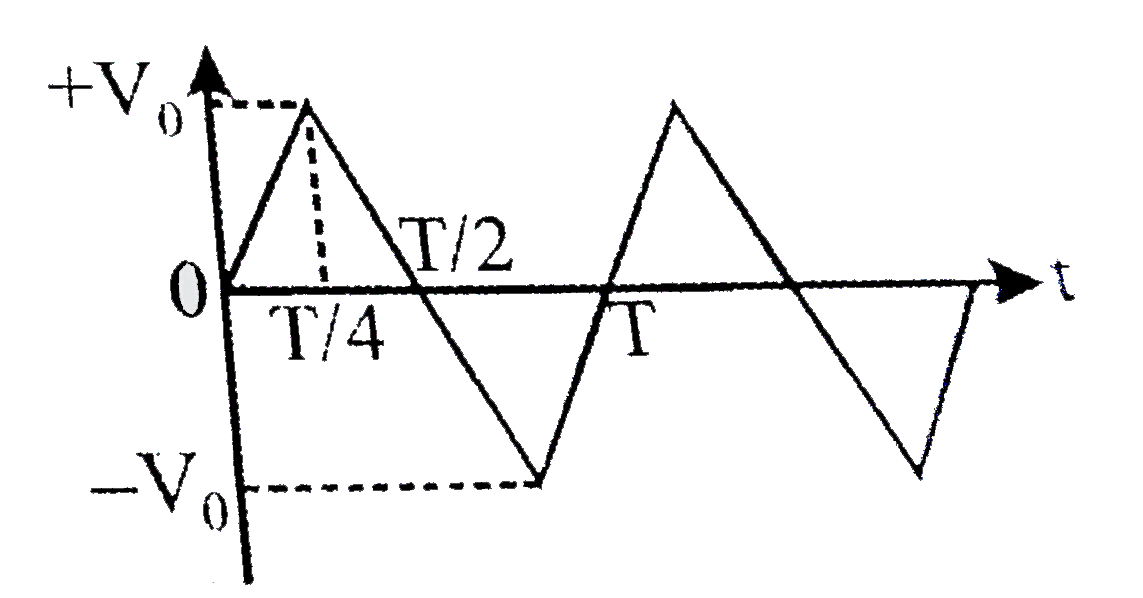
The voltage time (V-t) graph for triangular wave having peak value V0 is as shown in figure.The rms value of V in time interval from t=0 to T/4 is
5
4
7
3
Step by step video & image solution for The voltage time (V-t) graph for triangular wave having peak value V_(0) is as shown in figure.The rms value of V in time interval from t = 0 to T//4 is by Physics experts to help you in doubts & scoring excellent marks in Class 11 exams.
Topper's Solved these Questions
Similar Questions
Knowledge Check
- Question 1 - Select One
The voltage time (V-t) graoh for triangular wave having peak value (V0) is as shown in fig.
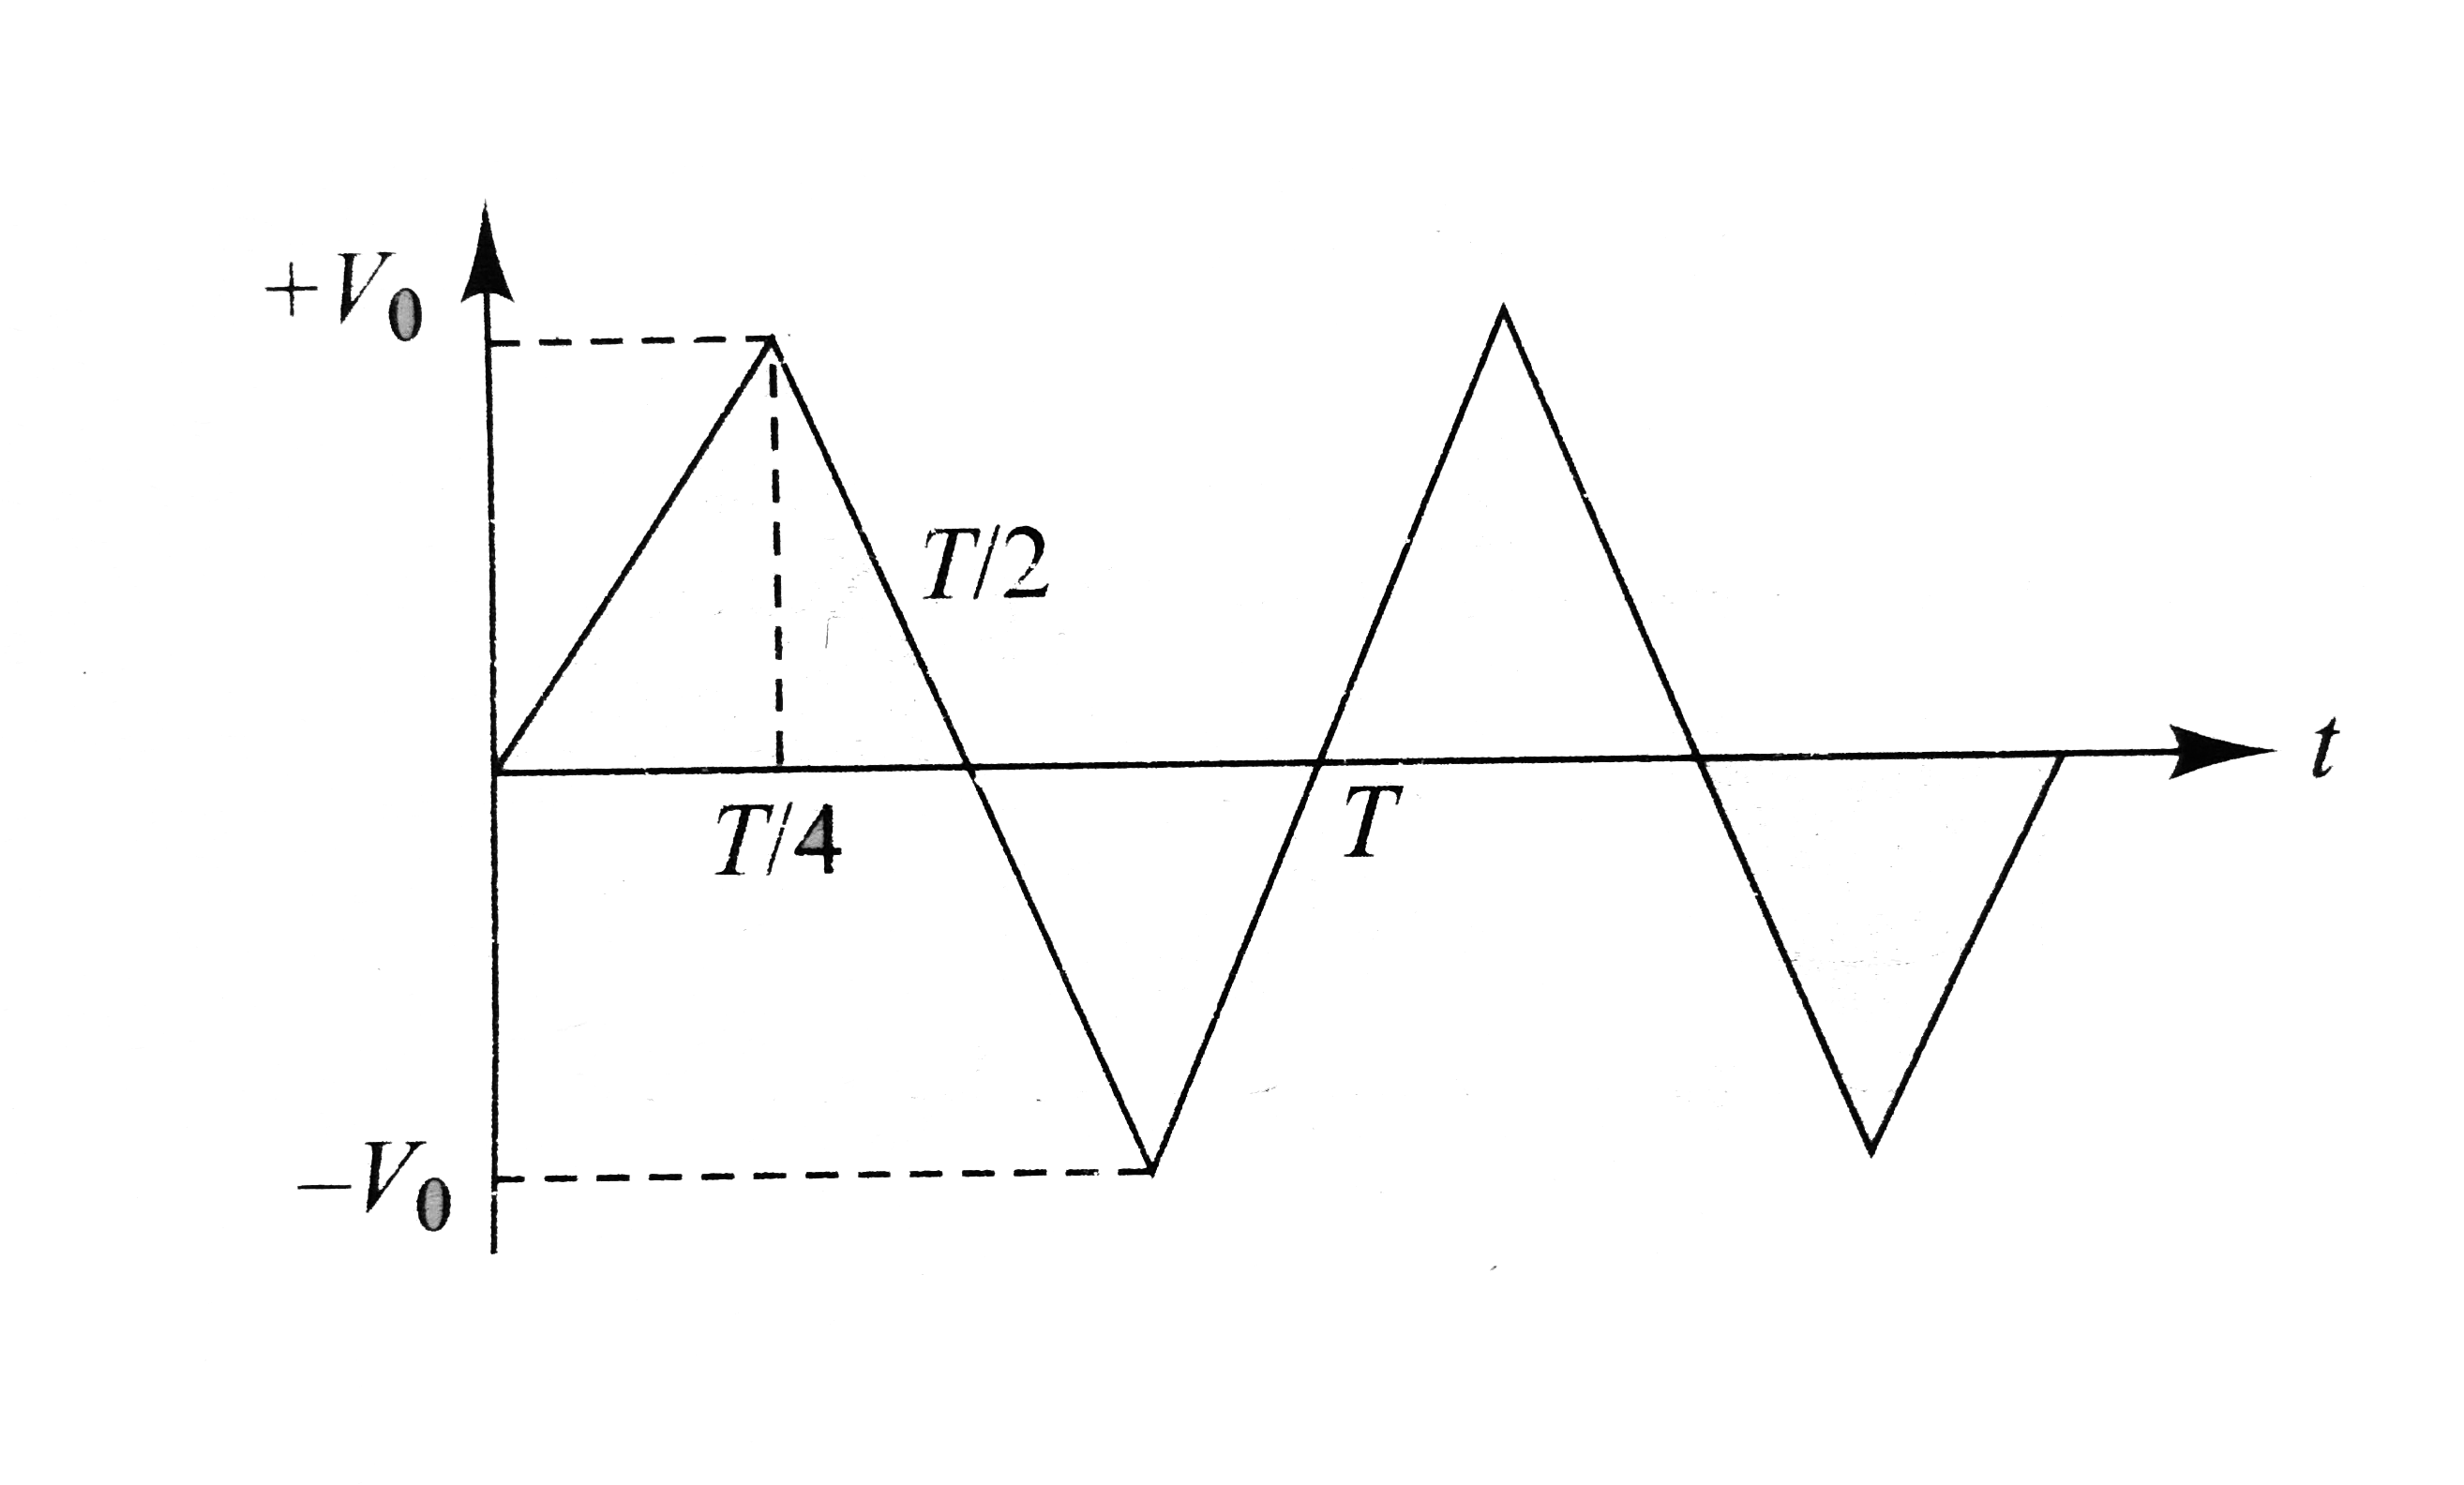 AV0√3BV02CV0√2Dnone of these.
 - Question 2 - Select One
The value ofvx at times t is
Av0+atB(v0)x+aytC(v0)x+axtDNone of the above - Question 3 - Select One
Rms value of the saw-tooth voltage of peak value V0 as shown in-
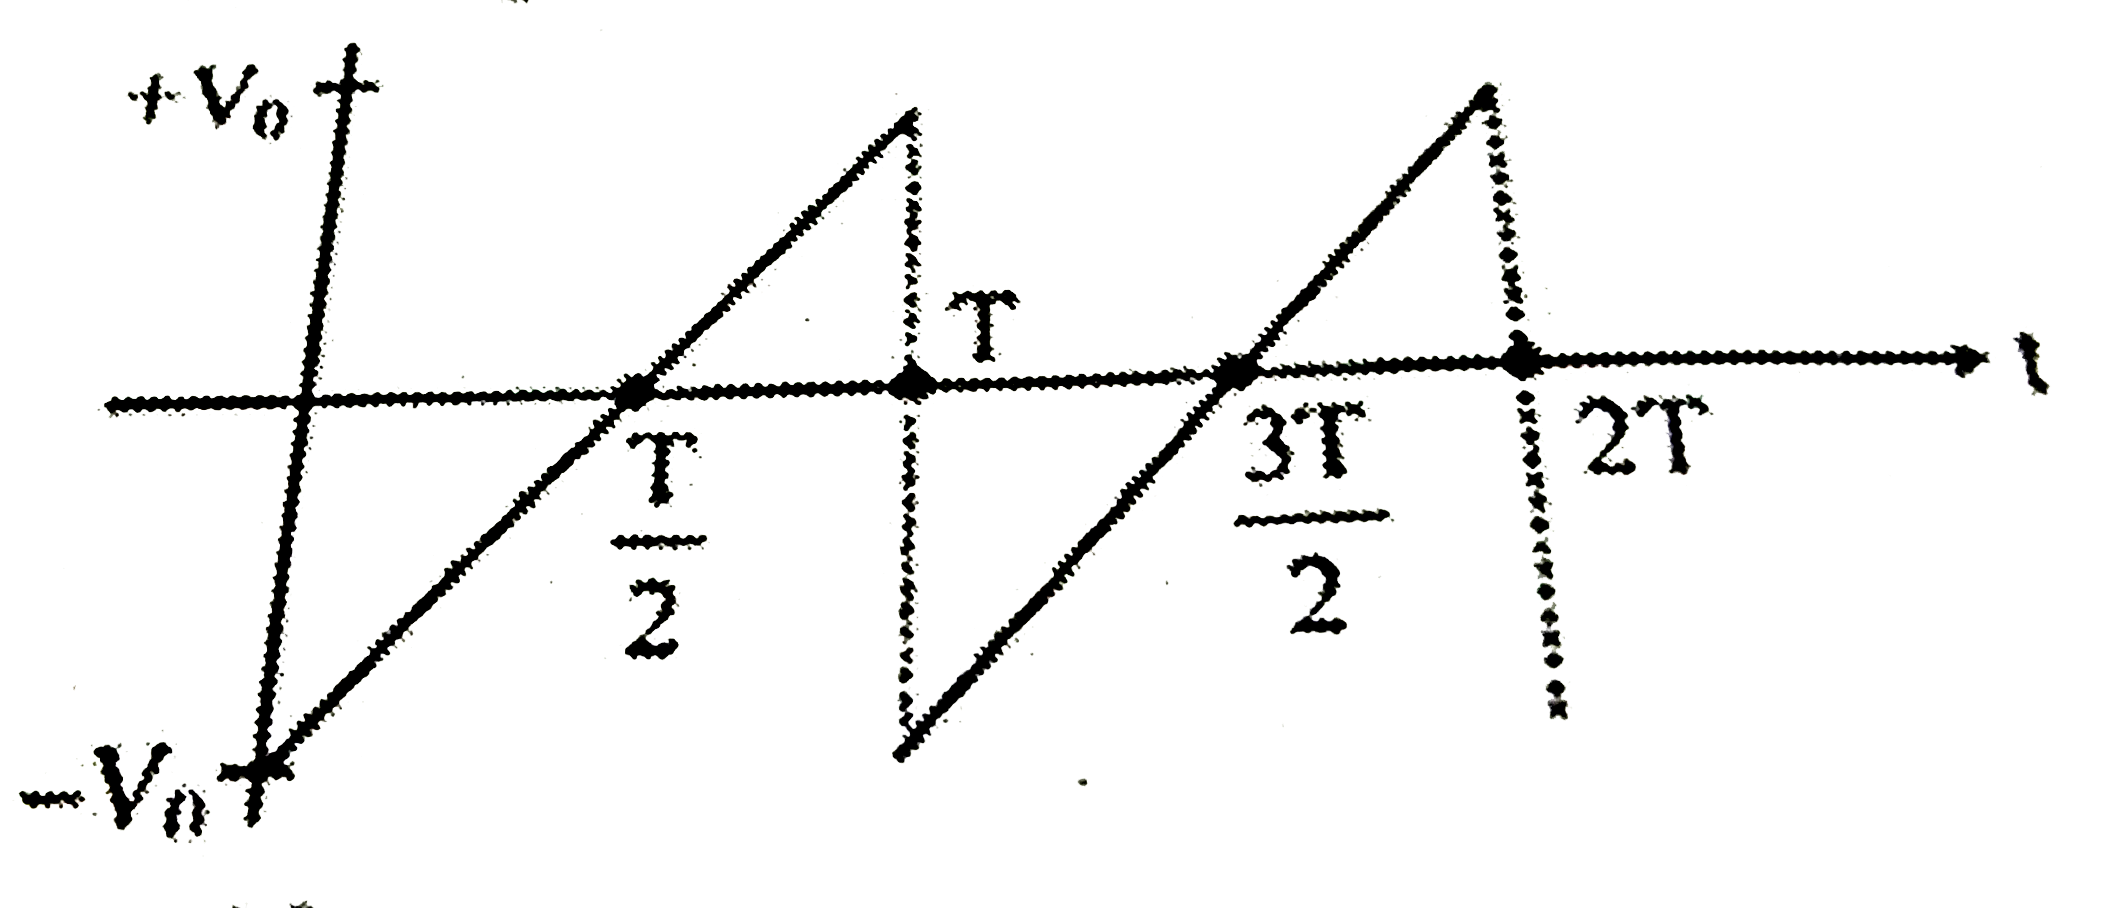 AV02BV0√2CV03DV0√3
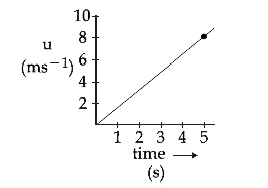
The speed verses time graph for a particle is shown in the figure. The distance travelled (in m) by the particle during the time interval t = 0 to t = 5 s will be __________
 View Solution
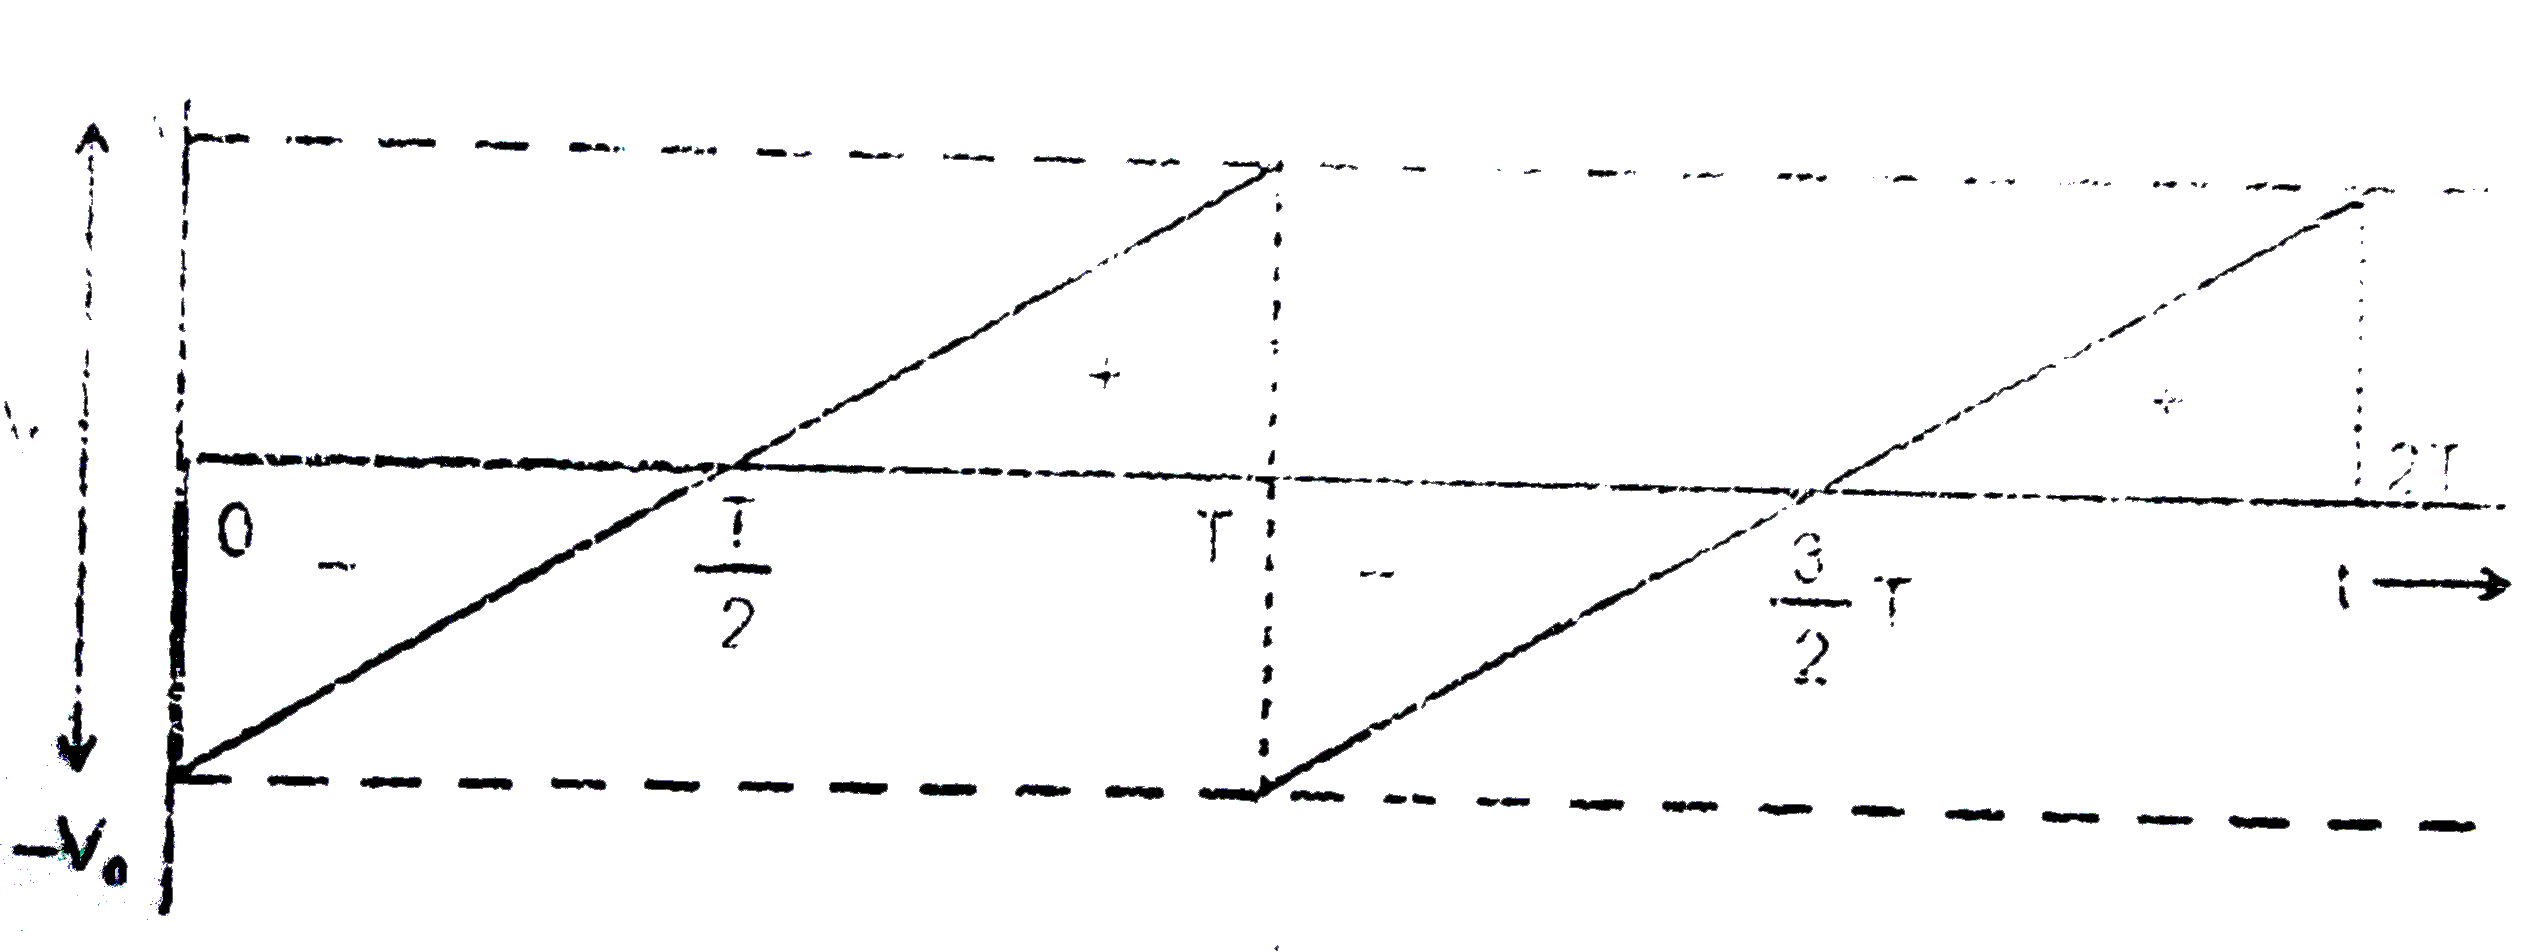
The rms value of the saw-tooth voltage of peak value V0 from t=0 to t=2T as shown in figure is V0√x.Find the value of x.
 View Solution
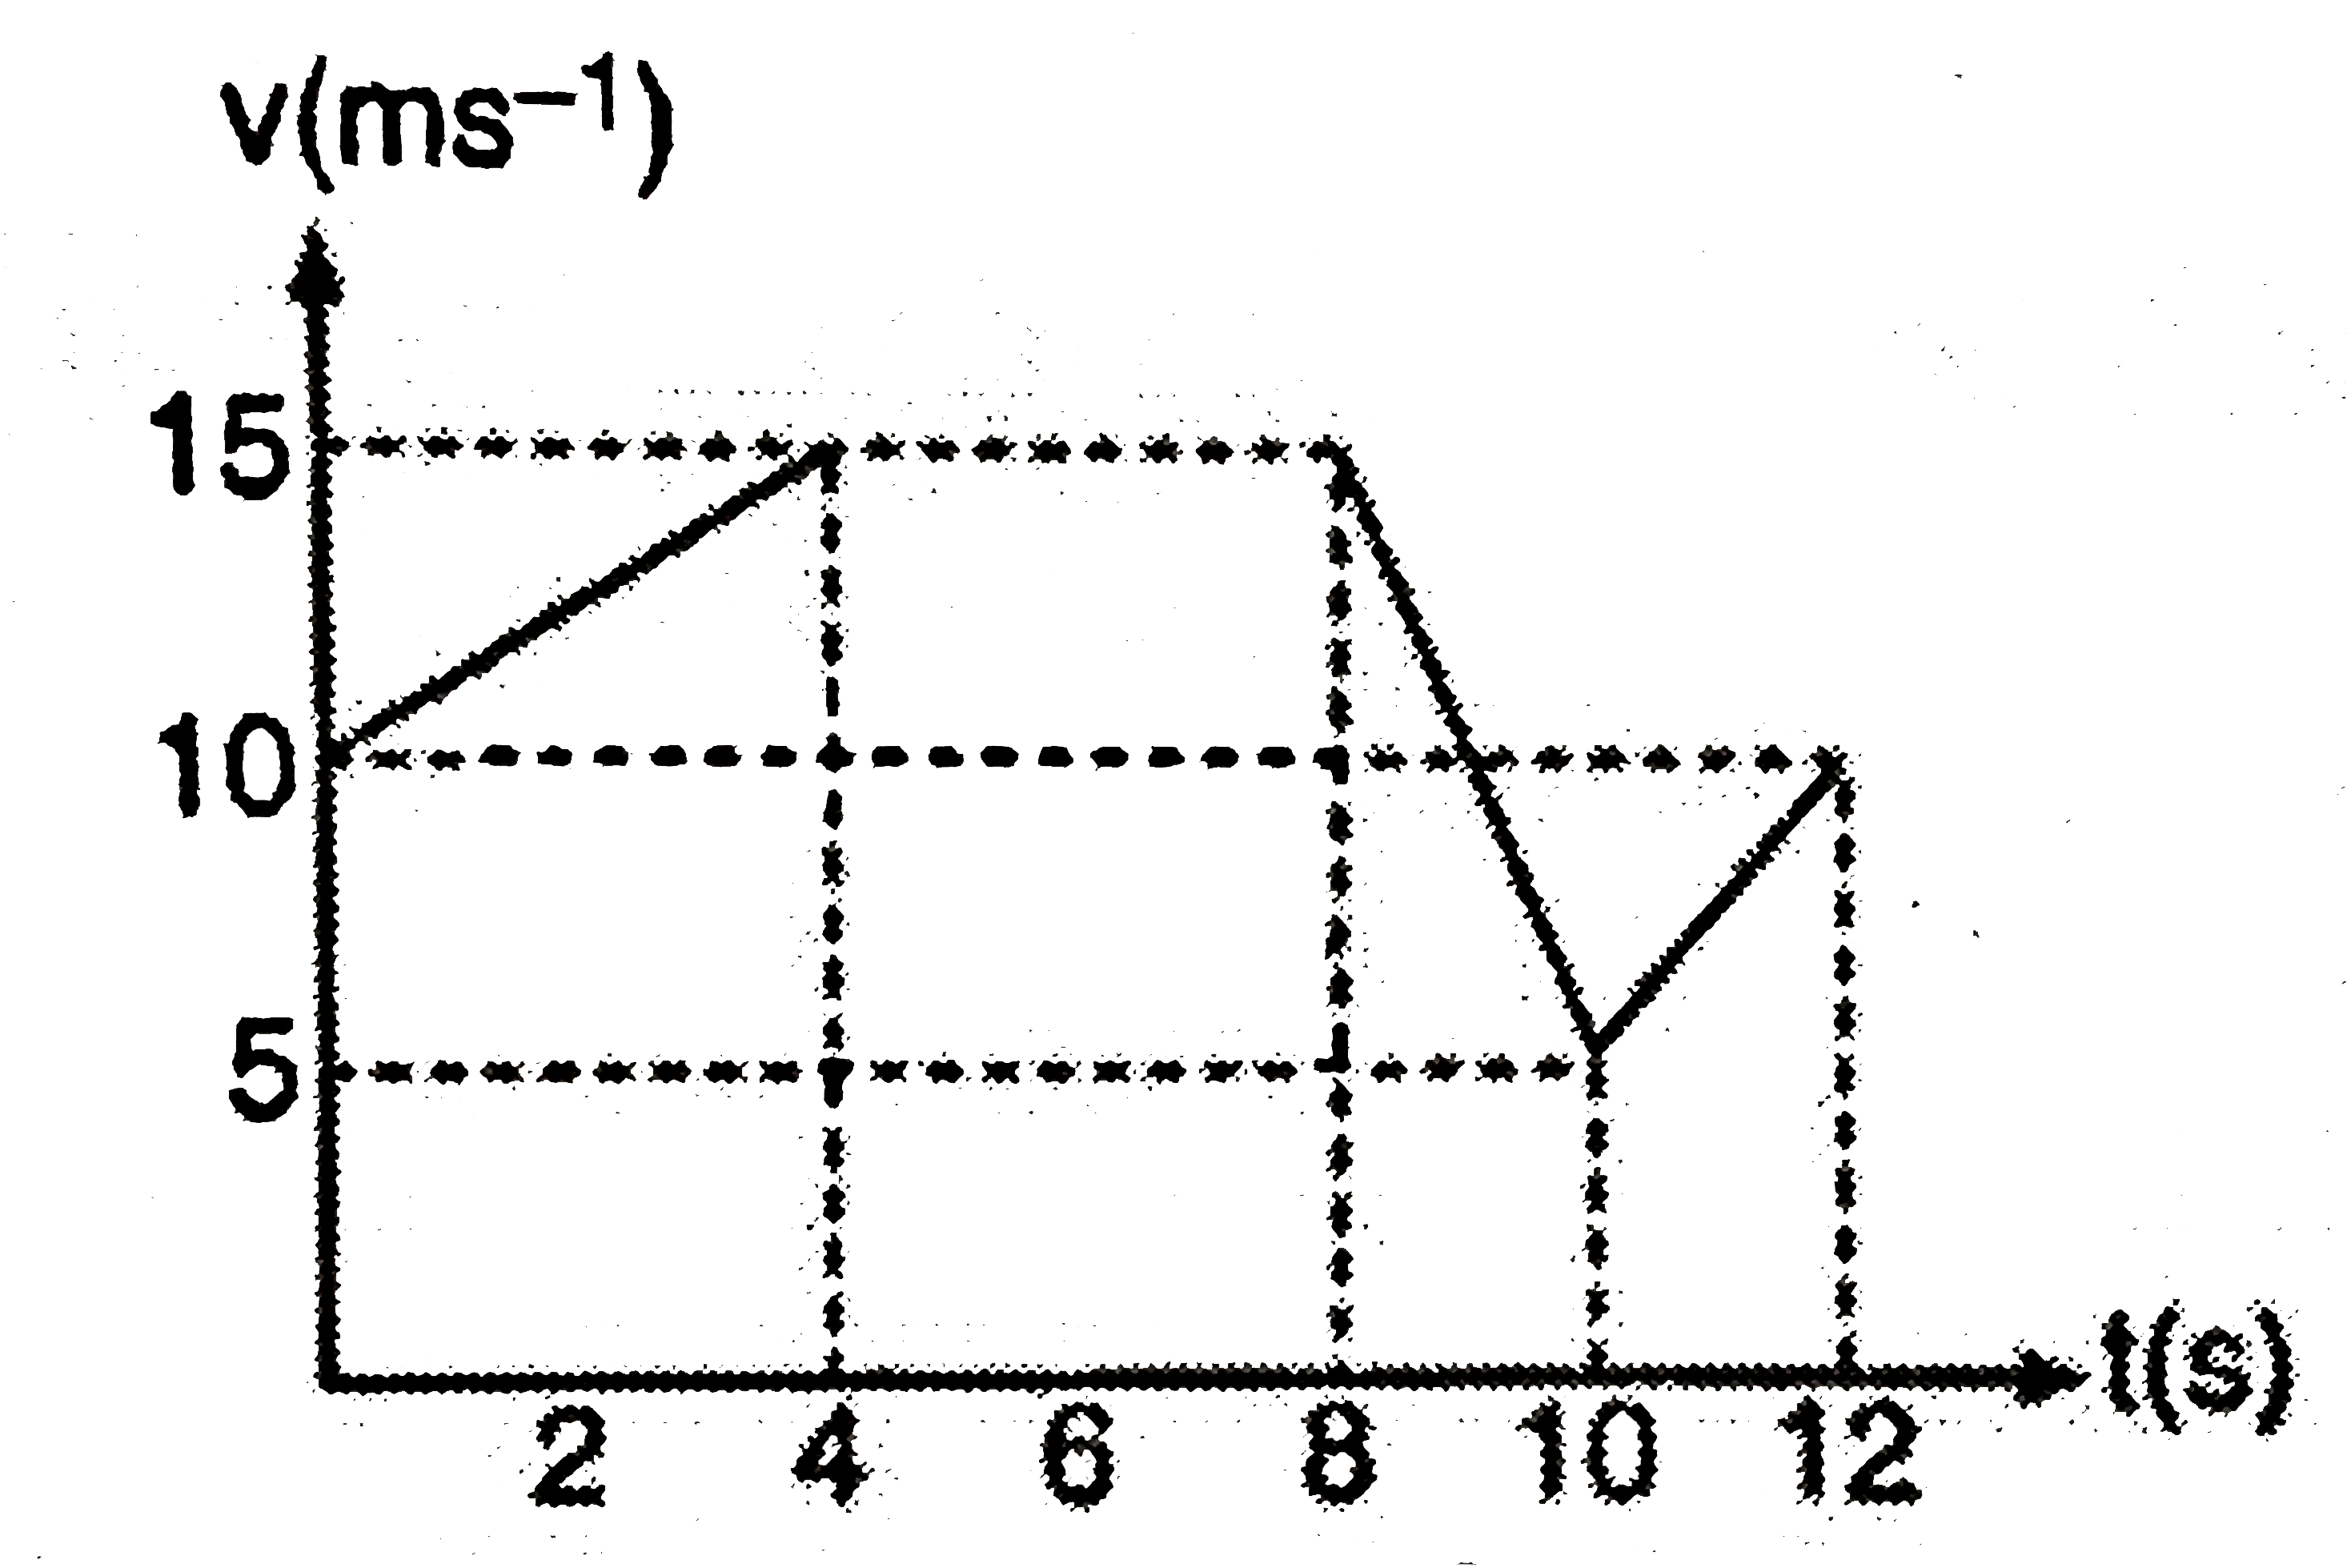
The velocity -time (v−t) graph of a particle moving in a straight line is shown in figure. The acceleration of the particle at t=9 is:
 View Solution
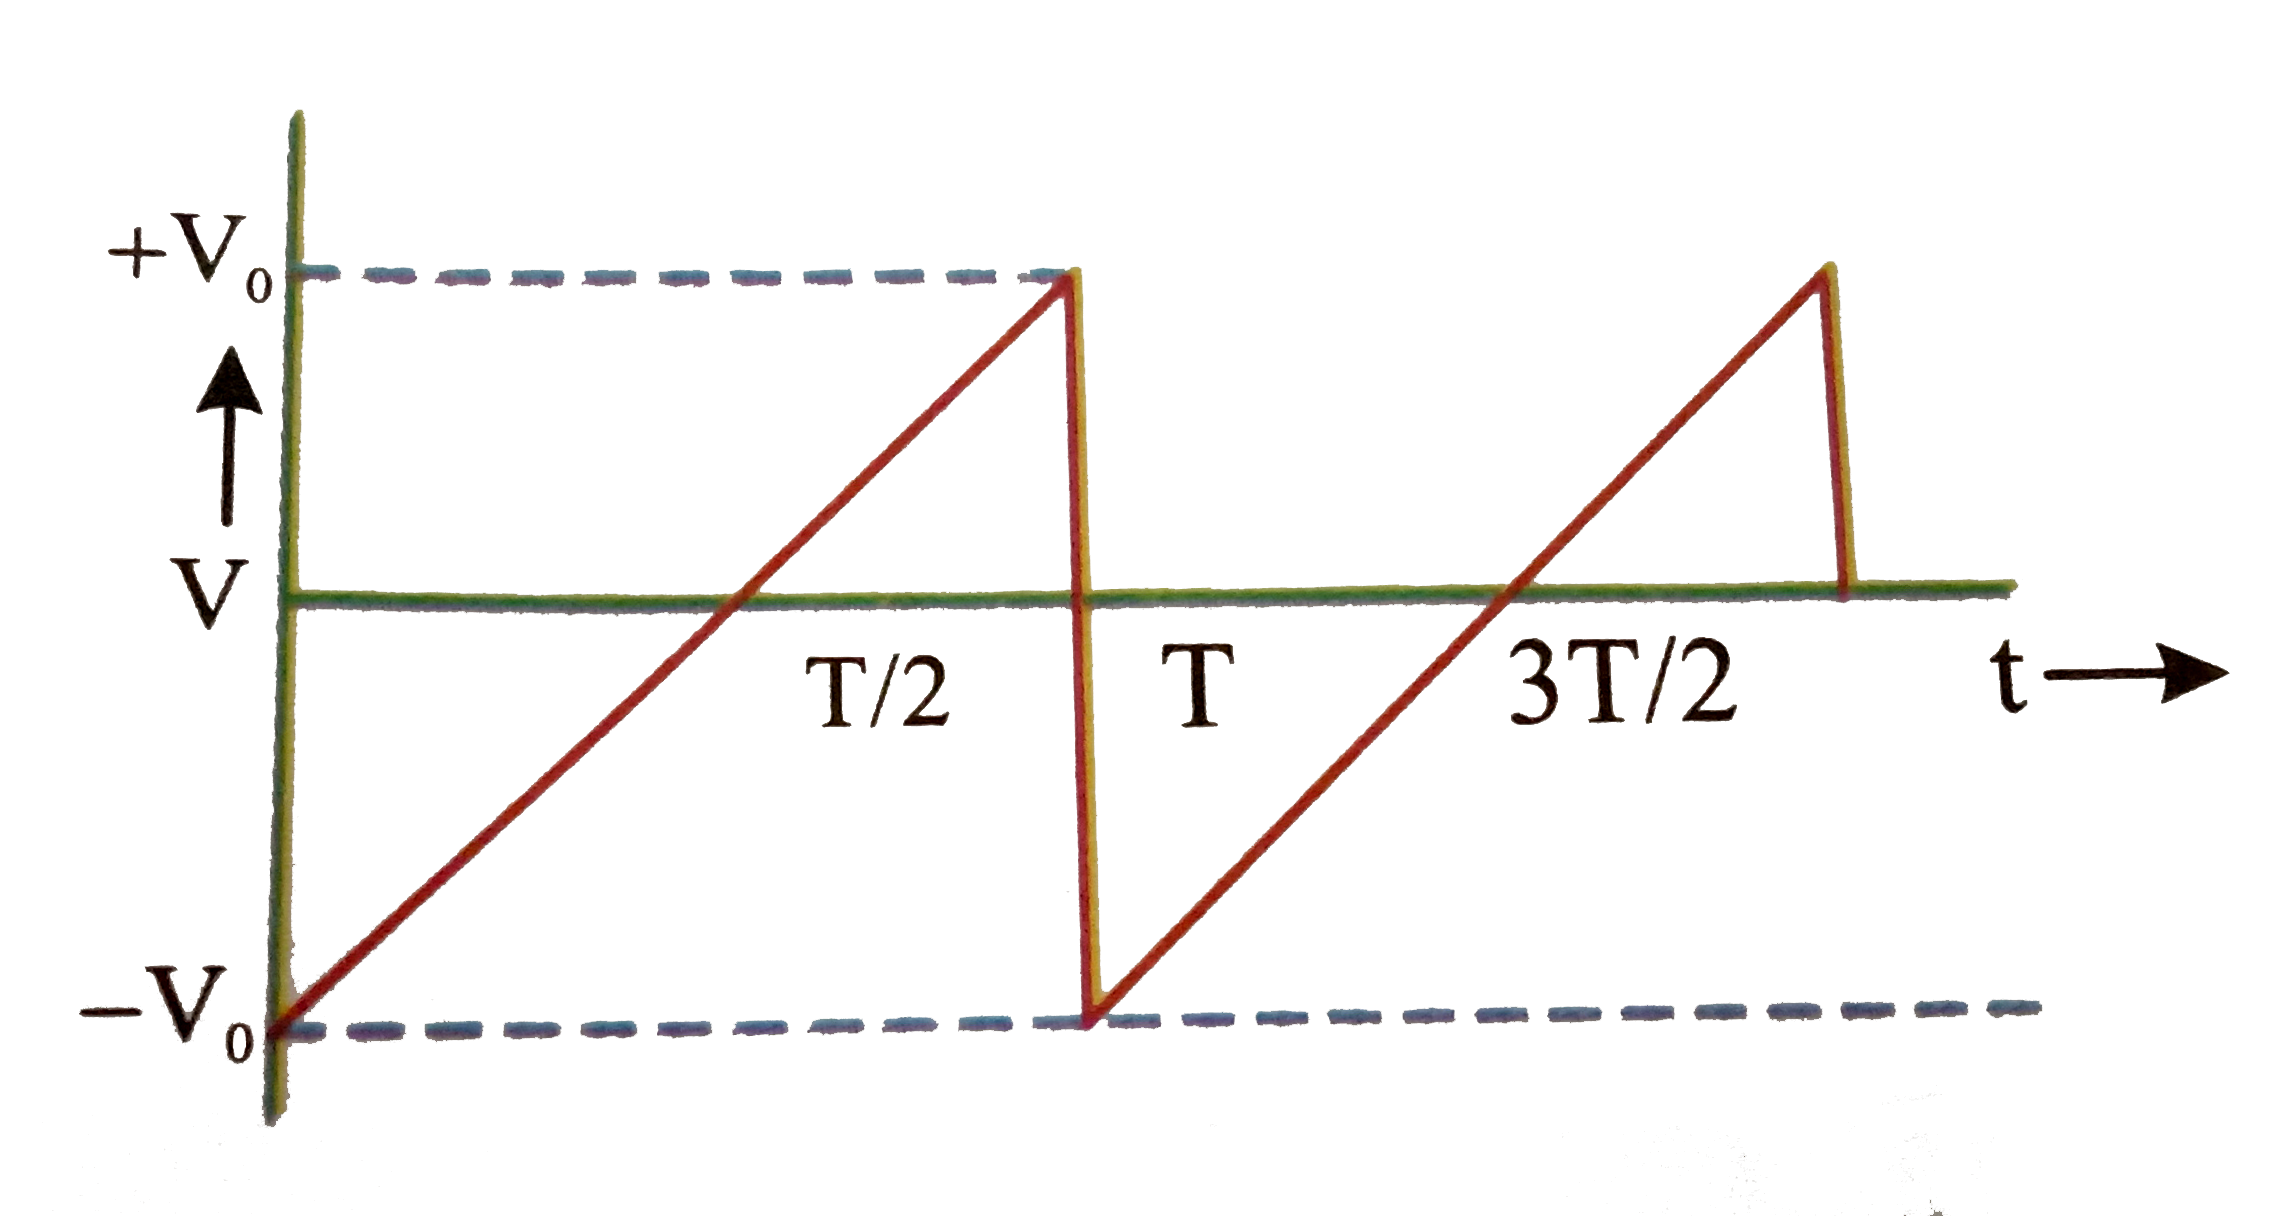
The average value for the saw-tooth voltage of peak value of V0 over half the cycle as shown in figure is
 View Solution
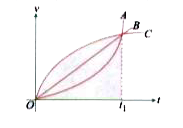
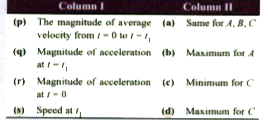
v - t graph for rectilinear motion is given as shown in the figure. Match the column on the basis of the v-t graph.
 View Solution

