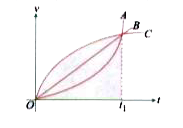
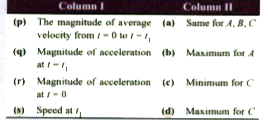
v - t graph for rectilinear motion is given as shown in the figure. Match the column on the basis of the v-t graph.
A
p−d,q−b,c,r−d,s−a
B
p−a,q−c,d,r−b,s−a
C
p−b,q−b,c,r−b,s−a
D
None of these
Text Solution
The correct Answer is:A
[p] area of v-t graph is maximum for C.
[q] slope at t, is maximum for A and minimum for C
[r] at t=0, slope is maximum for C
[s] speed at t1 is same for all.
|
Topper's Solved these Questions
Similar Questions
Knowledge Check
v−t graph of a particle in SHM is as shown is figure. Choose the wrong option.
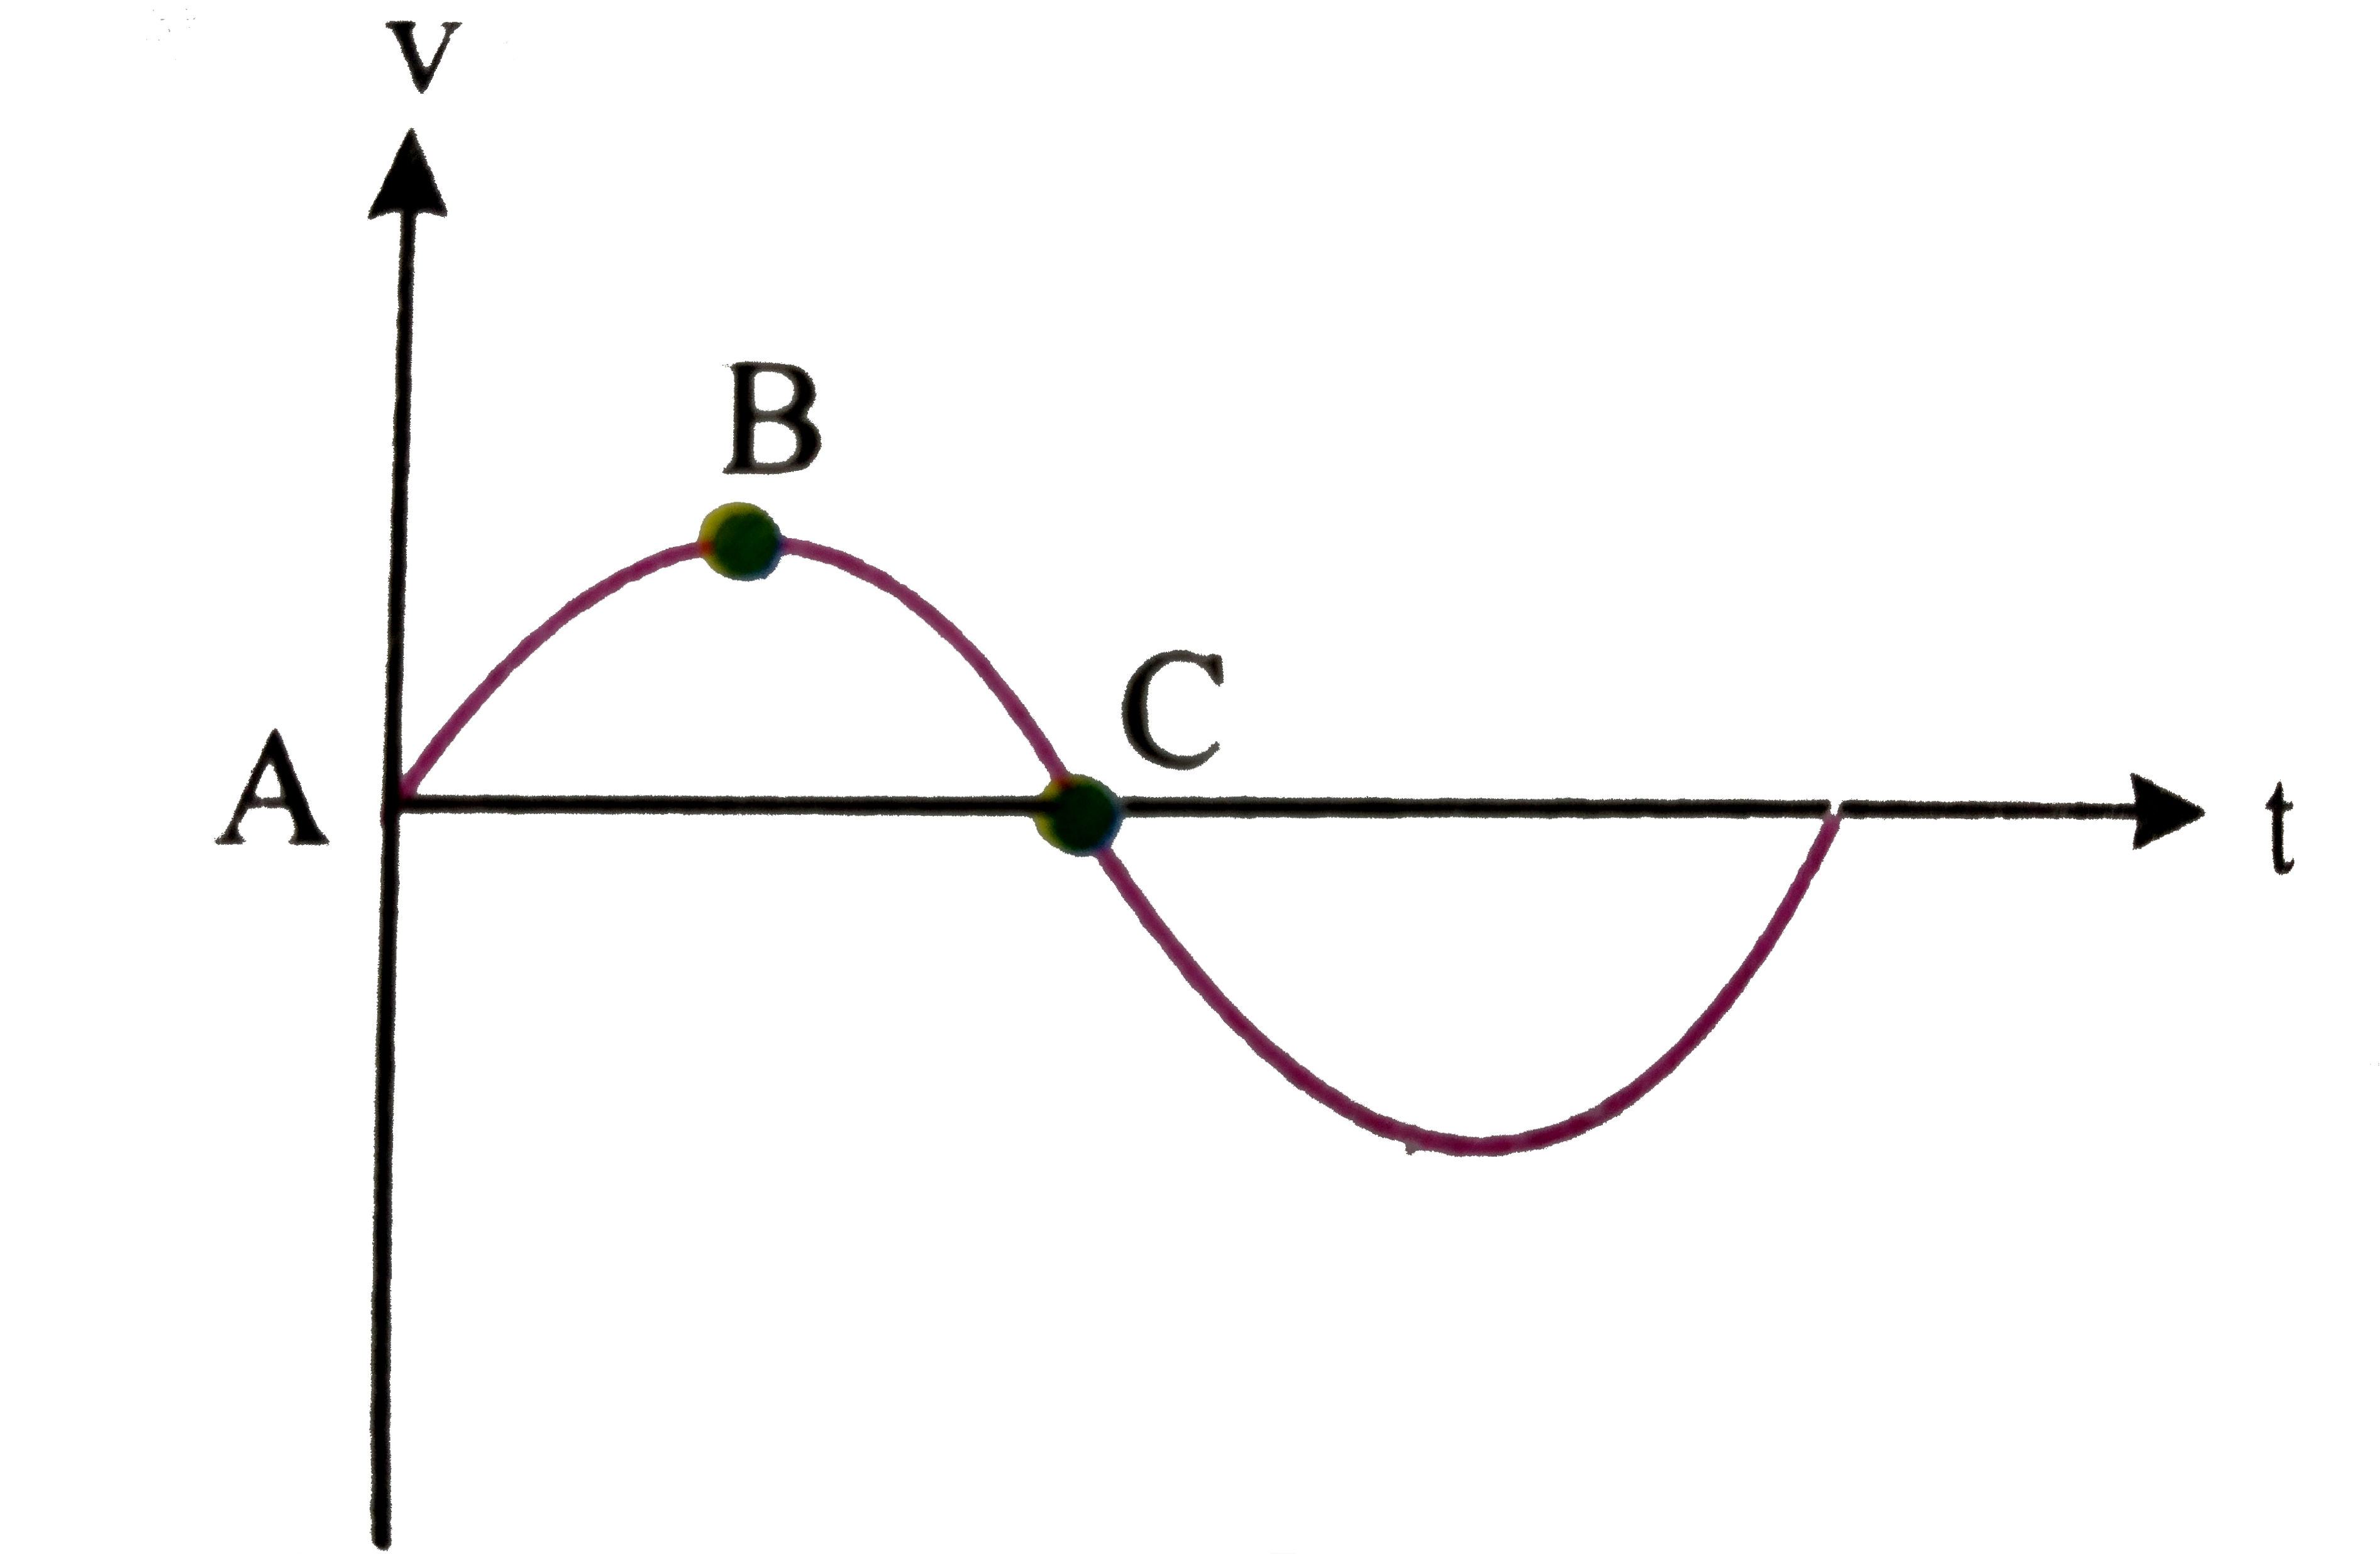 Aat A particle is at mean position and moving towards position directionBat Bacceleration of particle is zeroCat C acceleration of particle is maximum and in position directionDnone of the above
The velocity -time (v−t) graph of a particle moving in a straight line is shown in figure. The acceleration of the particle at t=9 is:
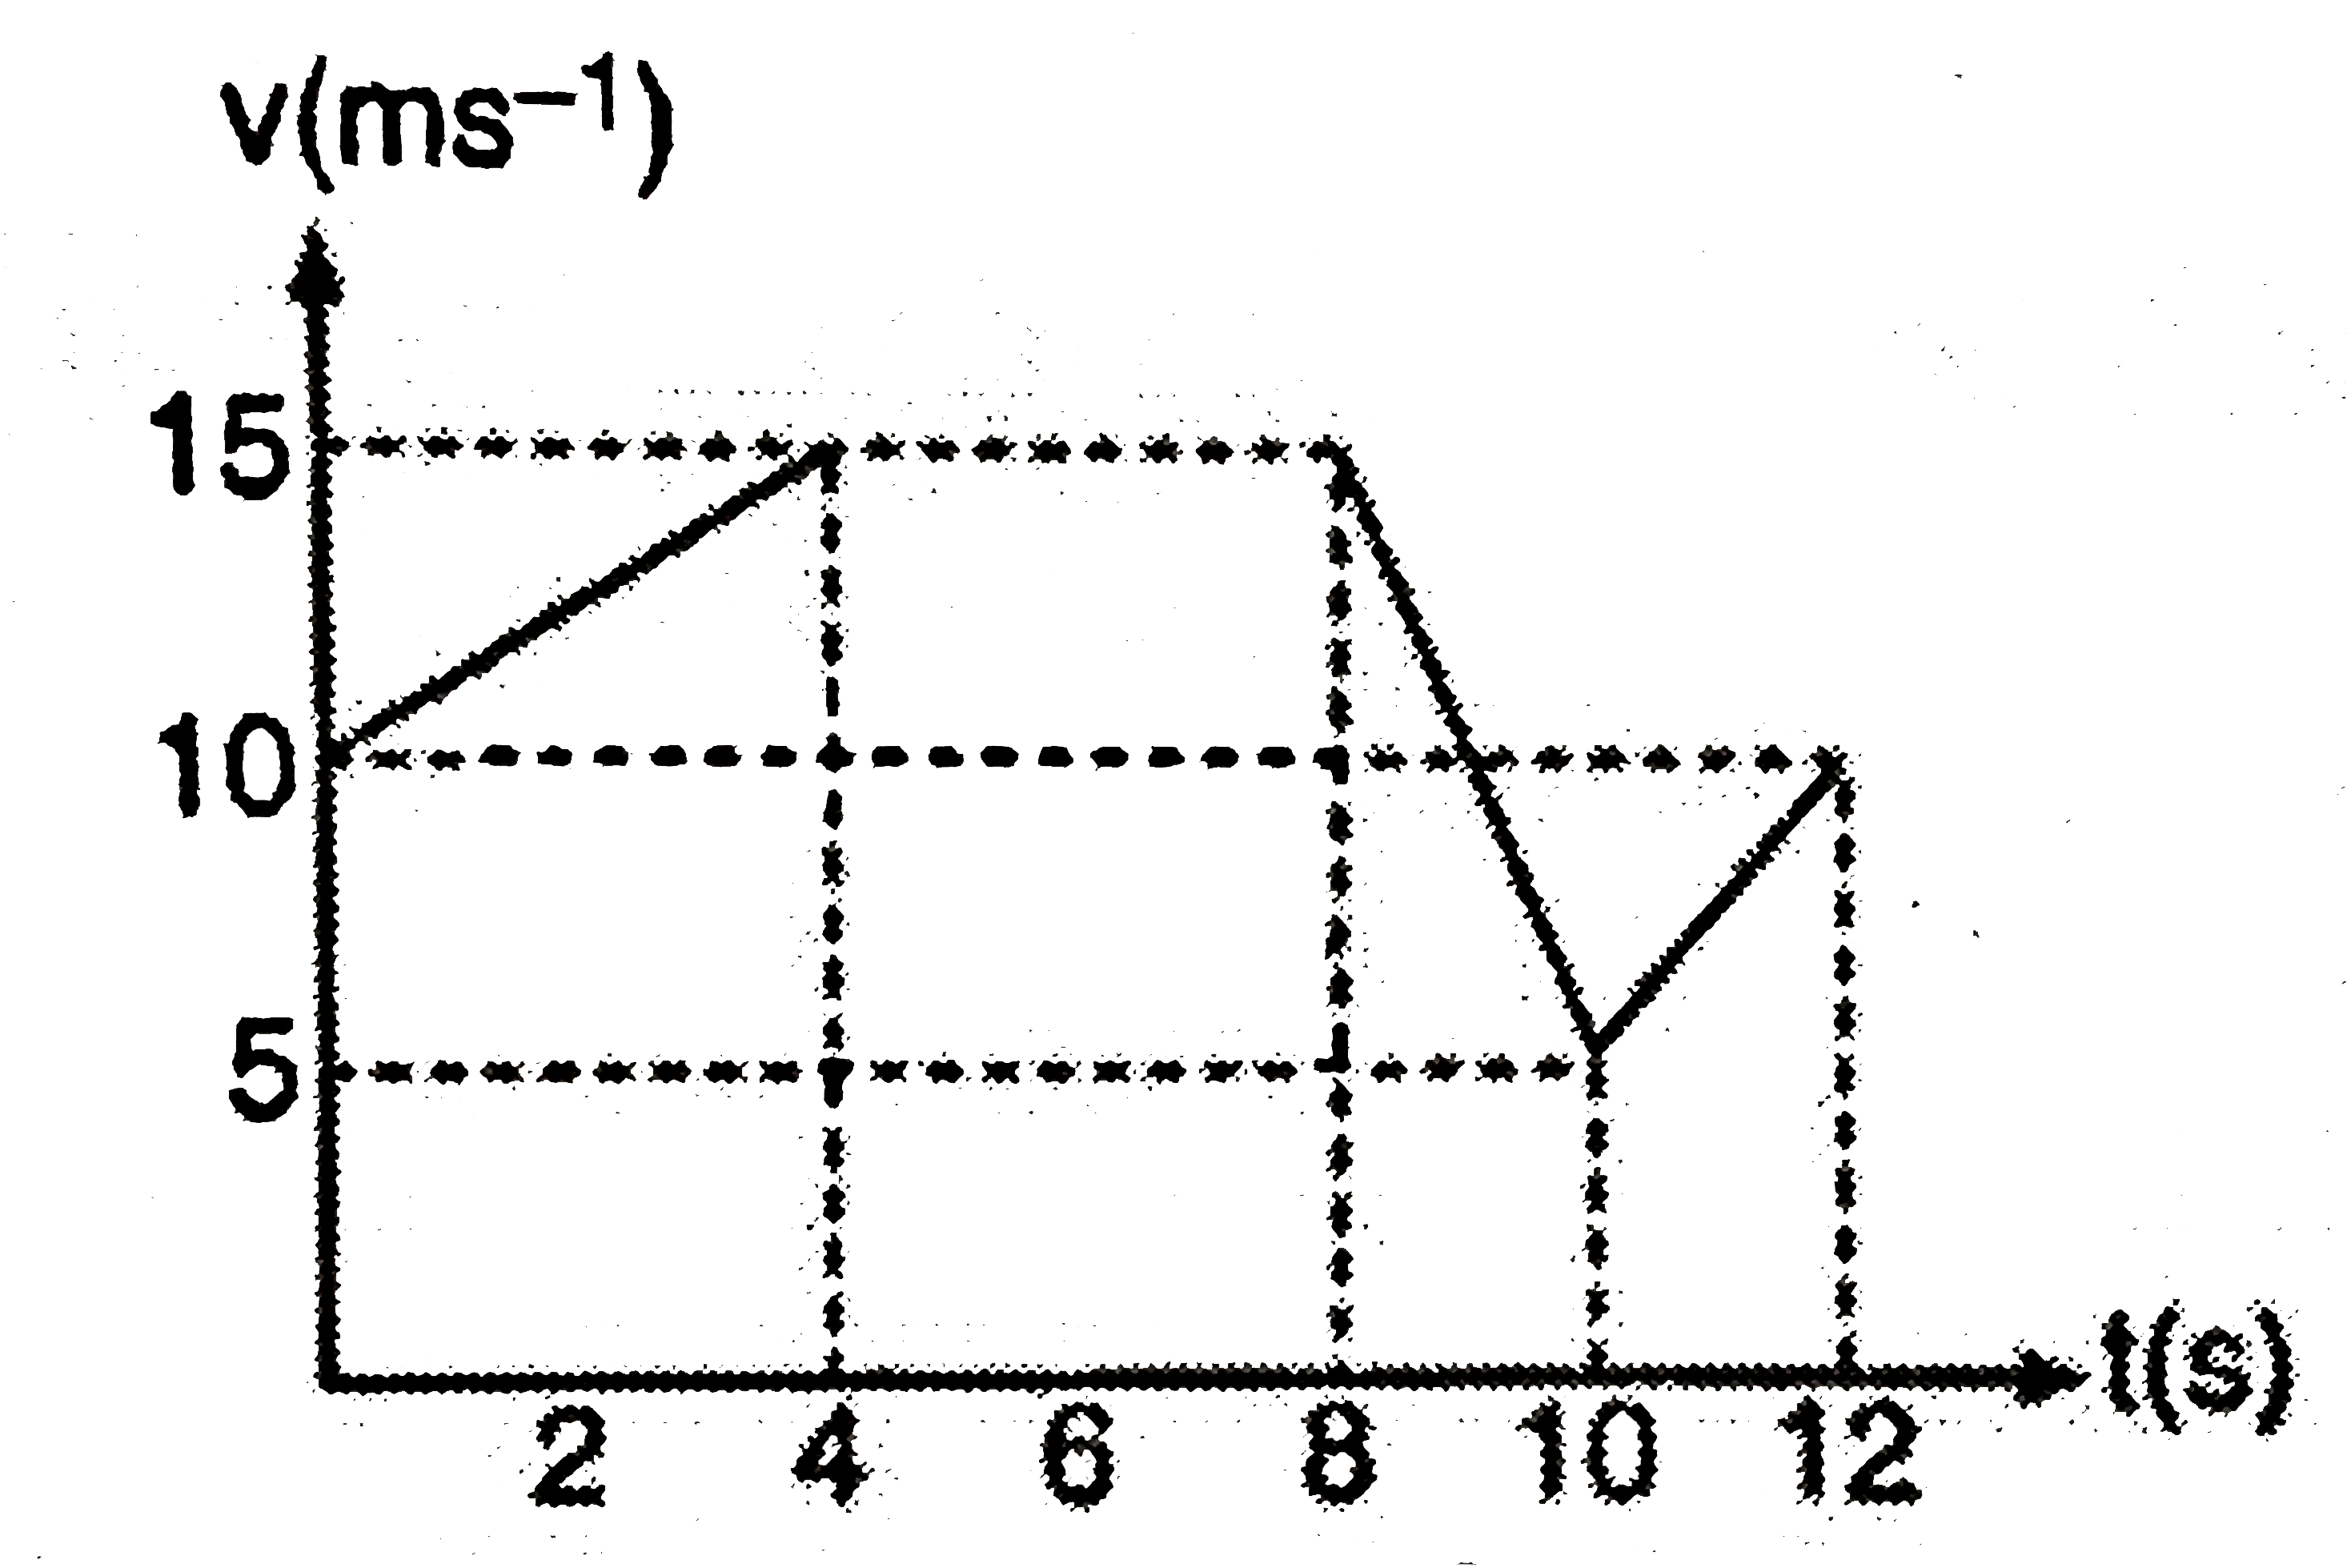 AzeroB5ms−2C−5ms2D−2ms−2
The v-t graph of a linear motion is shown in adjoining figure. The distance from origin after 8 seconds is -
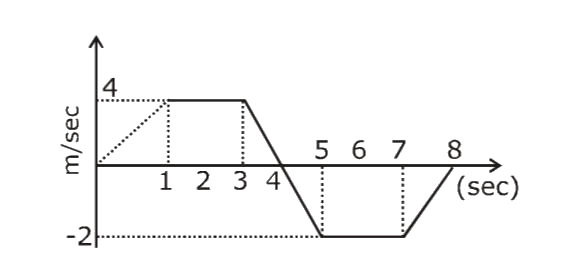 A18 metersB16 metersC8 metersD6 meters
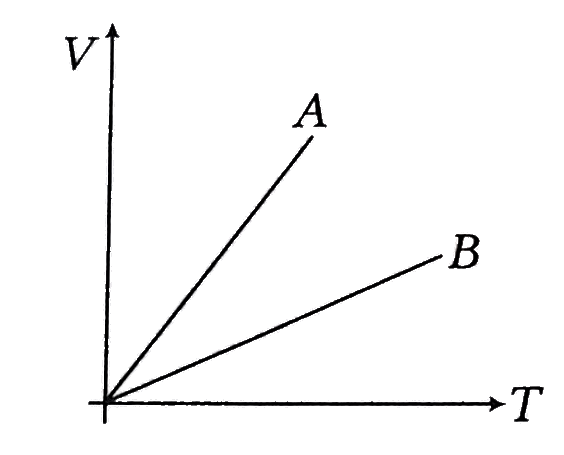
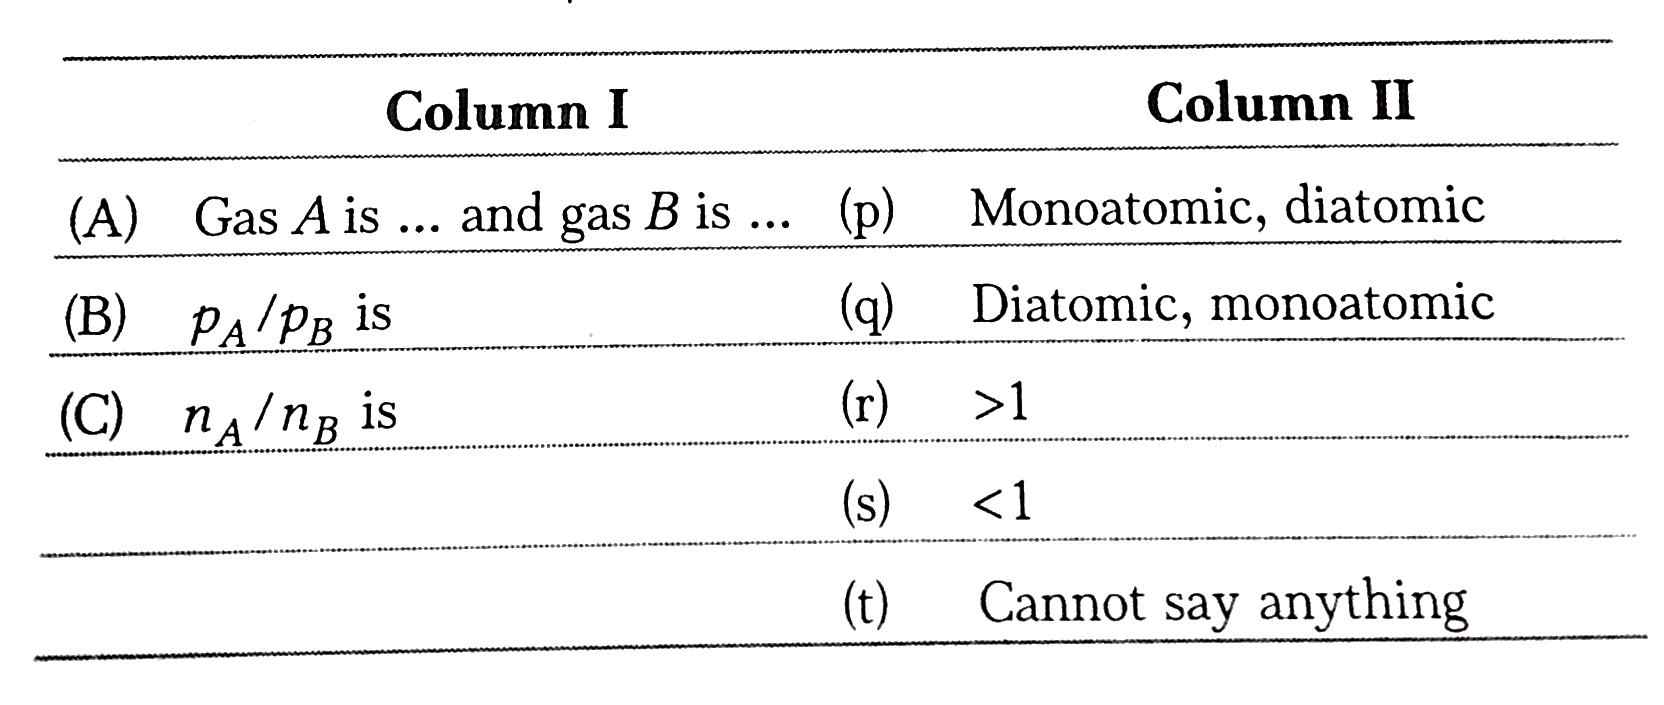
In the V-T graph shown in figure match the following.
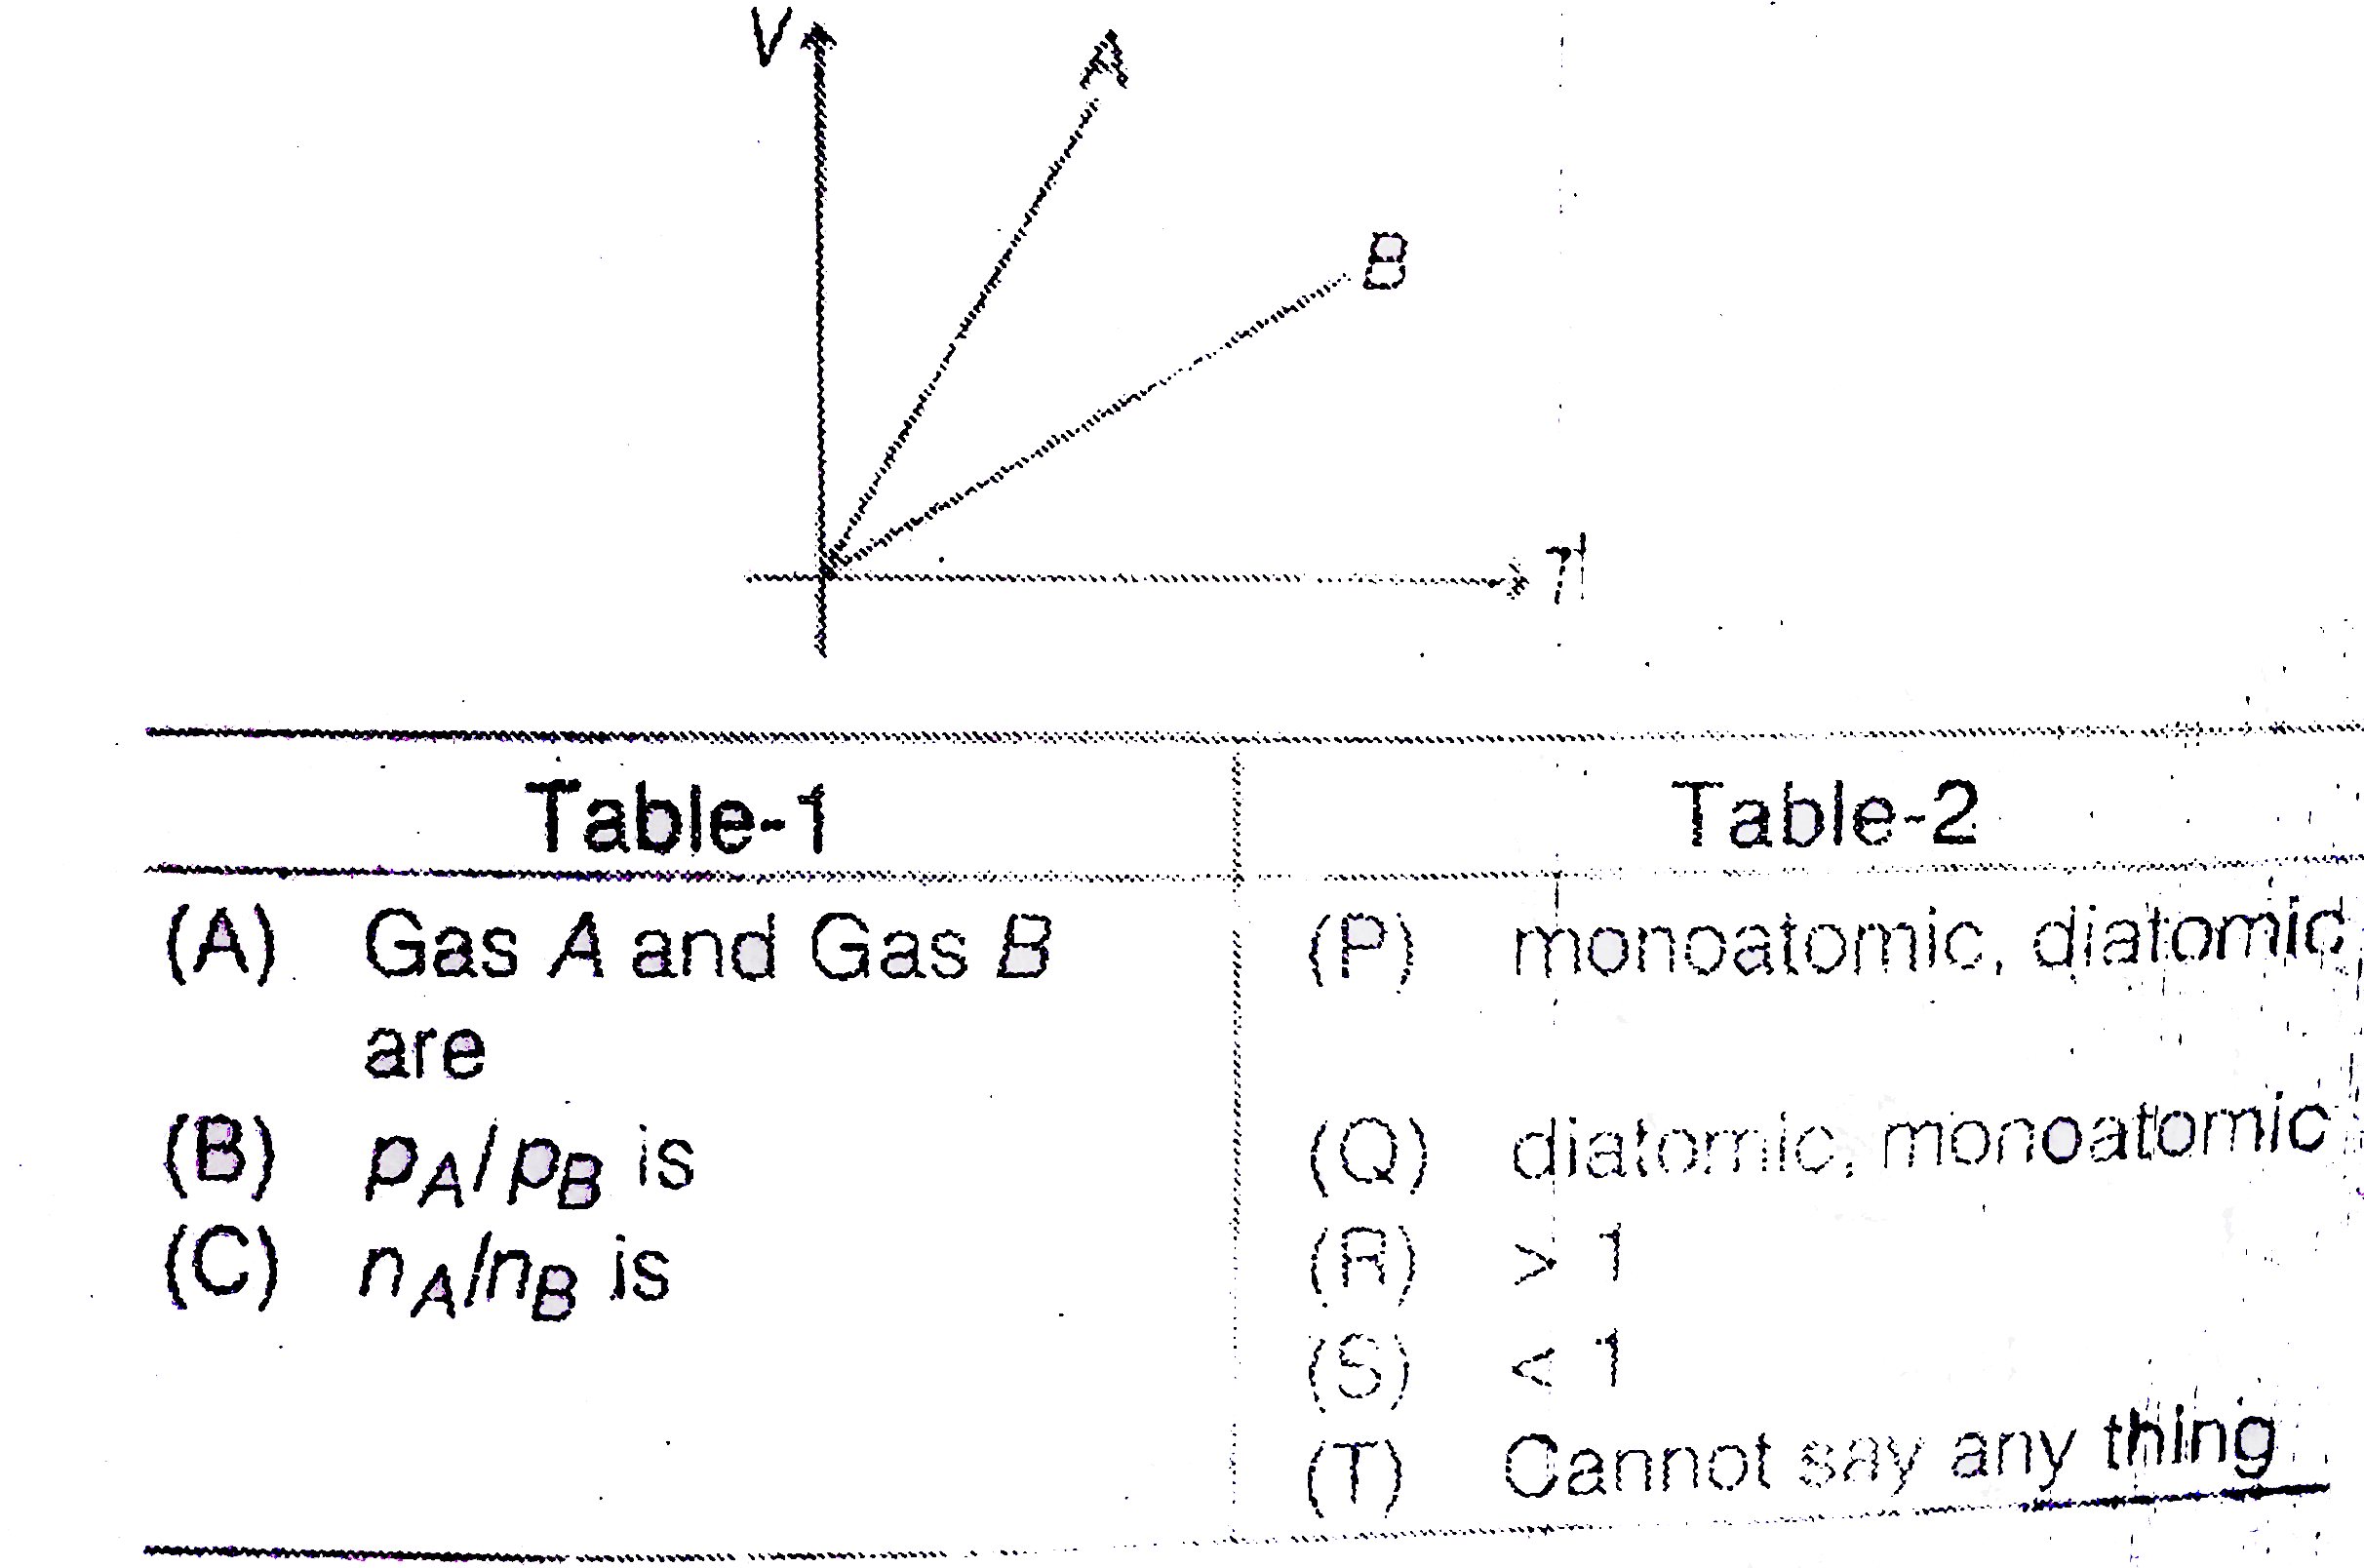
View SolutionIn the V-T graph shown in figure match the following.

View SolutionIn the ρ-T graph shown in figure, match the following.
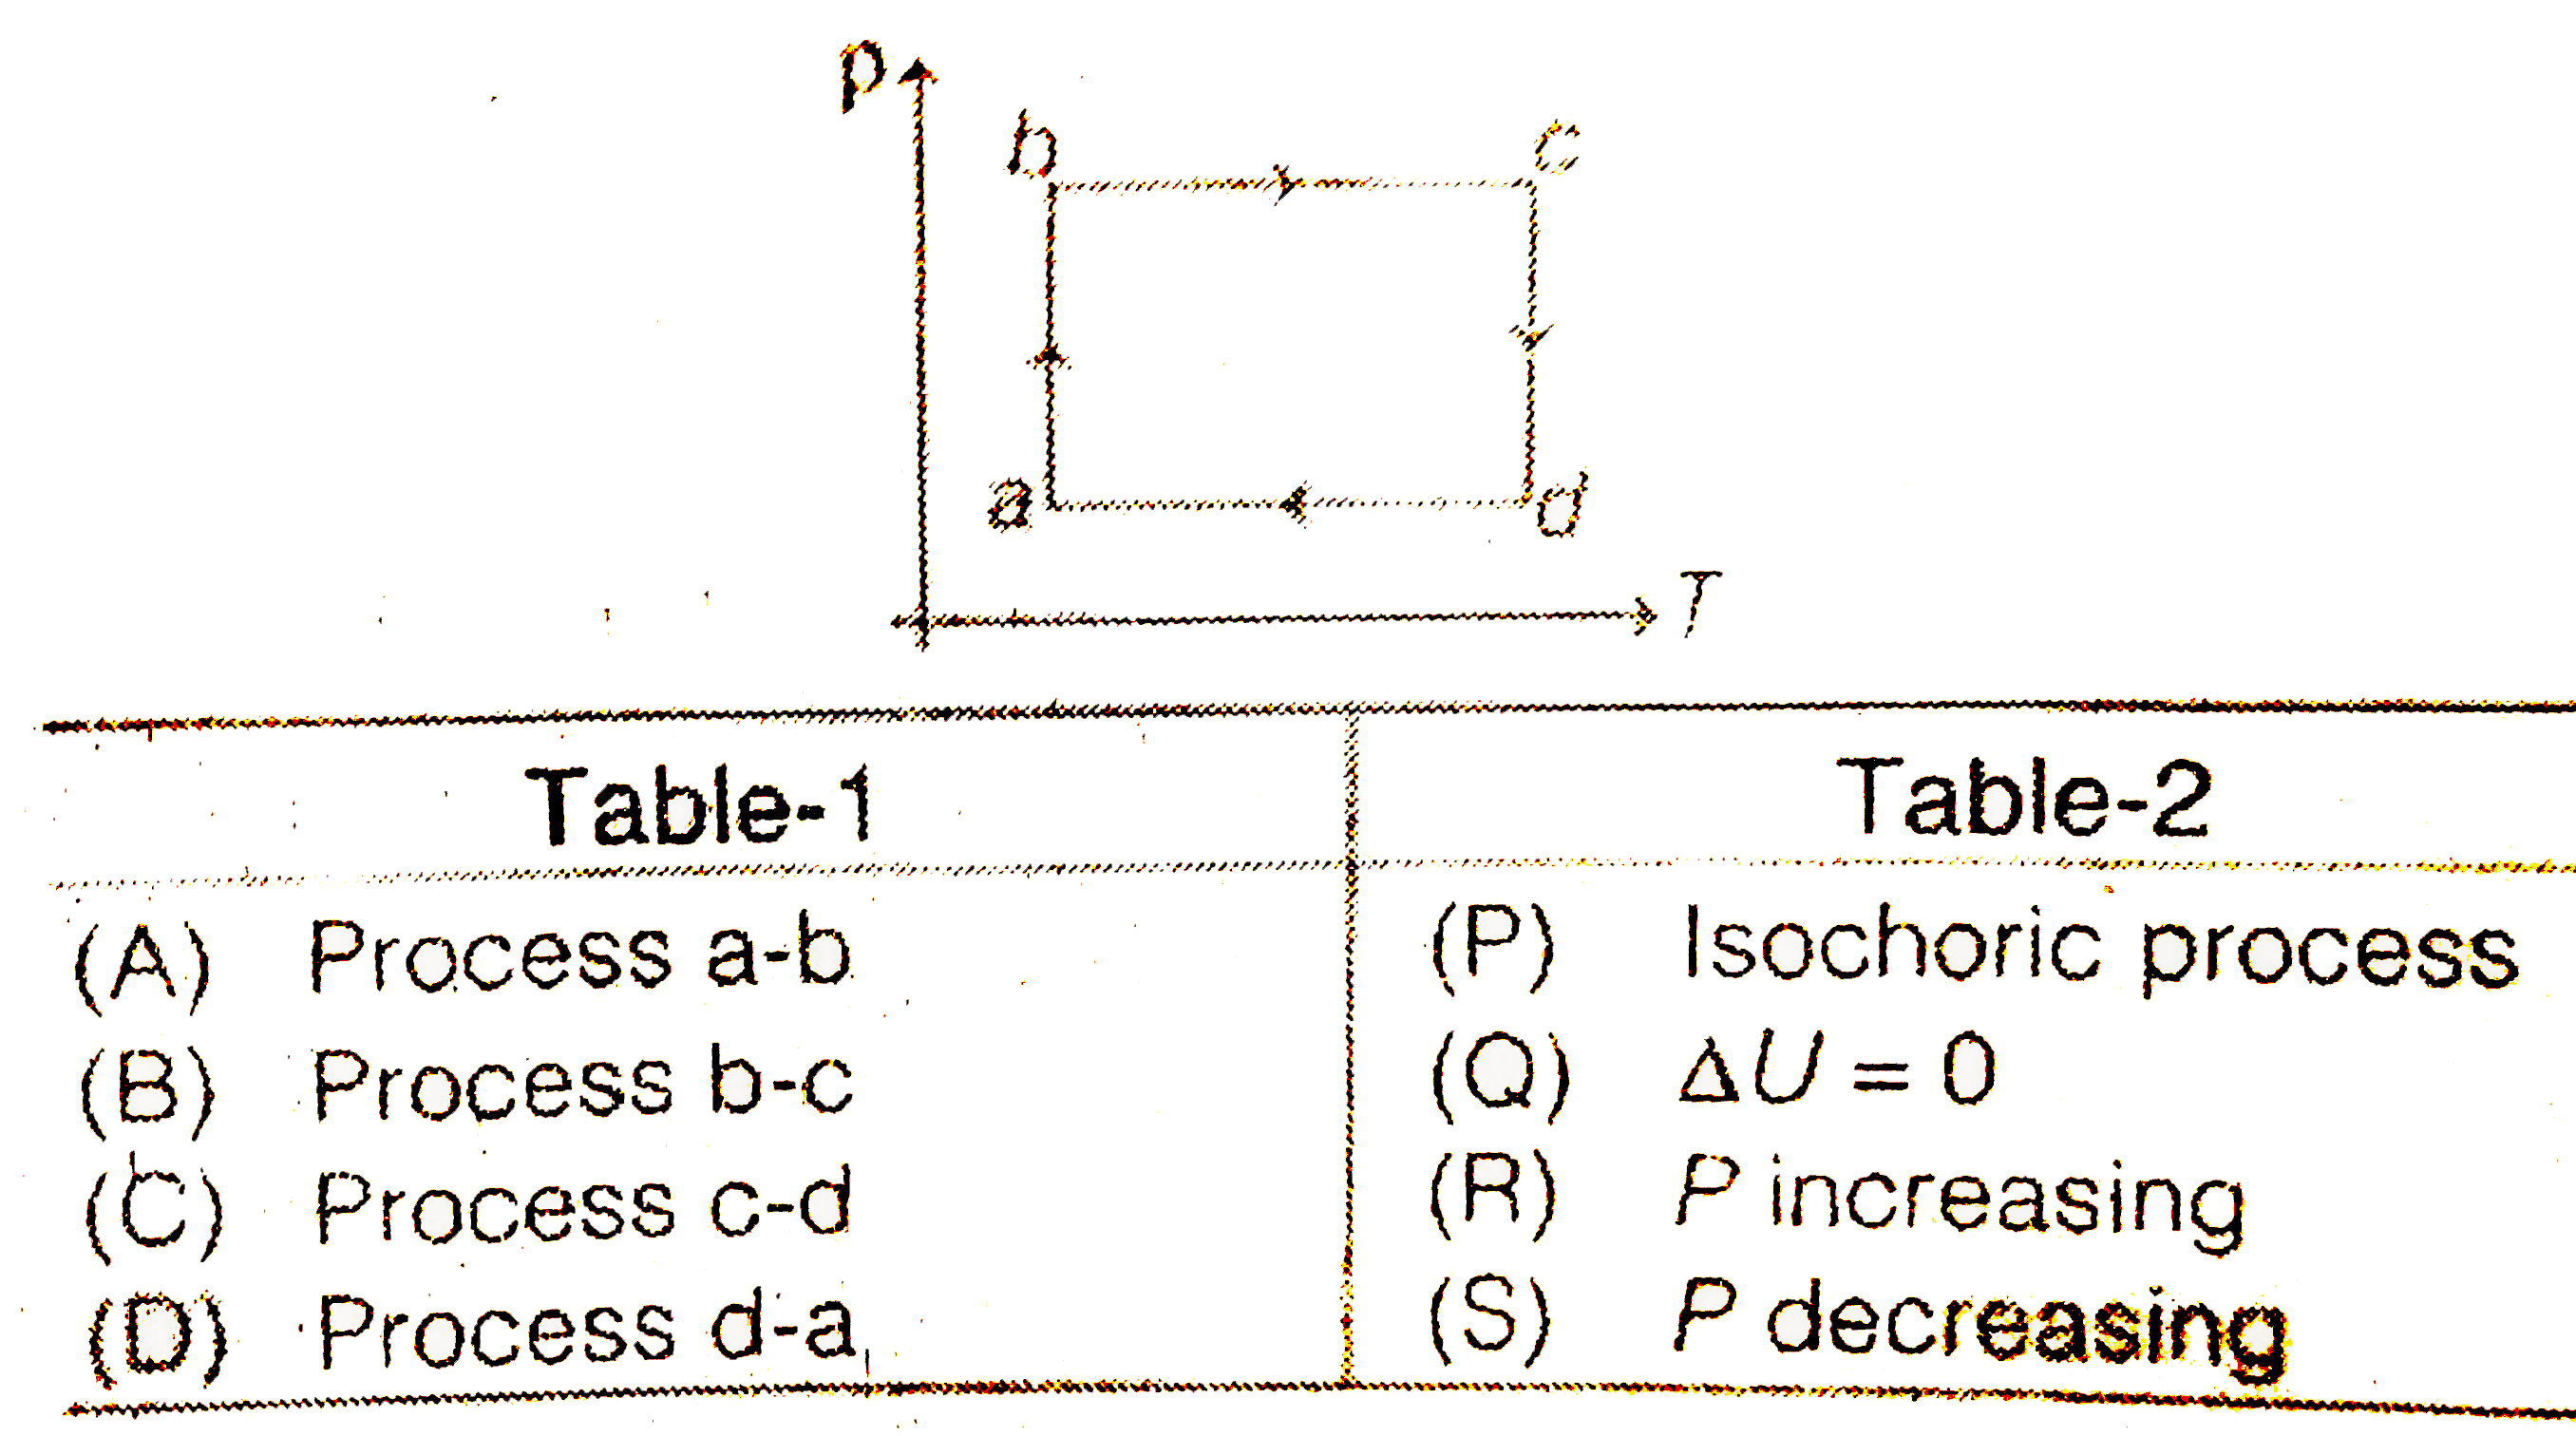
View SolutionIn the ρ-T graph shown in figure, match the following.

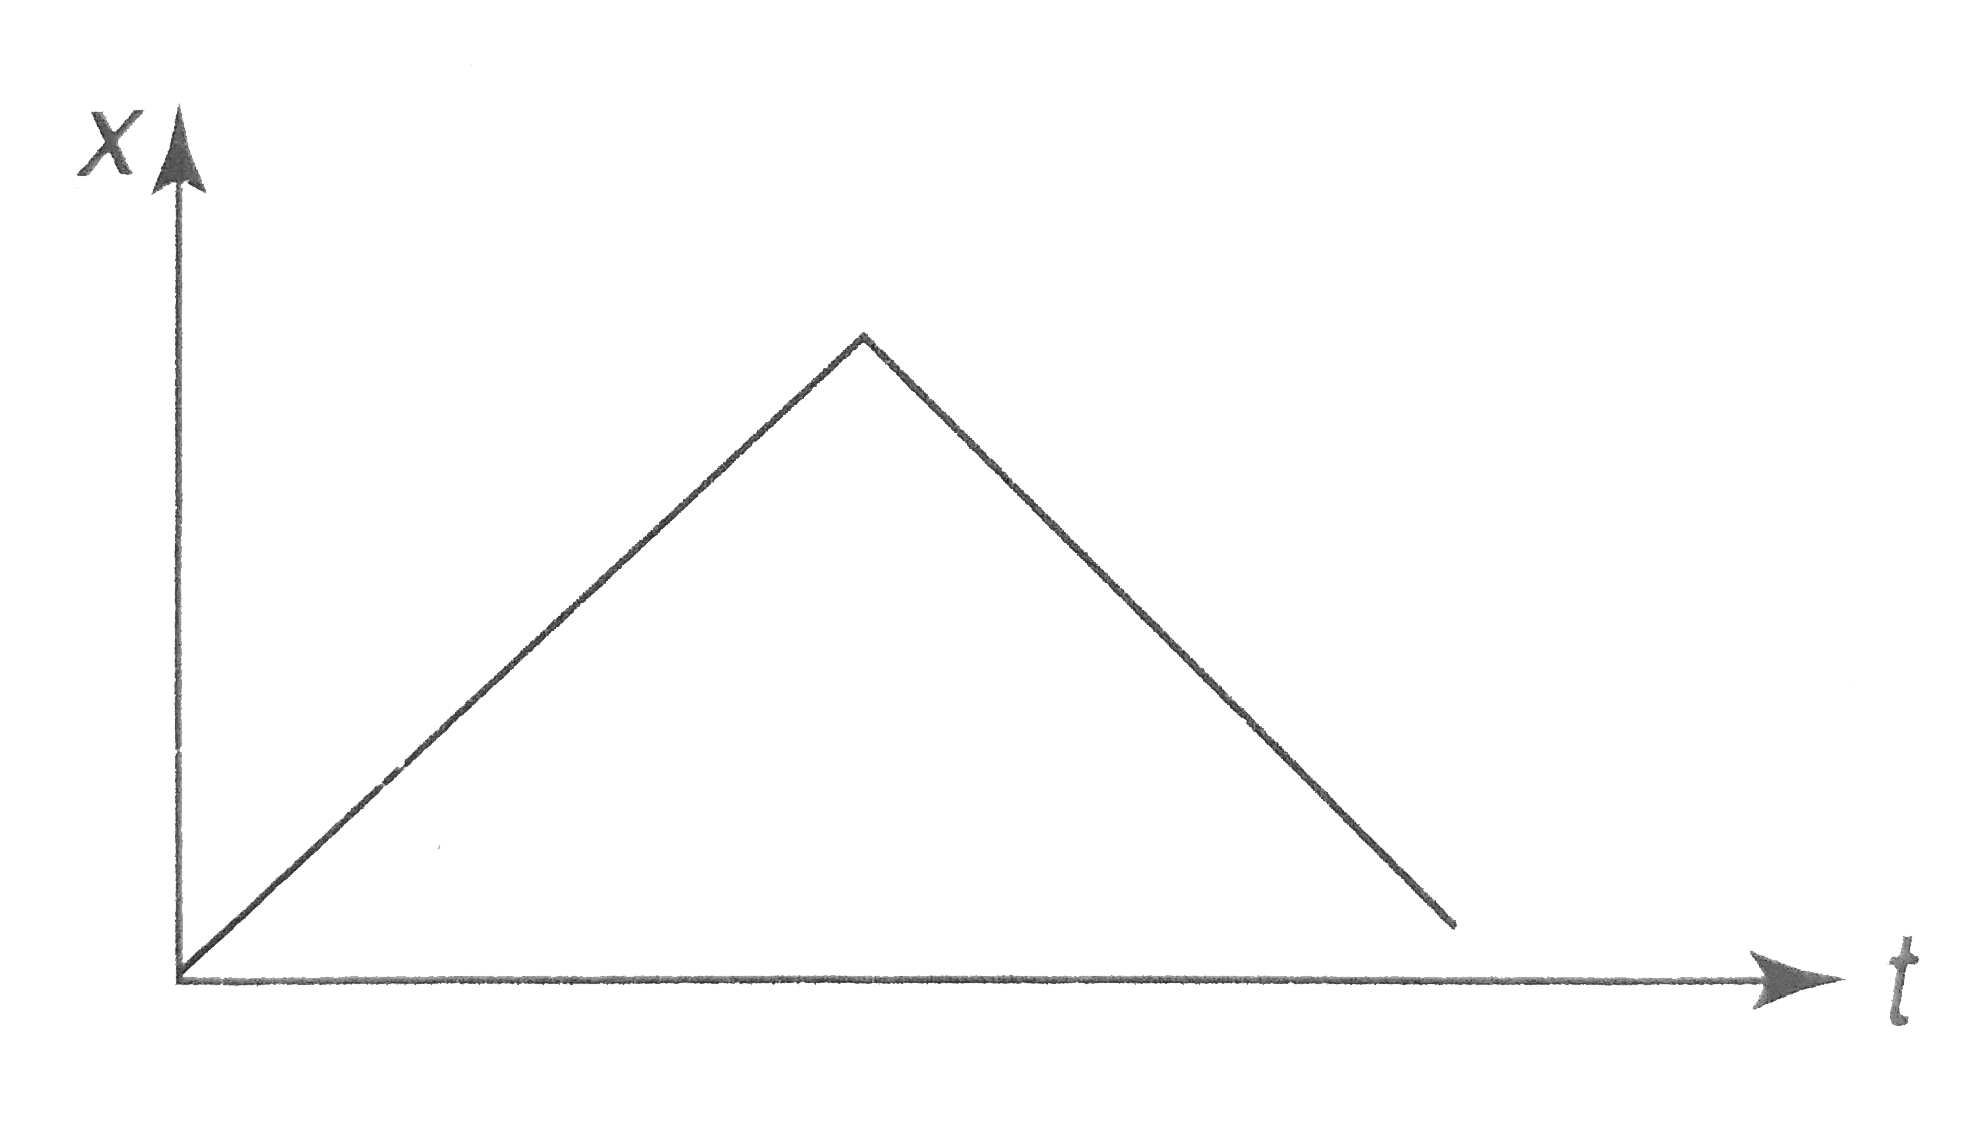
View SolutionAssertion: x−t graph, for a particle undergoing rectilinear motion, can be as shown in the figure.
Reason: Infinitesimal changes in velocity are physically possible only in infinitesimal time.
View Solution

