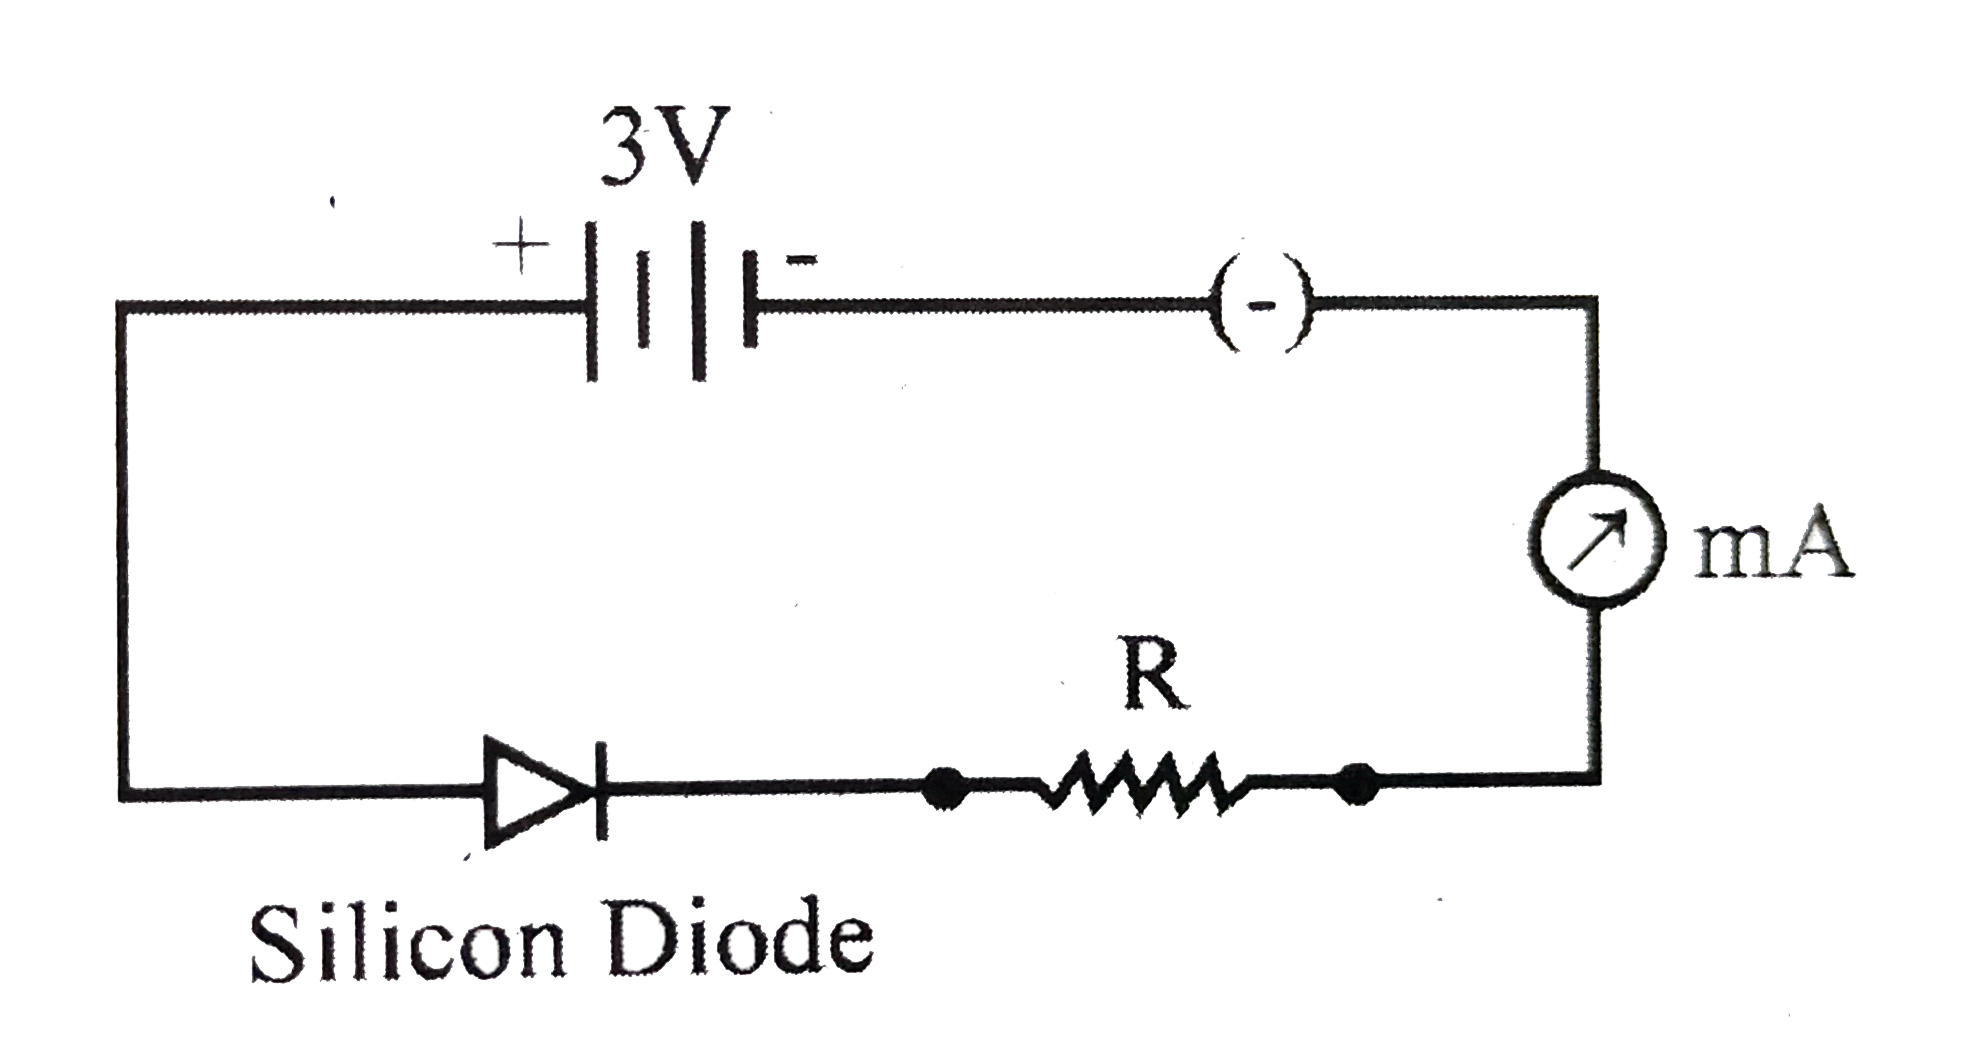
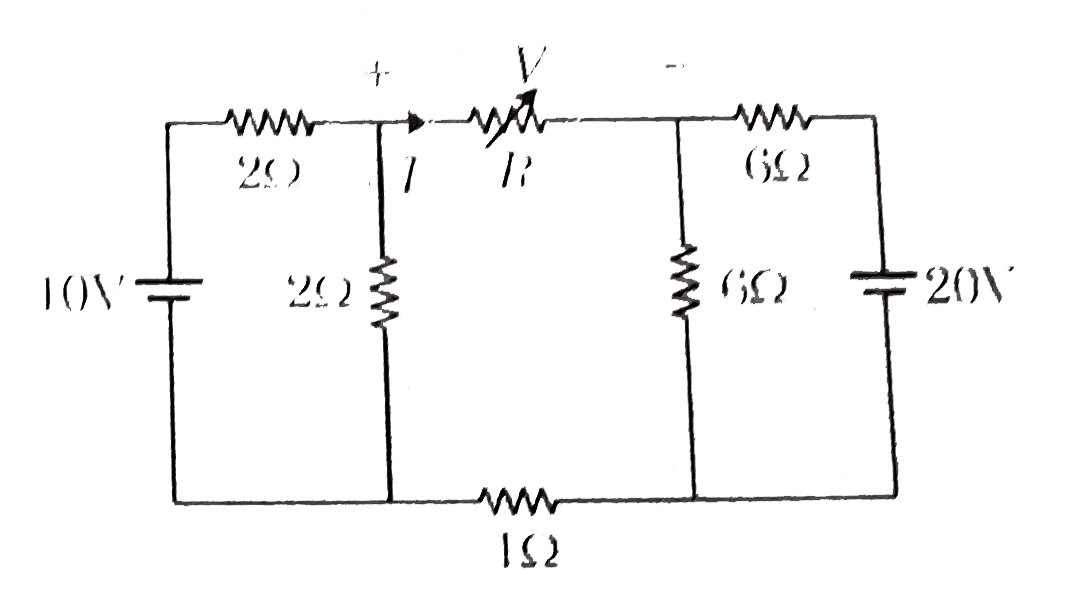
Consider circuit as shown . Which of the graph best represent V-l relationship across the variable resistance R.
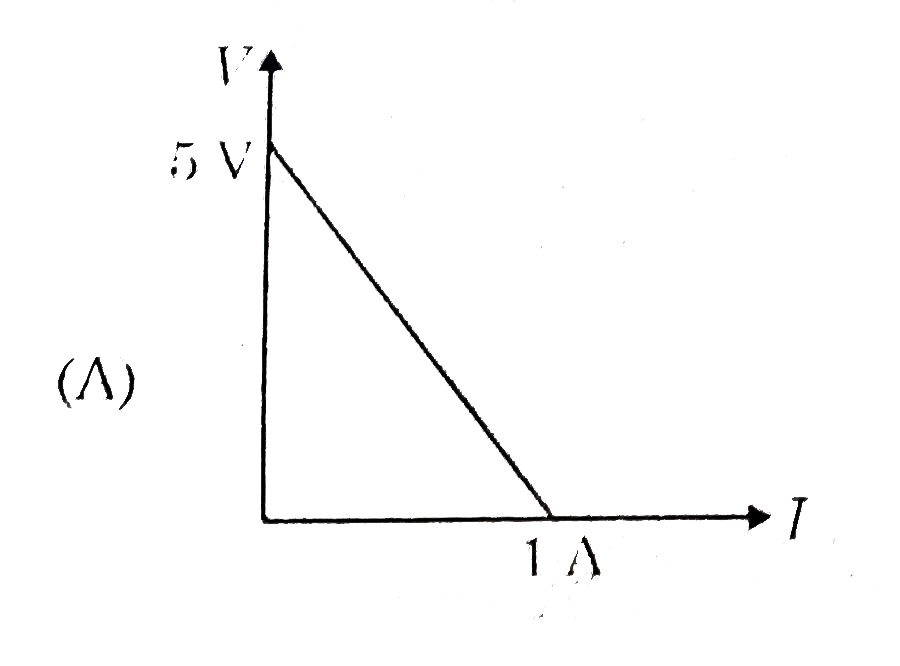
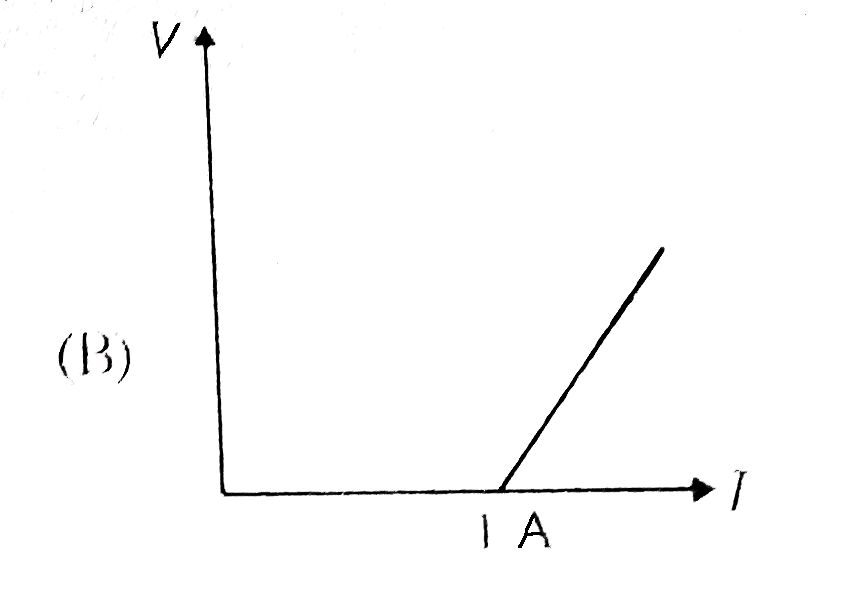
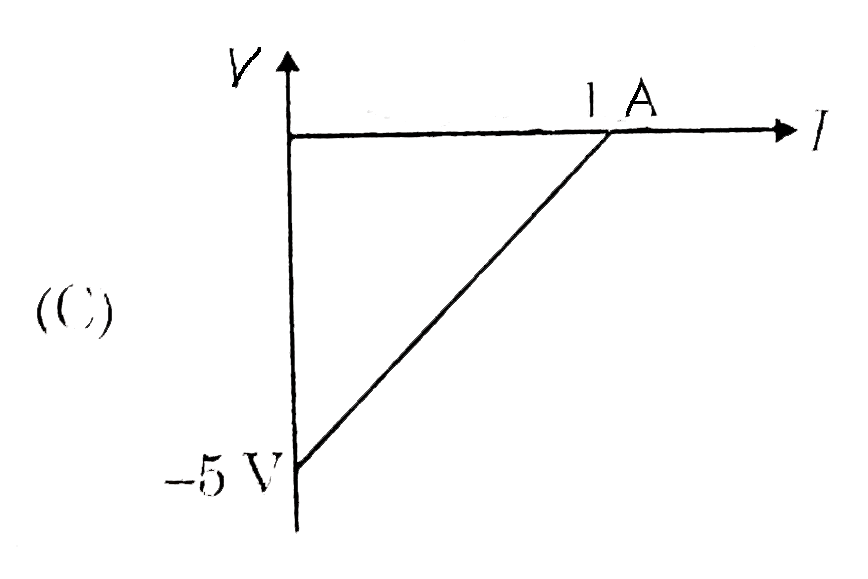
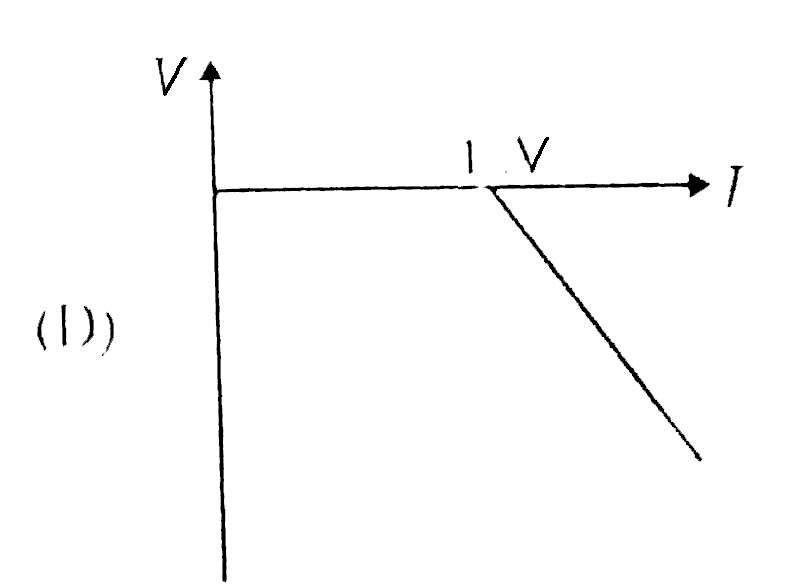
The correct Answer is:A
Step by step video, text & image solution for Consider circuit as shown . Which of the graph best represent V-l relationship across the variable resistance R. by Physics experts to help you in doubts & scoring excellent marks in Class 12 exams.
Similar Questions
Knowledge Check
- Question 1 - Select One
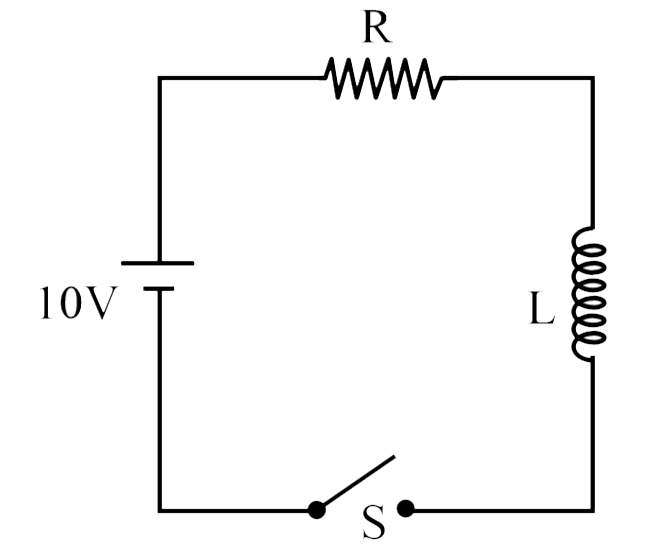
In the circuit shown, the switch is closed at time t = 0.
Which of the graphs shown below best represents the voltage across the inductor, as seen on an oscilloscope ?
 AIBIICIIIDIV
 - Question 2 - Select One
Which of the graphs shown in the figure below best represents the relationship between the radioactive decay rare [−(dN/dt)] and population N?
A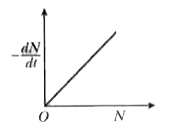 B
B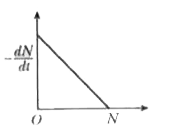 C
C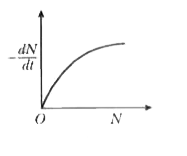 D
D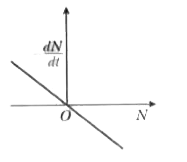
- Question 3 - Select One
A battery consists of a variable number n of identical cells having internal resistance connected in series. The terminals of the battery are short circuited and the current I measured. Which one of the graph below shows the correct relationship between I and n?
A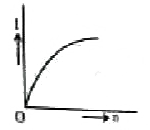 B
B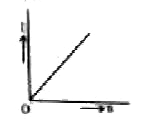 C
C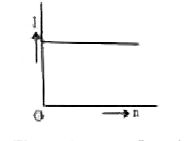 D
D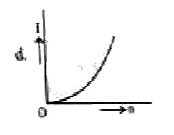
The graph shown the variation with times t of the velocity v of an object . Which one of the following graphs best represents the variation of acceleration a of the object with time t?
 View Solution
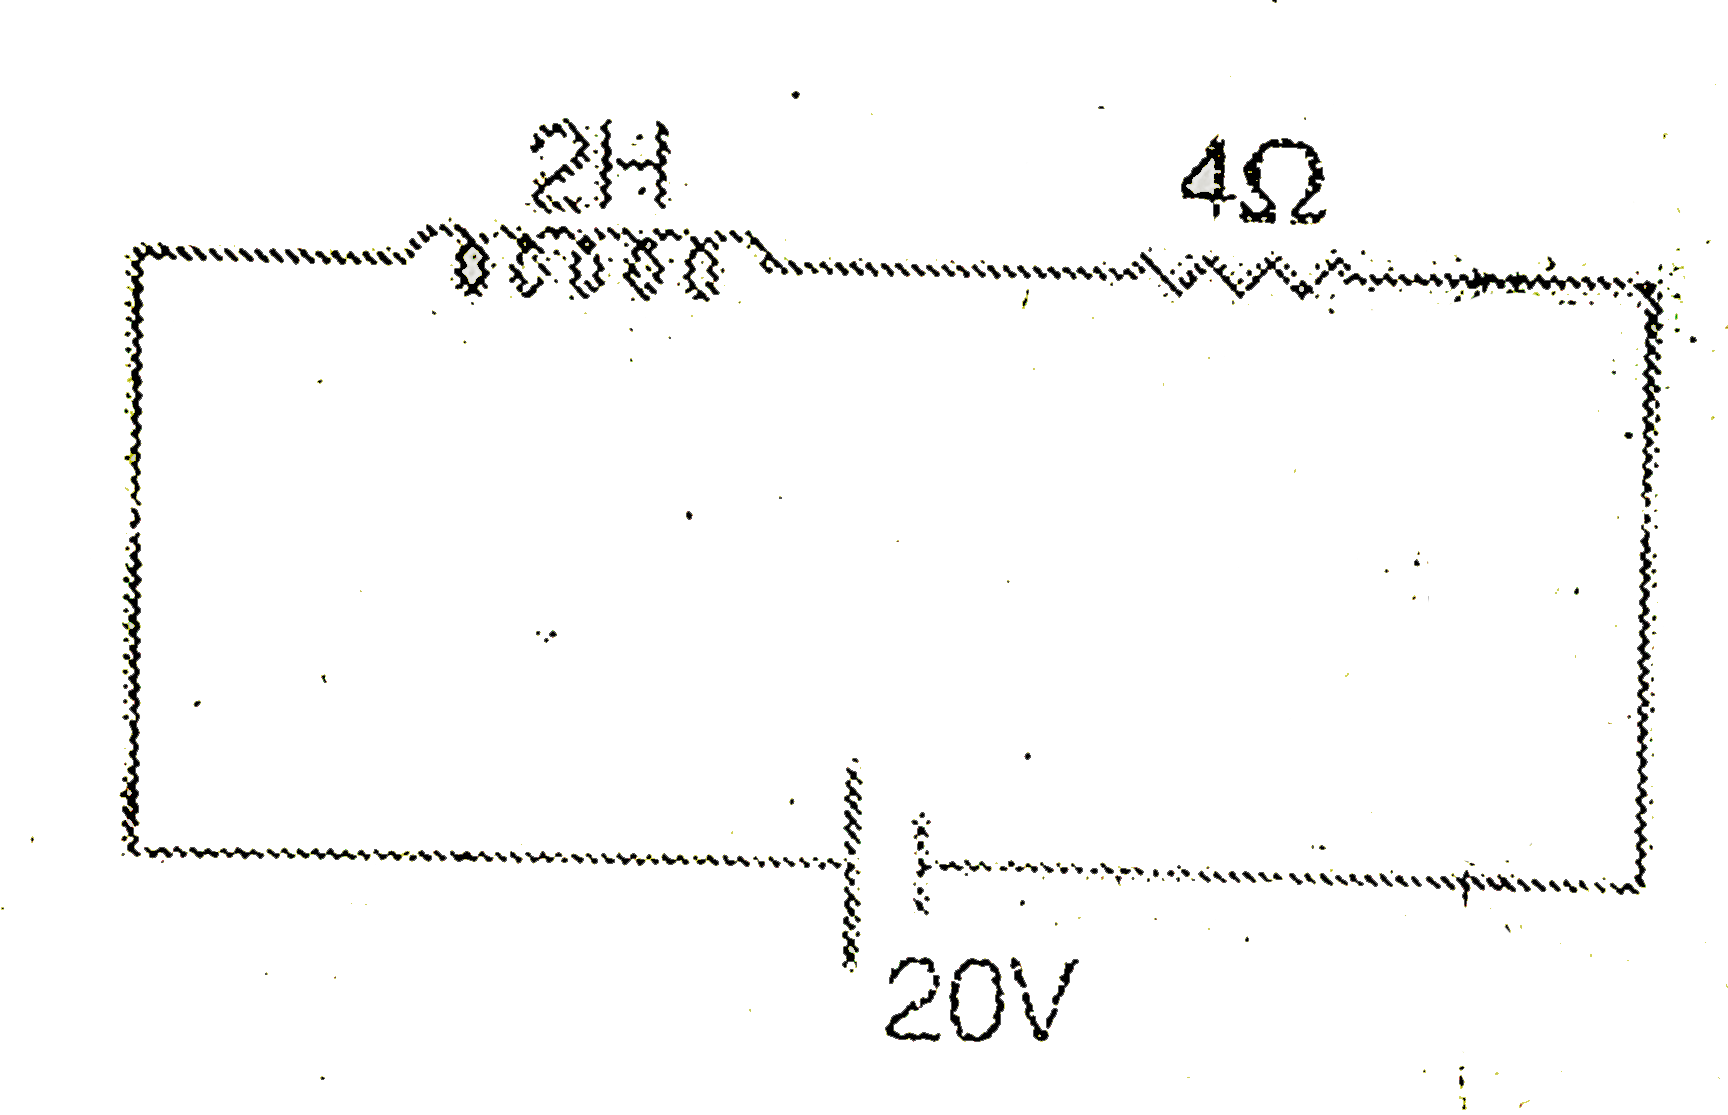
In the L-R circuit as shown in figure, potential difference across the resistance at some instant is 4 V. Then
 View Solution
In the circuit shown in figure resistance of each wire is r. Net resistance across
 View Solution
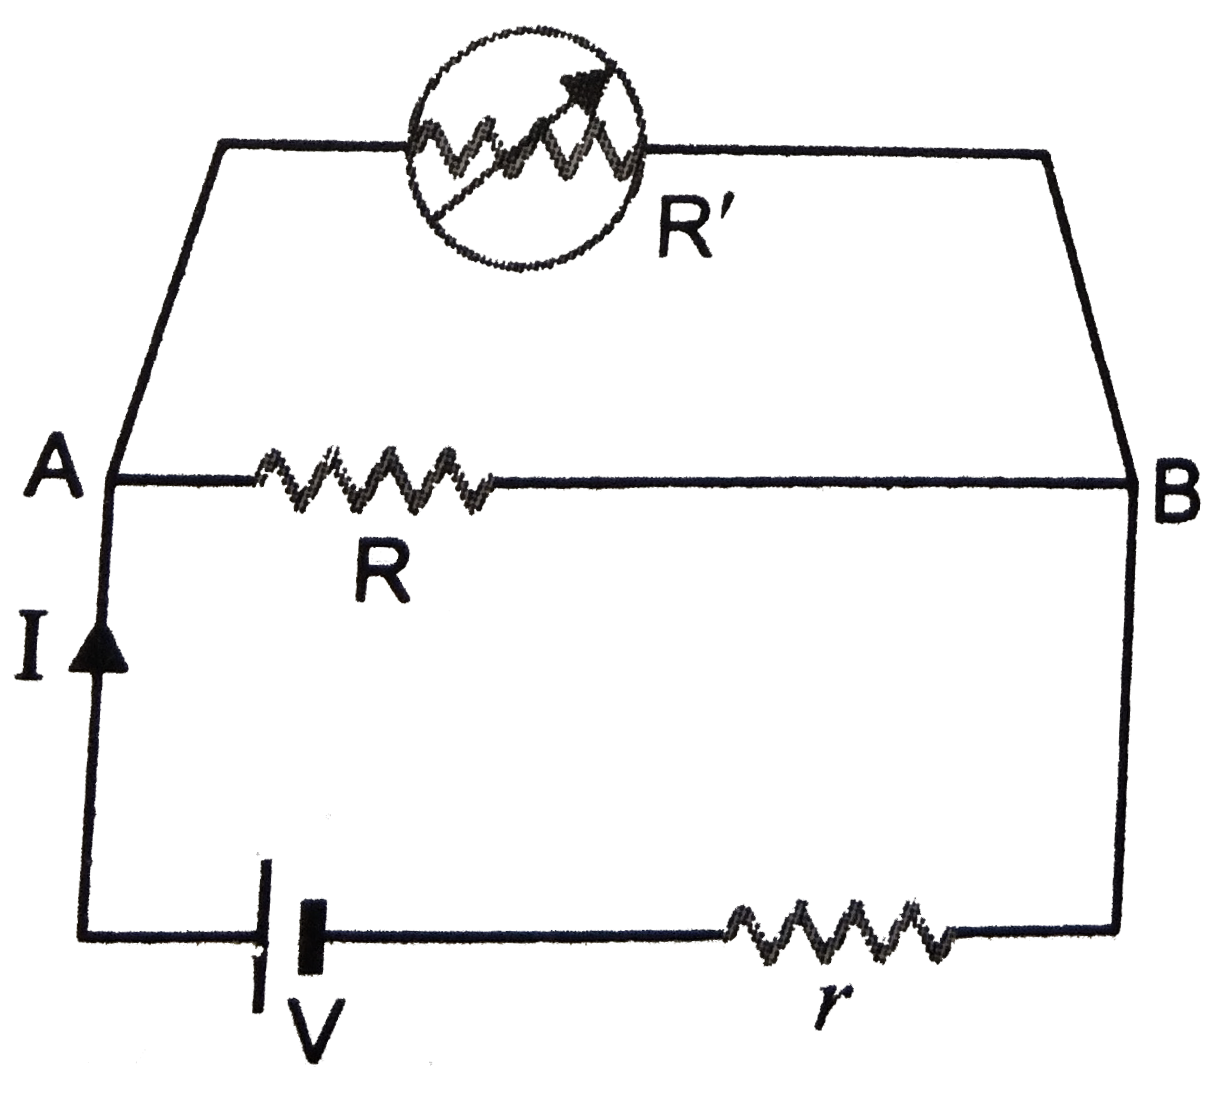
Consider a simple circuit shown in Fig. 2(ET).2. stands for a variable resistance R'.R' can vary from R0 to infinity. r is internal resistance of the battery (r<<R<<lR0)
 View Solution
Two variables x and y very such that xy = constant.
Which of the following graphs represent the above relationship ?View Solution


