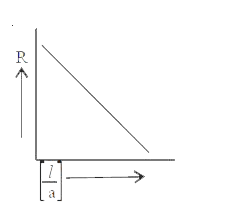
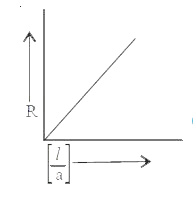
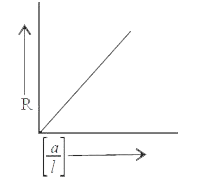
A constant potential difference is applied across a resistance. Consider variation of resistance with temperature. Which graph represents best the variation of power produced in resistance versus resistance?
A

B

C

D

Text Solution
The correct Answer is:B
P=V2R or P∝1R
|
Topper's Solved these Questions
- ELECTRICAL MEASURING INSTRUMENTSBOOK - CENGAGE PHYSICSCHAPTER - ELECTRICAL MEASURING INSTRUMENTSEXERCISE - Multiple Correct
7 Videos
- ELECTRICAL MEASURING INSTRUMENTSBOOK - CENGAGE PHYSICSCHAPTER - ELECTRICAL MEASURING INSTRUMENTSEXERCISE - Assertion-Reasoning
7 Videos
- ELECTRICAL MEASURING INSTRUMENTSBOOK - CENGAGE PHYSICSCHAPTER - ELECTRICAL MEASURING INSTRUMENTSEXERCISE - Subjective
18 Videos
- ELECTRIC POTENTIALBOOK - CENGAGE PHYSICSCHAPTER - ELECTRIC POTENTIALEXERCISE - DPP 3.5
14 Videos
- ELECTROMAGENTIC INDUCTIONBOOK - CENGAGE PHYSICSCHAPTER - ELECTROMAGENTIC INDUCTIONEXERCISE - QUESTION BANK
40 Videos
Similar Questions
Knowledge Check
The difference in the variation of resistence with temperature in a metel and a semiconductor arises essmially due to the difference in the
Acrystal sturctureBvariation of the number of change carriers with tempeatureCtype of bondingDvariation of scattaring mechanism with temperatureVariation of resistance with cell constant is given in which of these graphs?
A B
B C
C D
D
If the potential difference applied across a variable resistor is constant, draw a graph between the current in the resistor and the resistance.
View SolutionA potential difference of 20 volts is applied across the ends of a resistance of 5 ohms. What current will flow in the resistance?
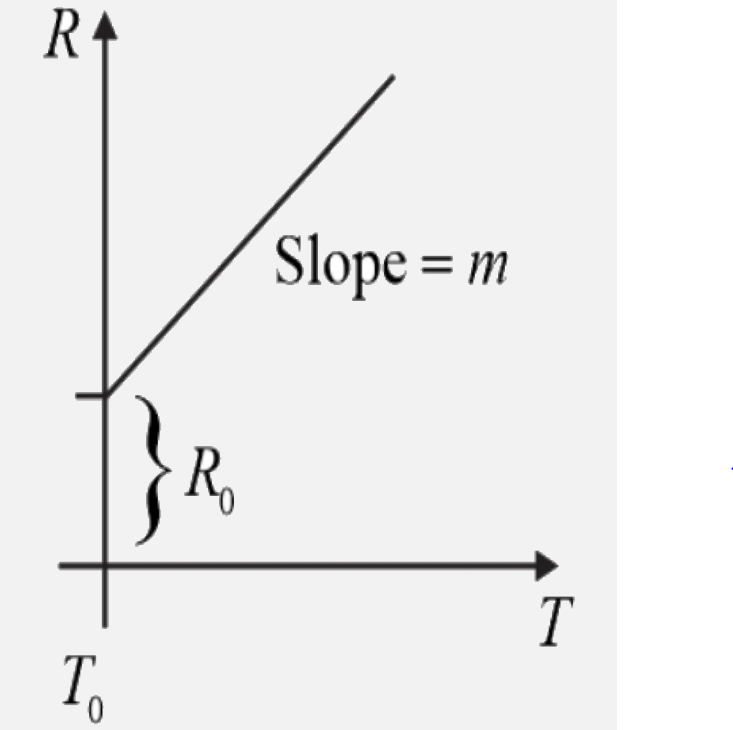
View SolutionVariation of resistance of the conductor with temperature is shown . Temperature coefficient of the conductor is

View SolutionVariation of resistance of the conductor with temperature is shown . Temperature coefficient of the conductor is

View SolutionA potential difference of 100 V is applied across a wire of resistance 50 Ω for one minute. Find the heat produced in joule.
View SolutionVariation of resistance with cell constant is given in which of these graphs?
View Solution
