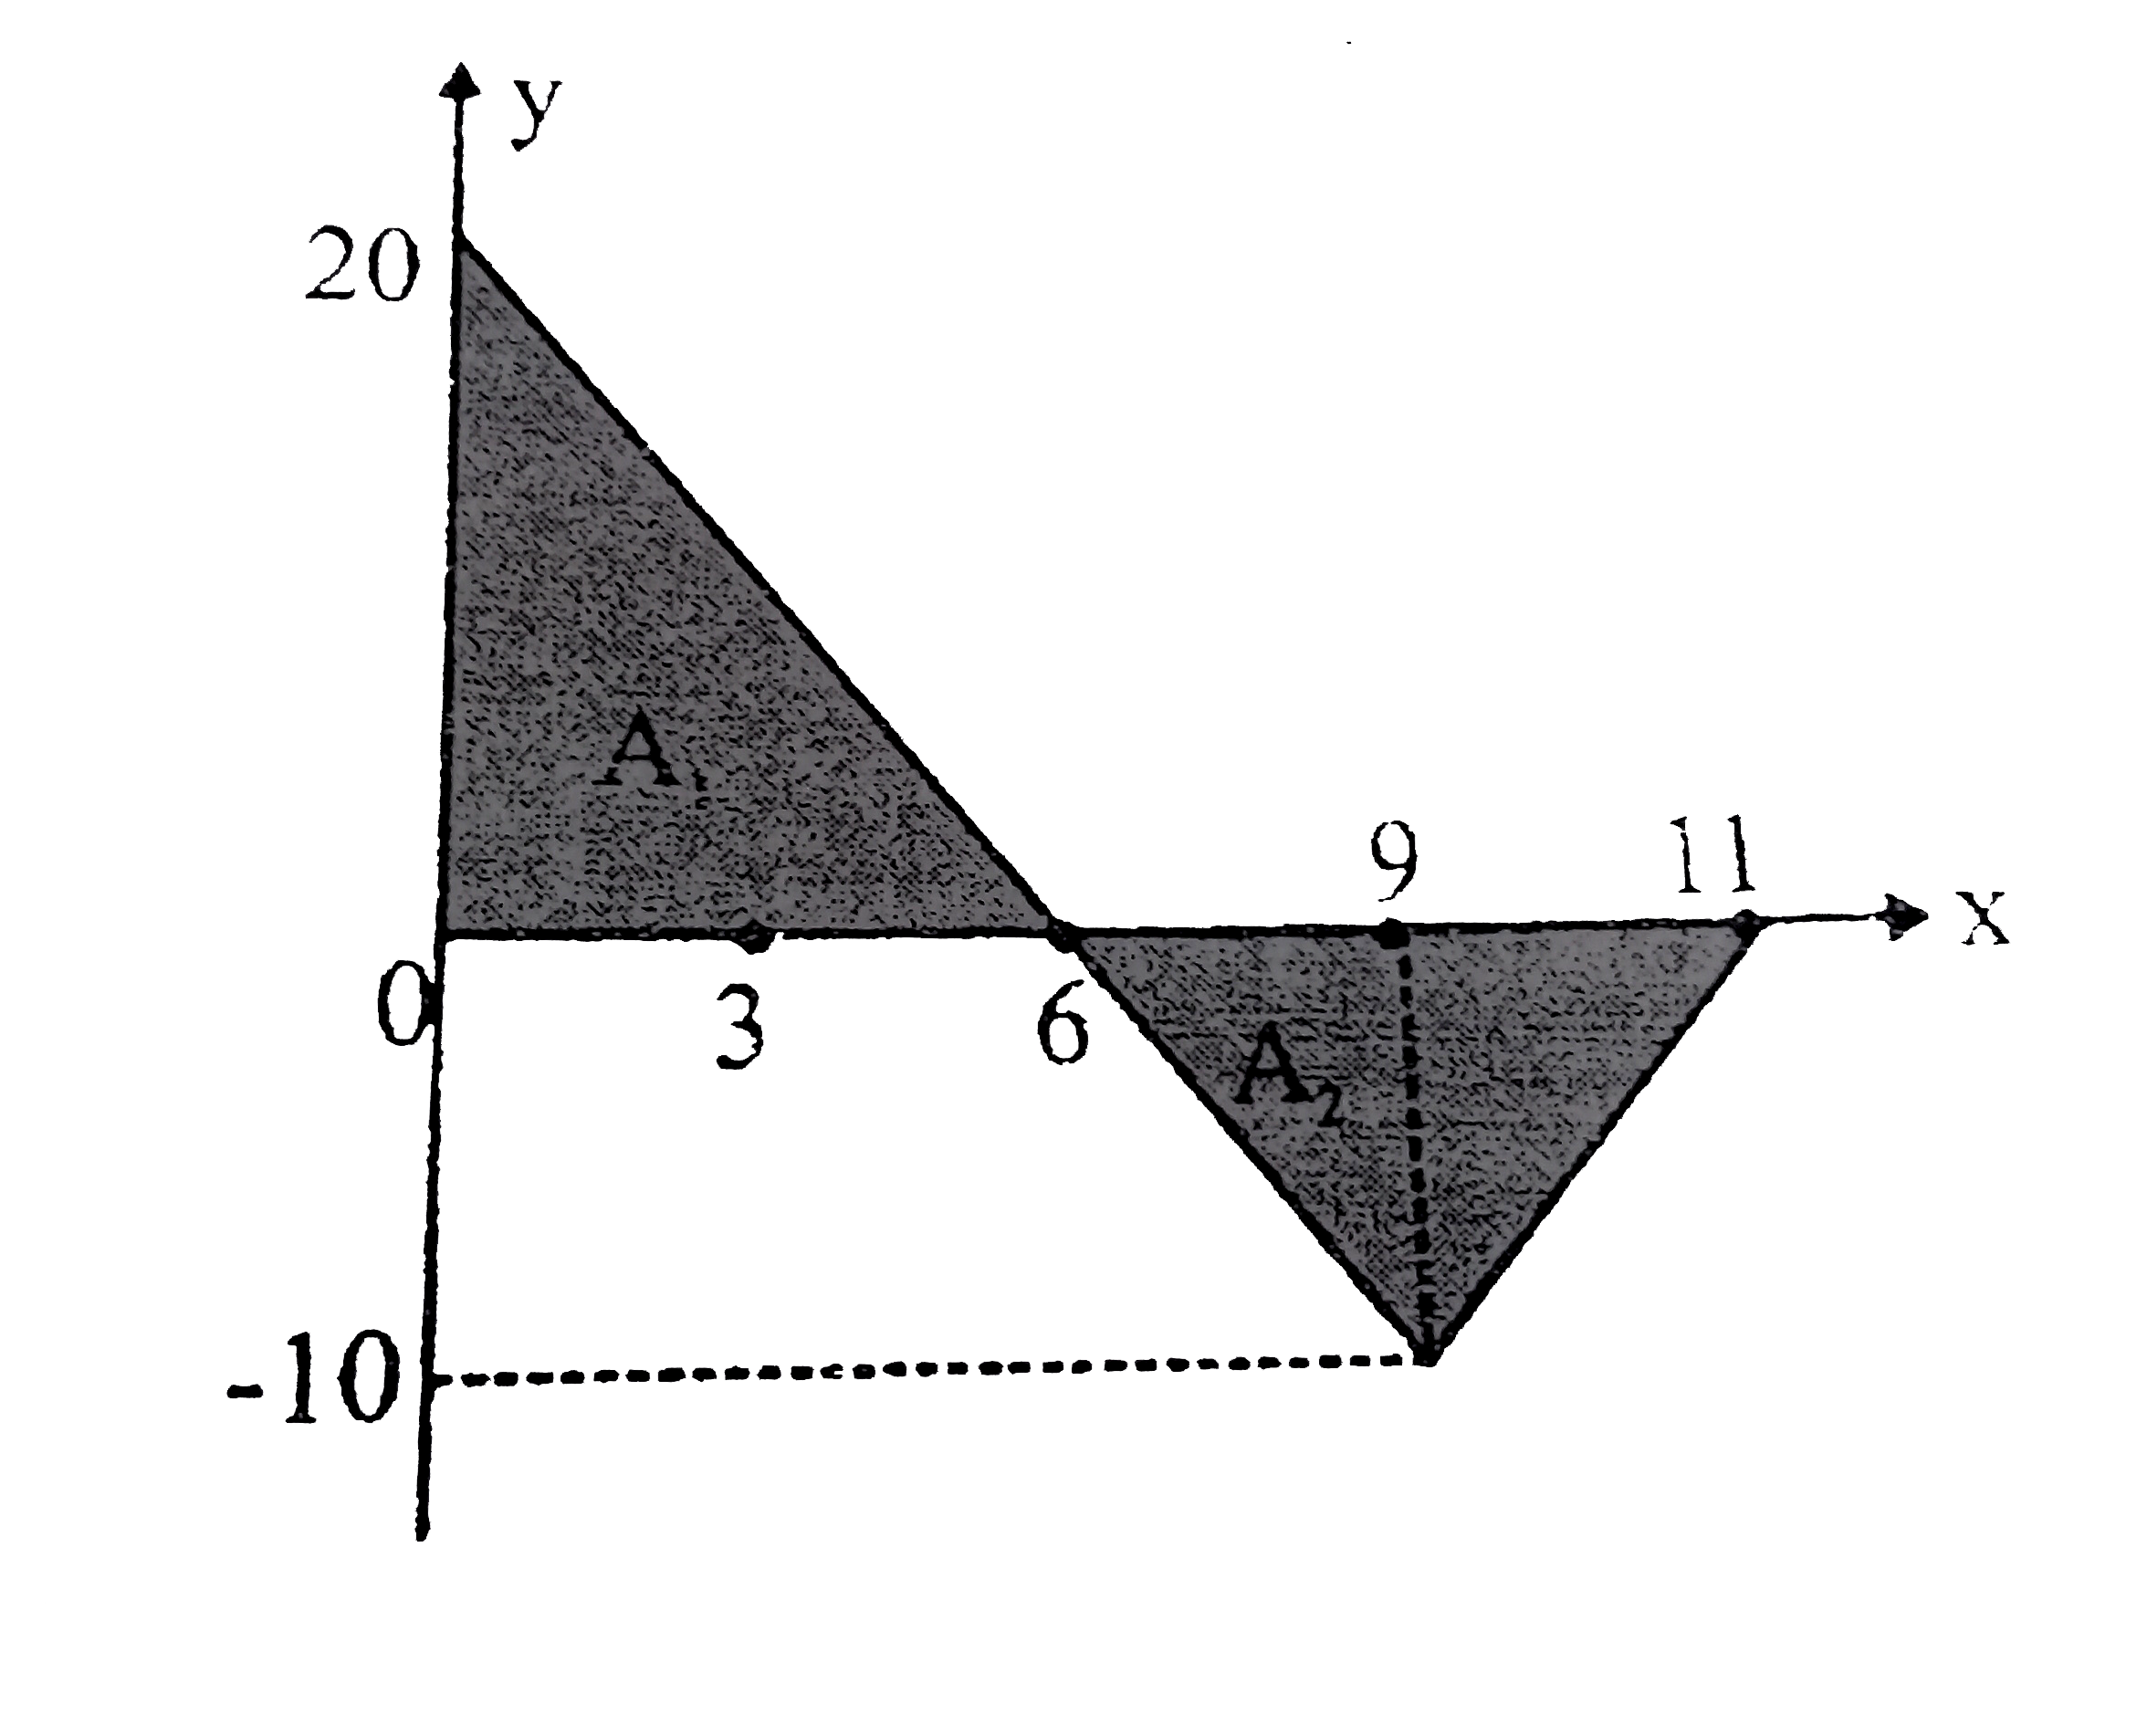
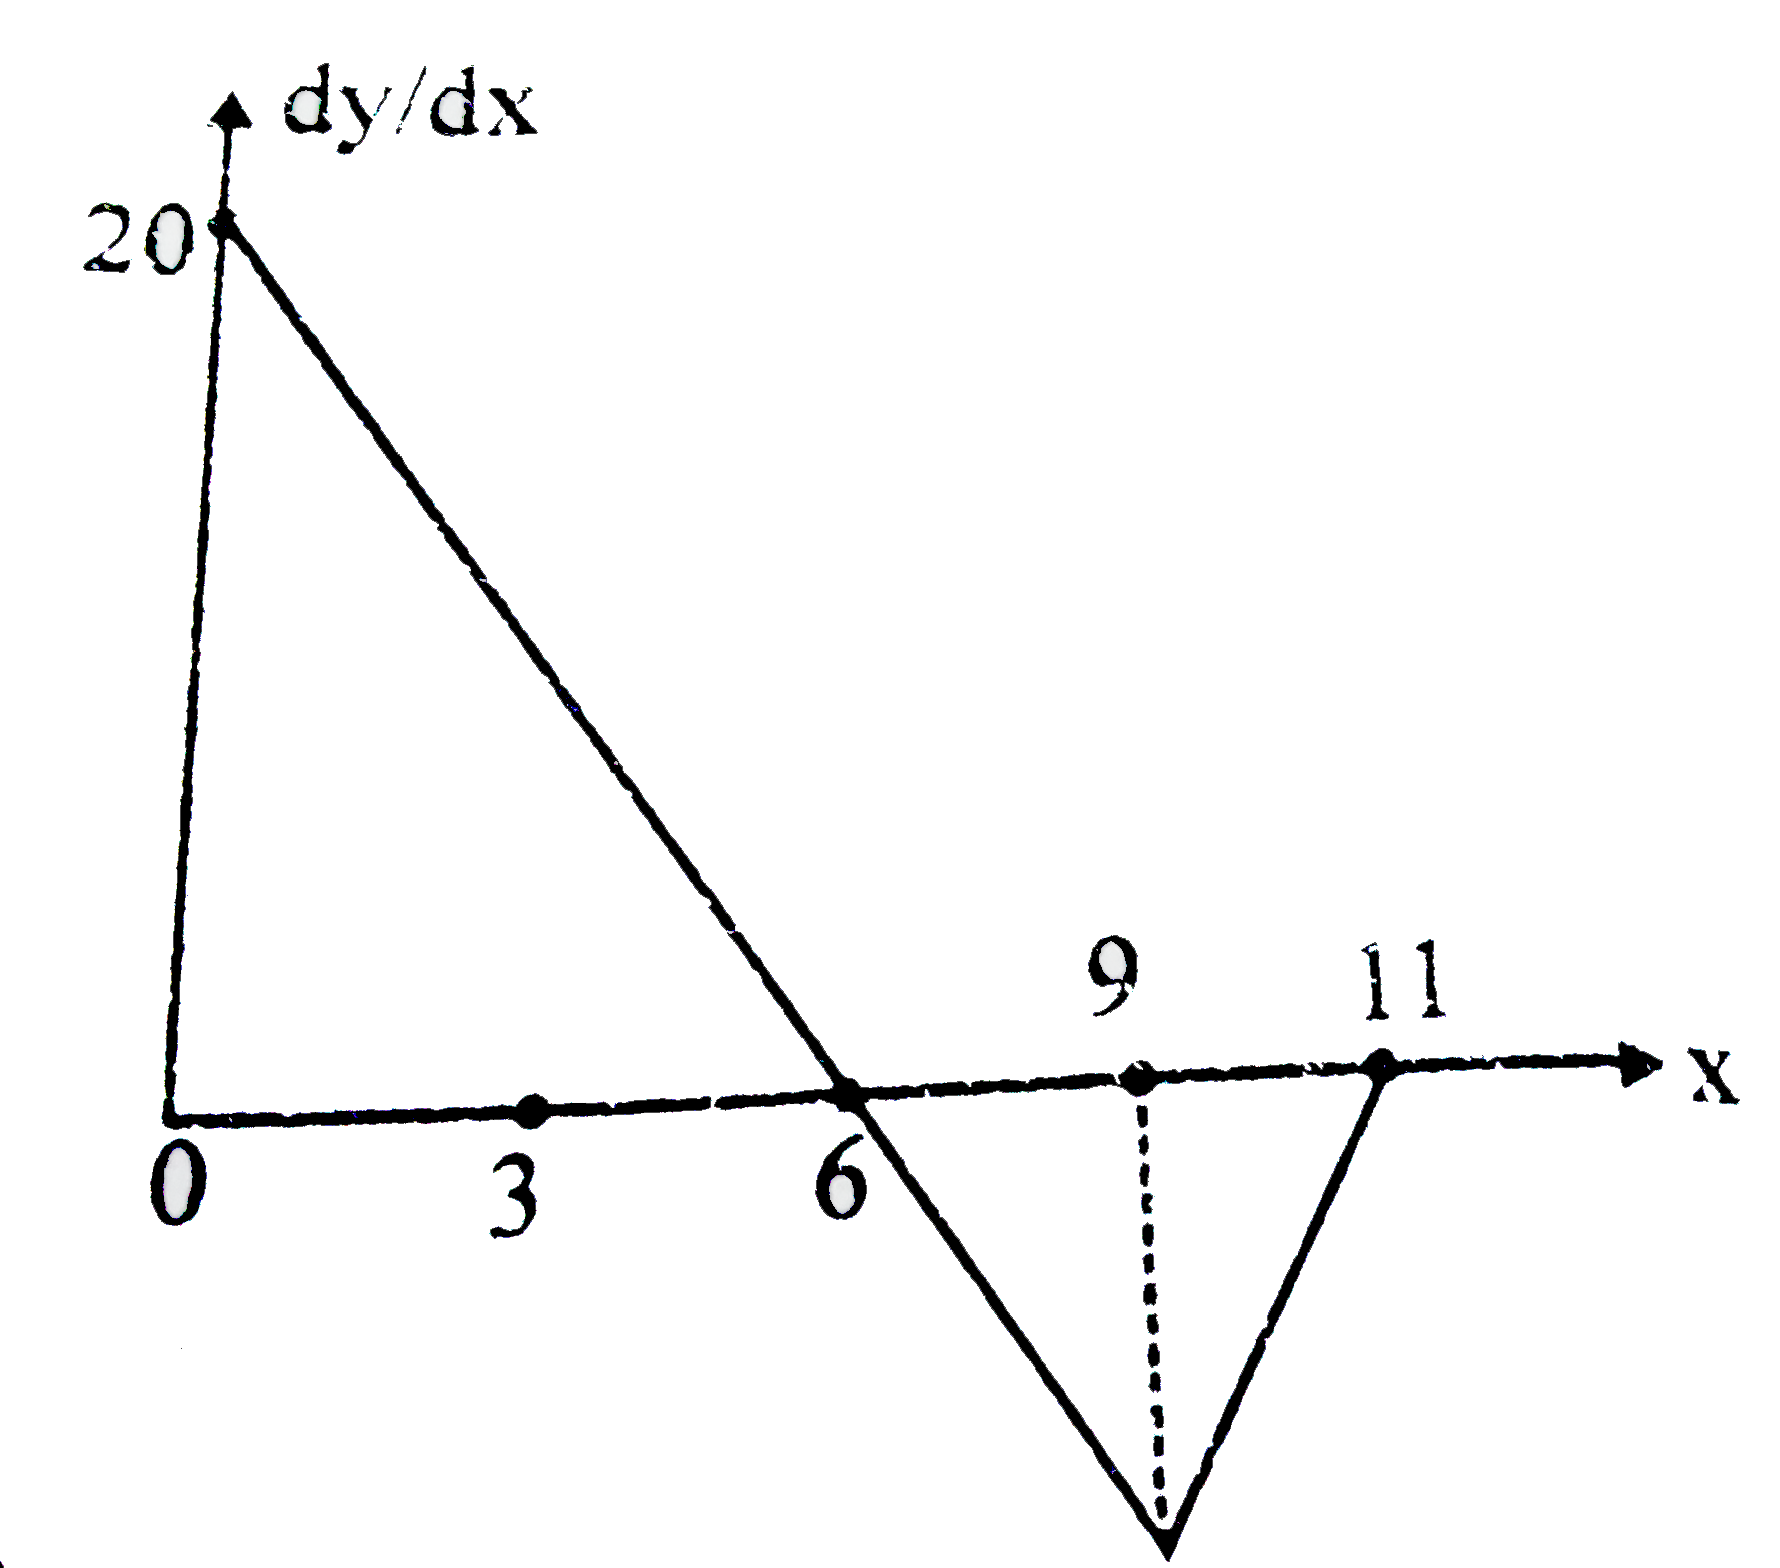
The following curve represent rate of change of a variable y w.r.t. x. The change in the value of y when x changes from 0 to 11 is:

A
60
B
25
C
35
D
85
Video Solution
Text Solution
The correct Answer is:C
As dy=(dydx)dx So Δy=∫dy=11∫0(dydx)dx
Area under the curve
A1=12×6×20=60
A2=−12×(11−6)(10)=−25
Δy=A1+A2=60−25=35

|
Topper's Solved these Questions
- MISCELLANEOUSBOOK - ALLENCHAPTER - MISCELLANEOUSEXERCISE - Part -II Example
61 Videos
- MISCELLANEOUSBOOK - ALLENCHAPTER - MISCELLANEOUSEXERCISE - Part -II Example Some worked out Examples
1 Videos
- KINEMATICS (MOTION ALONG A STRAIGHT LINE AND MOTION IN A PLANE)BOOK - ALLENCHAPTER - KINEMATICS (MOTION ALONG A STRAIGHT LINE AND MOTION IN A PLANE)EXERCISE - BEGINNER S BOX-7
8 Videos
- PHYSICAL WORLD, UNITS AND DIMENSIONS & ERRORS IN MEASUREMENT BOOK - ALLENCHAPTER - PHYSICAL WORLD, UNITS AND DIMENSIONS & ERRORS IN MEASUREMENT EXERCISE - EXERCISE-IV
8 Videos
Similar Questions
Knowledge Check
The following curve represent rate of change of a variable y w.r.t. x. The charge in the value of y when x changes from 0 to 11 is :
 A60B25C35D85
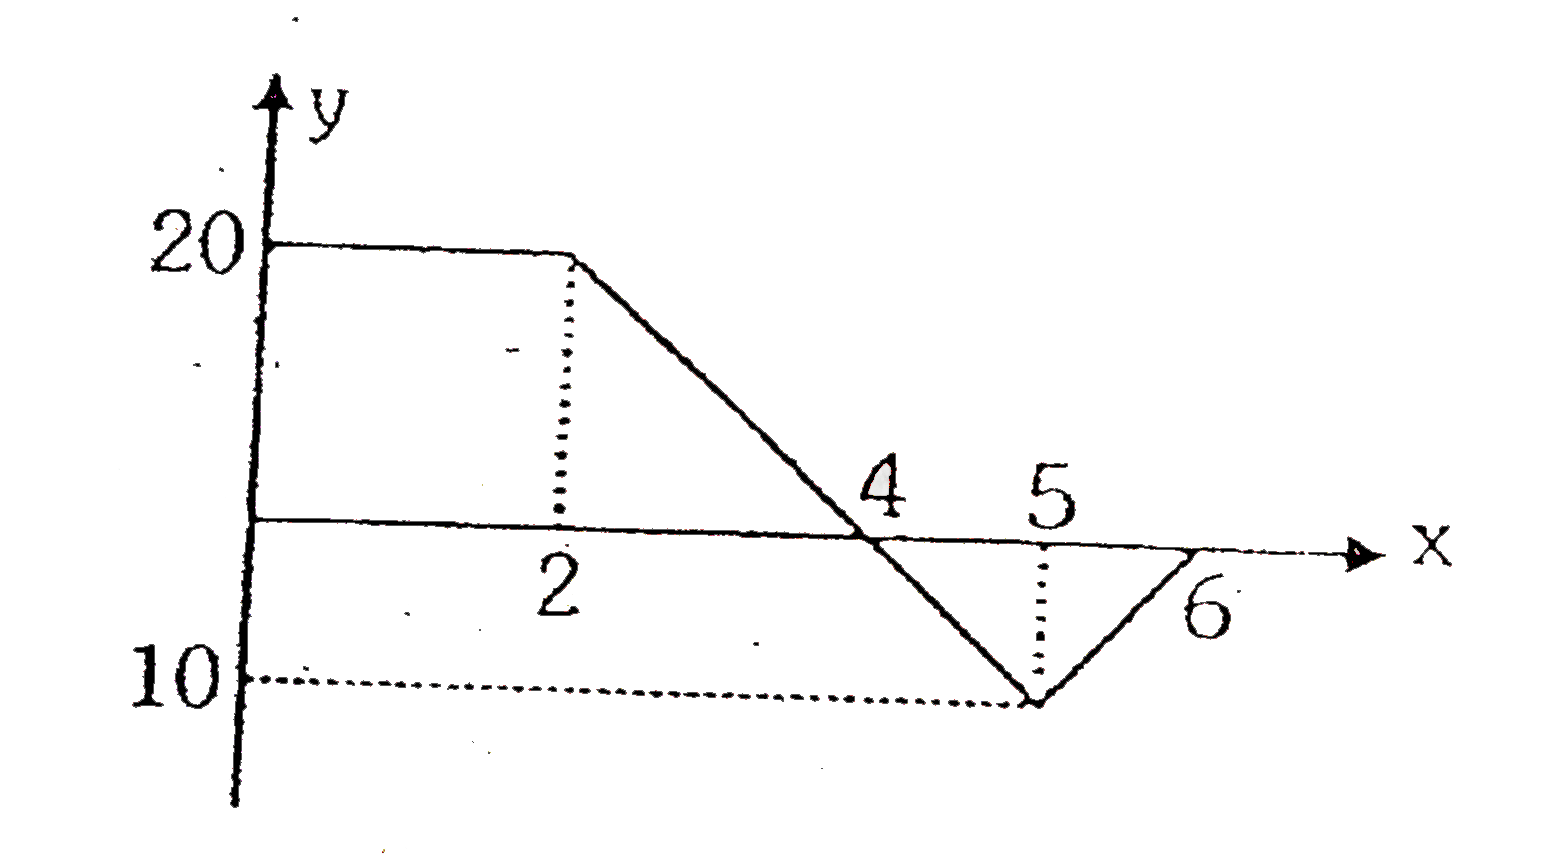
The following curve represents a function y=f(x). Find average value of y when x changes from 0 to 6
 A(20)/(3)B(25)/(3)C(35)/(3)D(40)/(3)
What is the rate of change of √x2+16 w.r.t. x2 at x=3 ?
A15B110C120D115
For curve y=x22−2x+5, the rate of change of y is twice the rate of change of x , then value of x is
View SolutionFor curve y=x22−2x+5 the rate of change of y is twice the rate of change of x ,then value of x is
View SolutionFind the rate of change of y with respect to x, when x=1, given that y=x2
View SolutionFind the rate of change of y with respect to x, when x=1, given that y=x2
View SolutionIf a spherical balloon has a variable diameter (3x+9/2)., then the rate of change of its volume w. r. t x is
View Solution
