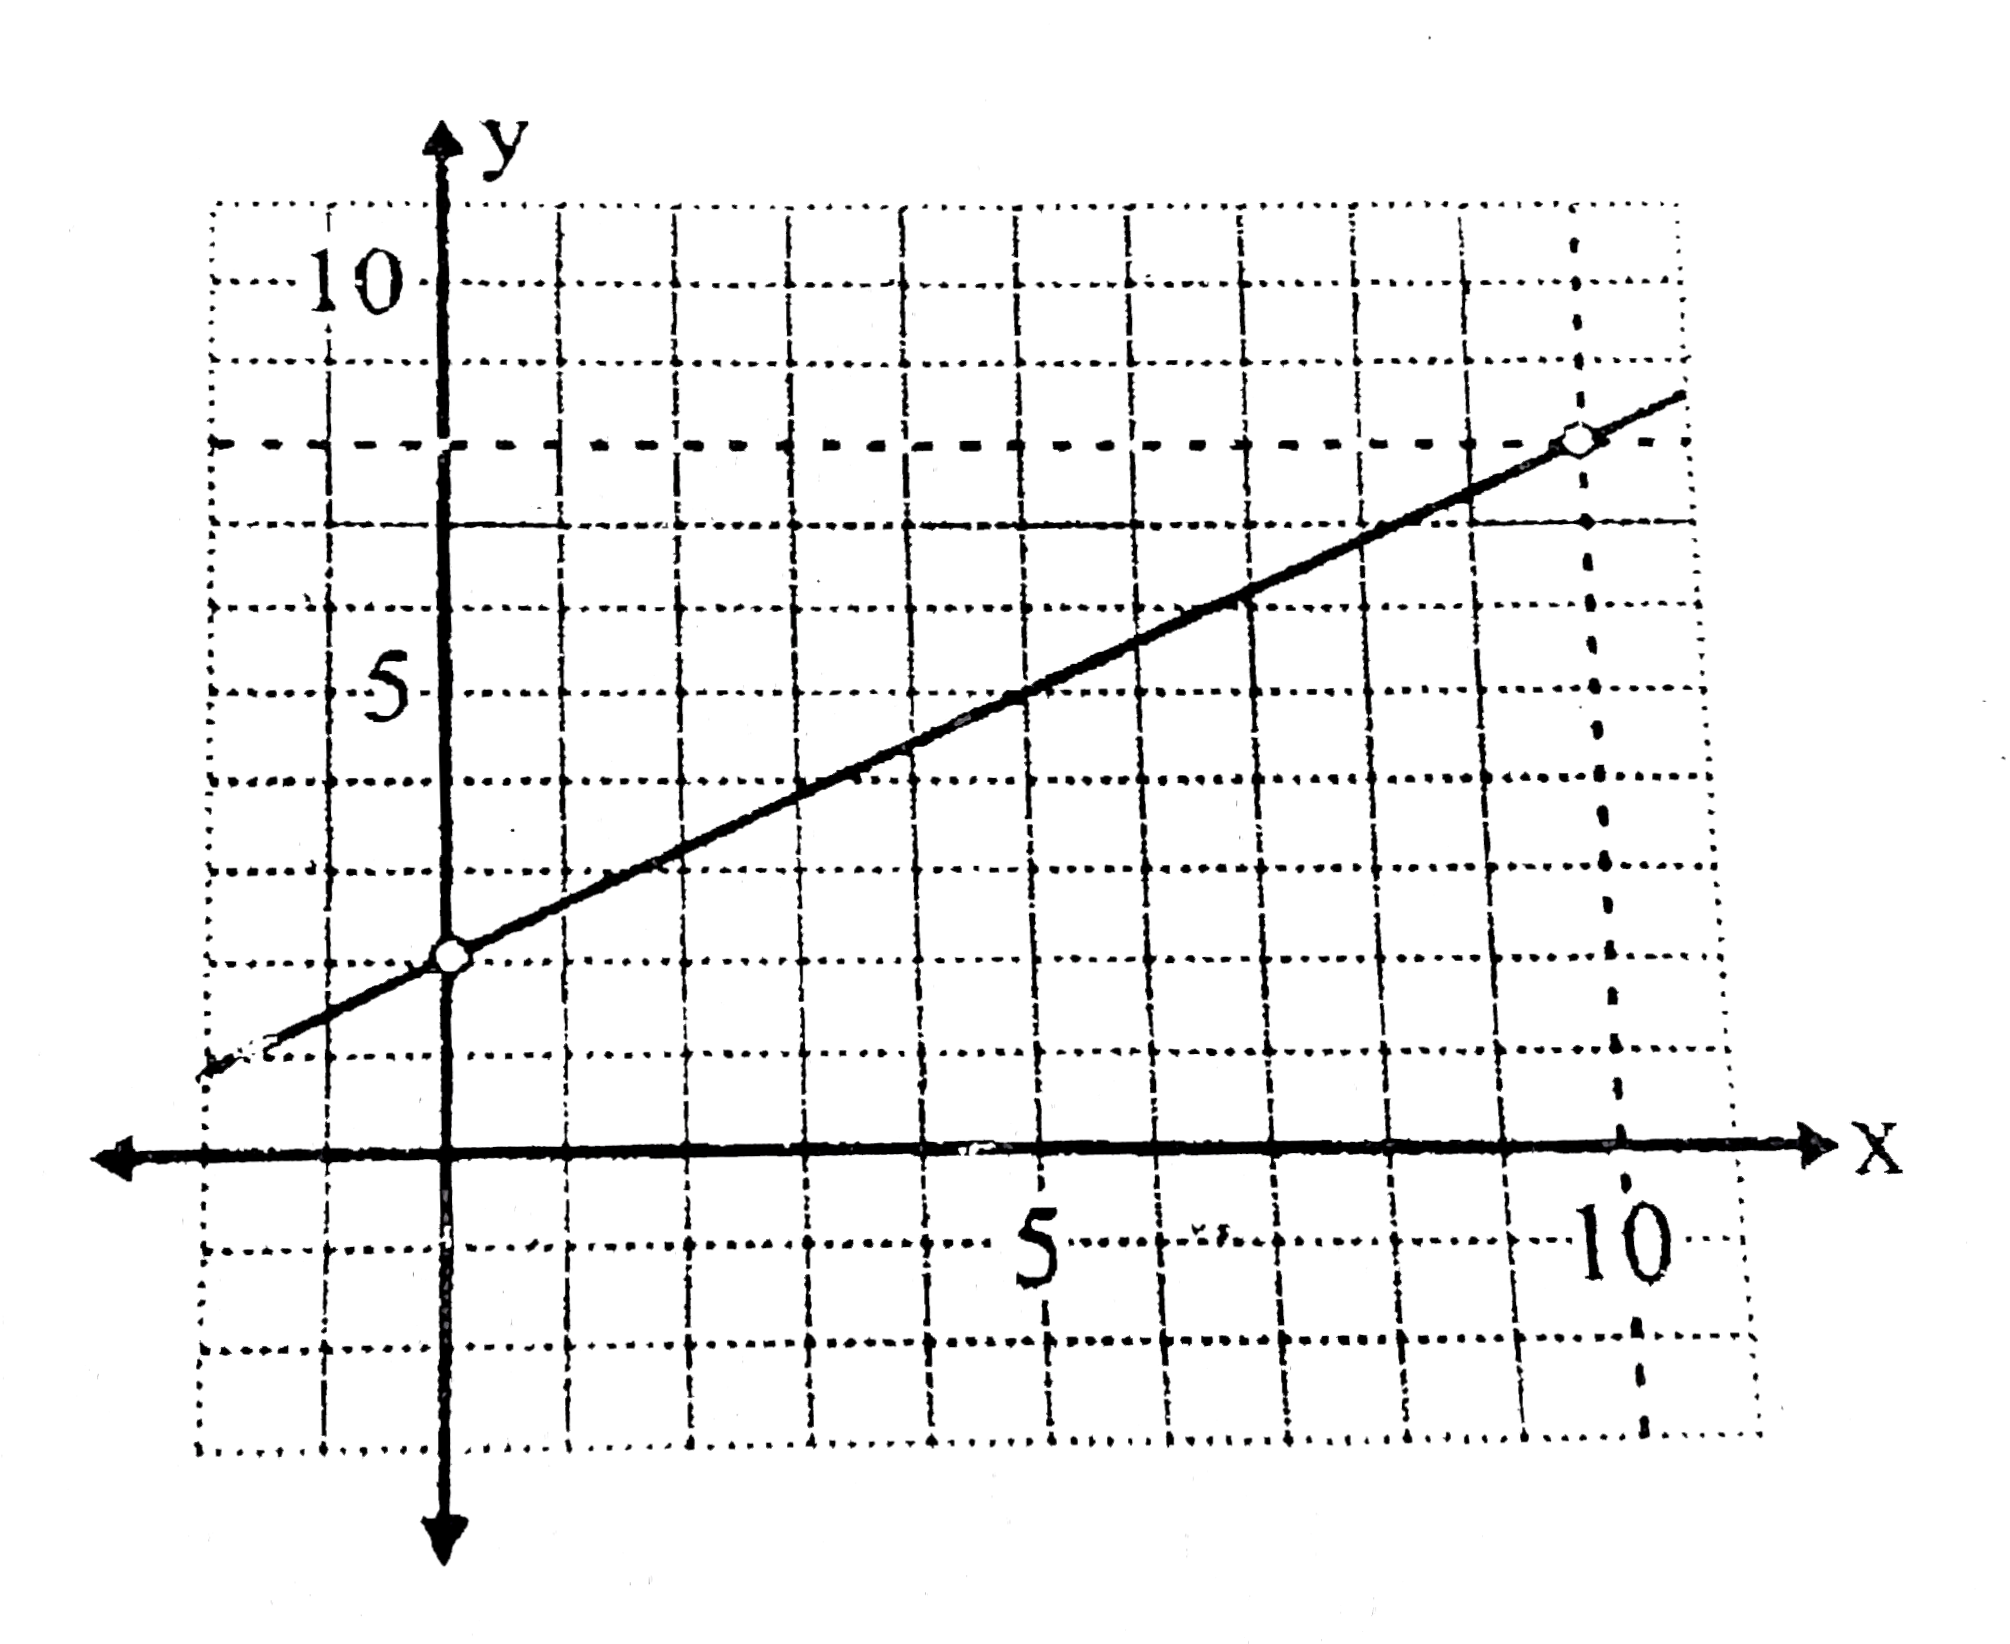
A variable y increases from y1=2 to y2=8 linearly with another variable x in the interval x1=0 to x2=10. Express y as function of x and draw its graph.
Video Solution
Text Solution
The correct Answer is:intercept is c=2. Now the required equation is y=35x+2
Linear variation is represented by a linear equation of the form y=mx+c. To repersent the function on graph we have to join two points whose coordinates are (x1,y1) and (x2,y2) i.e. (0,2) and (10,8).
Slope of the line is m=y2−y1x2−x1=8−210−0=35

|
Updated on:21/07/2023
Topper's Solved these Questions
- BOOK - ALLENCHAPTER - MISCELLANEOUSEXERCISE - Part -II Example61videos
MISCELLANEOUS
- BOOK - ALLENCHAPTER - MISCELLANEOUSEXERCISE - Part -II Example Some worked out Examples1videos
MISCELLANEOUS
- BOOK - ALLENCHAPTER - KINEMATICS (MOTION ALONG A STRAIGHT LINE AND MOTION IN A PLANE)EXERCISE - BEGINNER S BOX-78videos
KINEMATICS (MOTION ALONG A STRAIGHT LINE AND MOTION IN A PLANE)
- BOOK - ALLENCHAPTER - PHYSICAL WORLD, UNITS AND DIMENSIONS & ERRORS IN MEASUREMENT EXERCISE - EXERCISE-IV8videos
PHYSICAL WORLD, UNITS AND DIMENSIONS & ERRORS IN MEASUREMENT
Similar Questions
Knowledge Check
- Question 1 - Select One
The coefficient of the variable y in linear equation 5(2x−y)+3x+4y−7=0
A-1B-9C13D9 - Question 2 - Select One
For the variable t, the locus of the points of intersection of lines x−2y=tandx+2y=1t is
Athe straight line x=yBthe circle with centre at the origin and radius 1Cthe ellipse with centre at the origin and one focus (2√5,0)Dthe hyperbola with centre at the origin and one focus (√52,0)
The changes ina function y and the independent variable x are related as dydx=x2. Find y as a function of x.
View SolutionDraw the graph of y=√x2−1
View SolutionDraw the graph for y=({x}−1)2.
View SolutionDraw the graphs of the functions y2=x+1andy2=−x+1 and also find the area bounded by these curves.
View SolutionThe interval of x for which the function y=−x(x−2)2 increases is
View SolutionDraw the graph of y=x−1x−2.
View Solution
