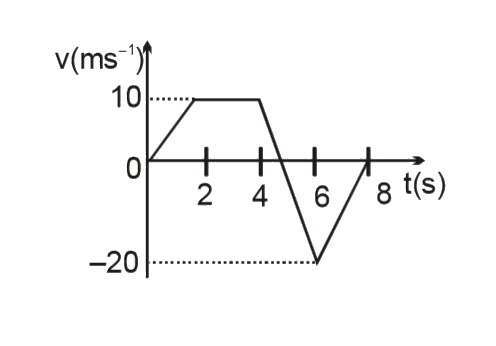
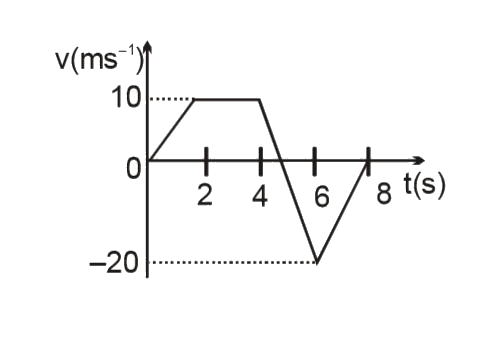
The diagram shows a velocity-time graph for a car moving in a straight line. At point Q the car must be
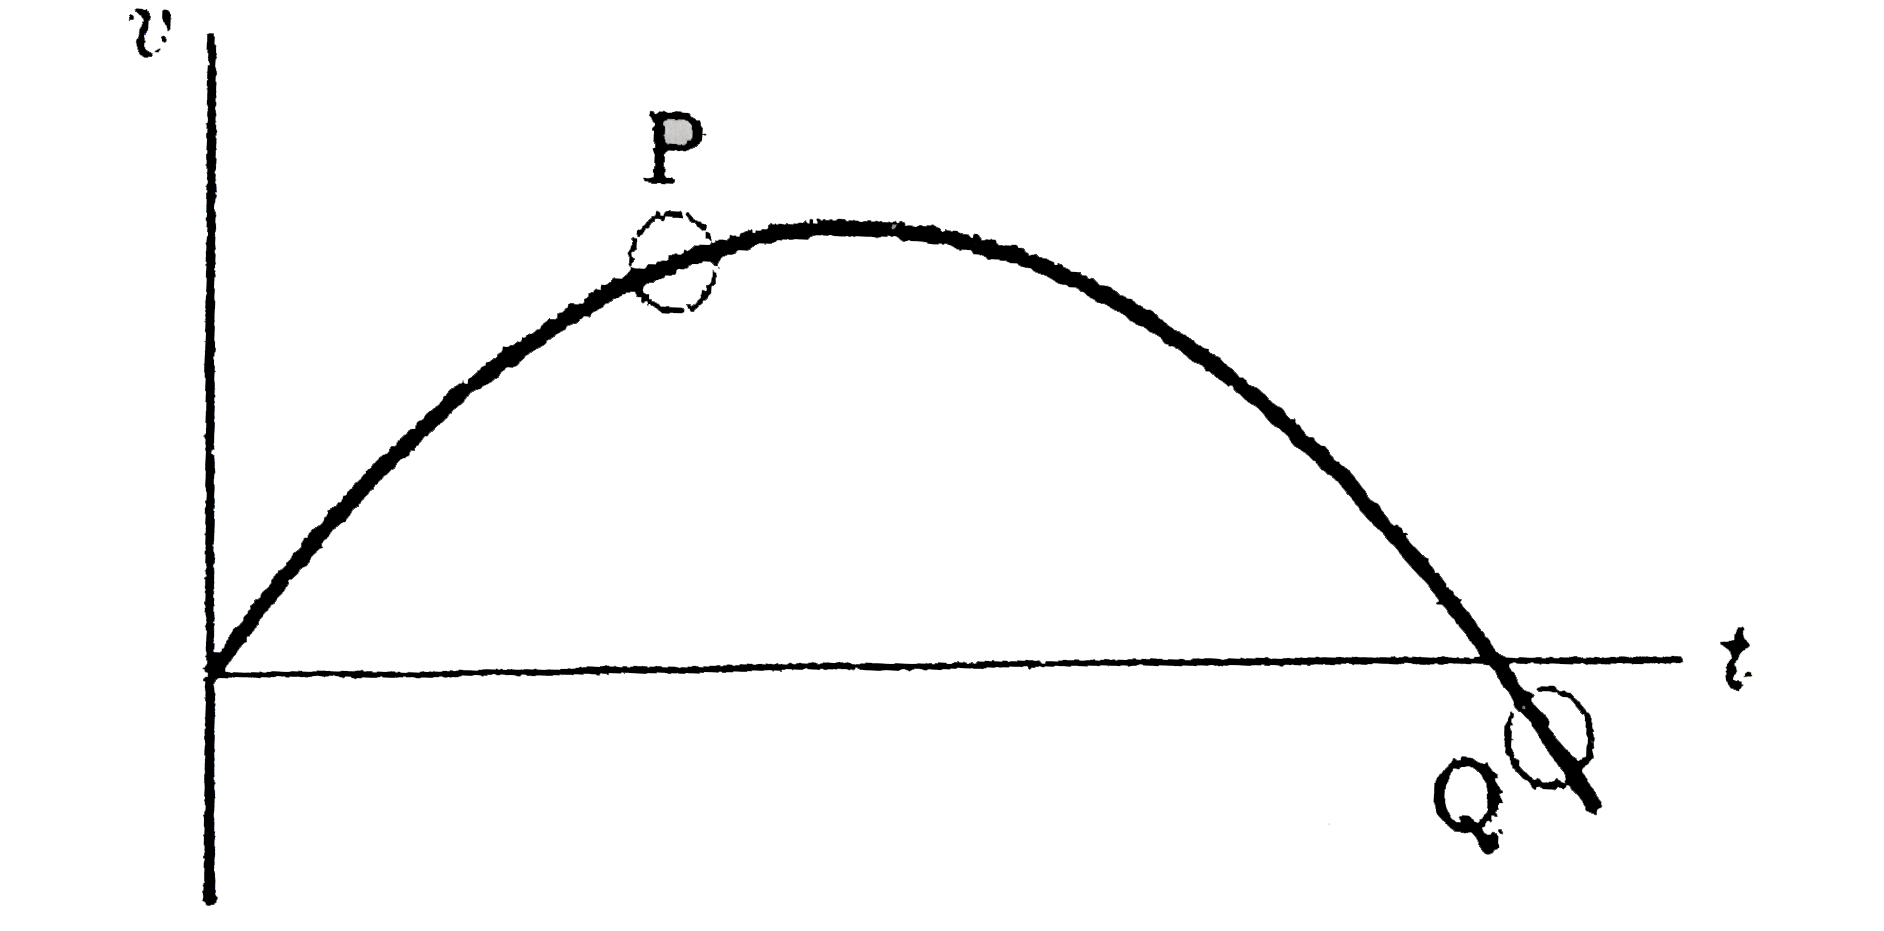
moving the with zero acceleration
travelling in the reverse direction to that at point P
traveling below ground -level
moving with decreasing speed.
The correct Answer is:2
Velocity becomes negative from positive therefore direction is reversed.
Topper's Solved these Questions
- BOOK - BANSALCHAPTER - TEST PAPERSEXERCISE - PHYSICS PART (A)32videos
TEST PAPERS
- BOOK - BANSALCHAPTER - TEST PAPERSEXERCISE - PHYSICS PART (B)3videos
TEST PAPERS
- BOOK - BANSALCHAPTER - TEST PAPERSEXERCISE - PHYSICS PART- C4videos
TEST PAPERS
- BOOK - BANSALCHAPTER - SEMICONDUCTORSEXERCISE - CBSE Question32videos
SEMICONDUCTORS
Similar Questions
Knowledge Check
- Question 1 - Select One
The diagram shows the velocity-time graph for a particle moving in a straight line. The sum of the two shaded areas represents :
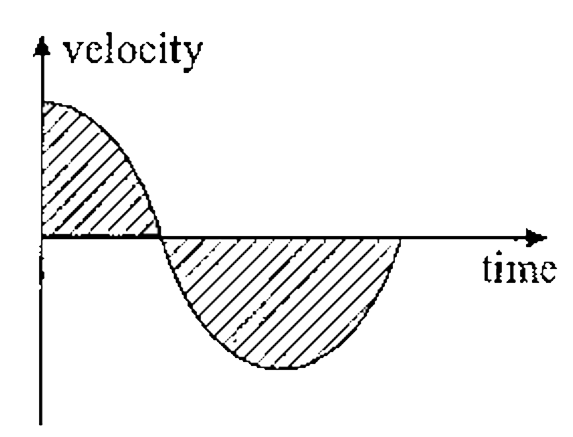 AThe increase in displacement of the particleBThe average velocity of the particleCThe average acceleration ofthe particleDThe distance moved by the particle
 - Question 2 - Select One
The diagram shows the displacement-time graph for a particle moving in a straight line. Find the average velocity for the interval from t=0 to t=5s.
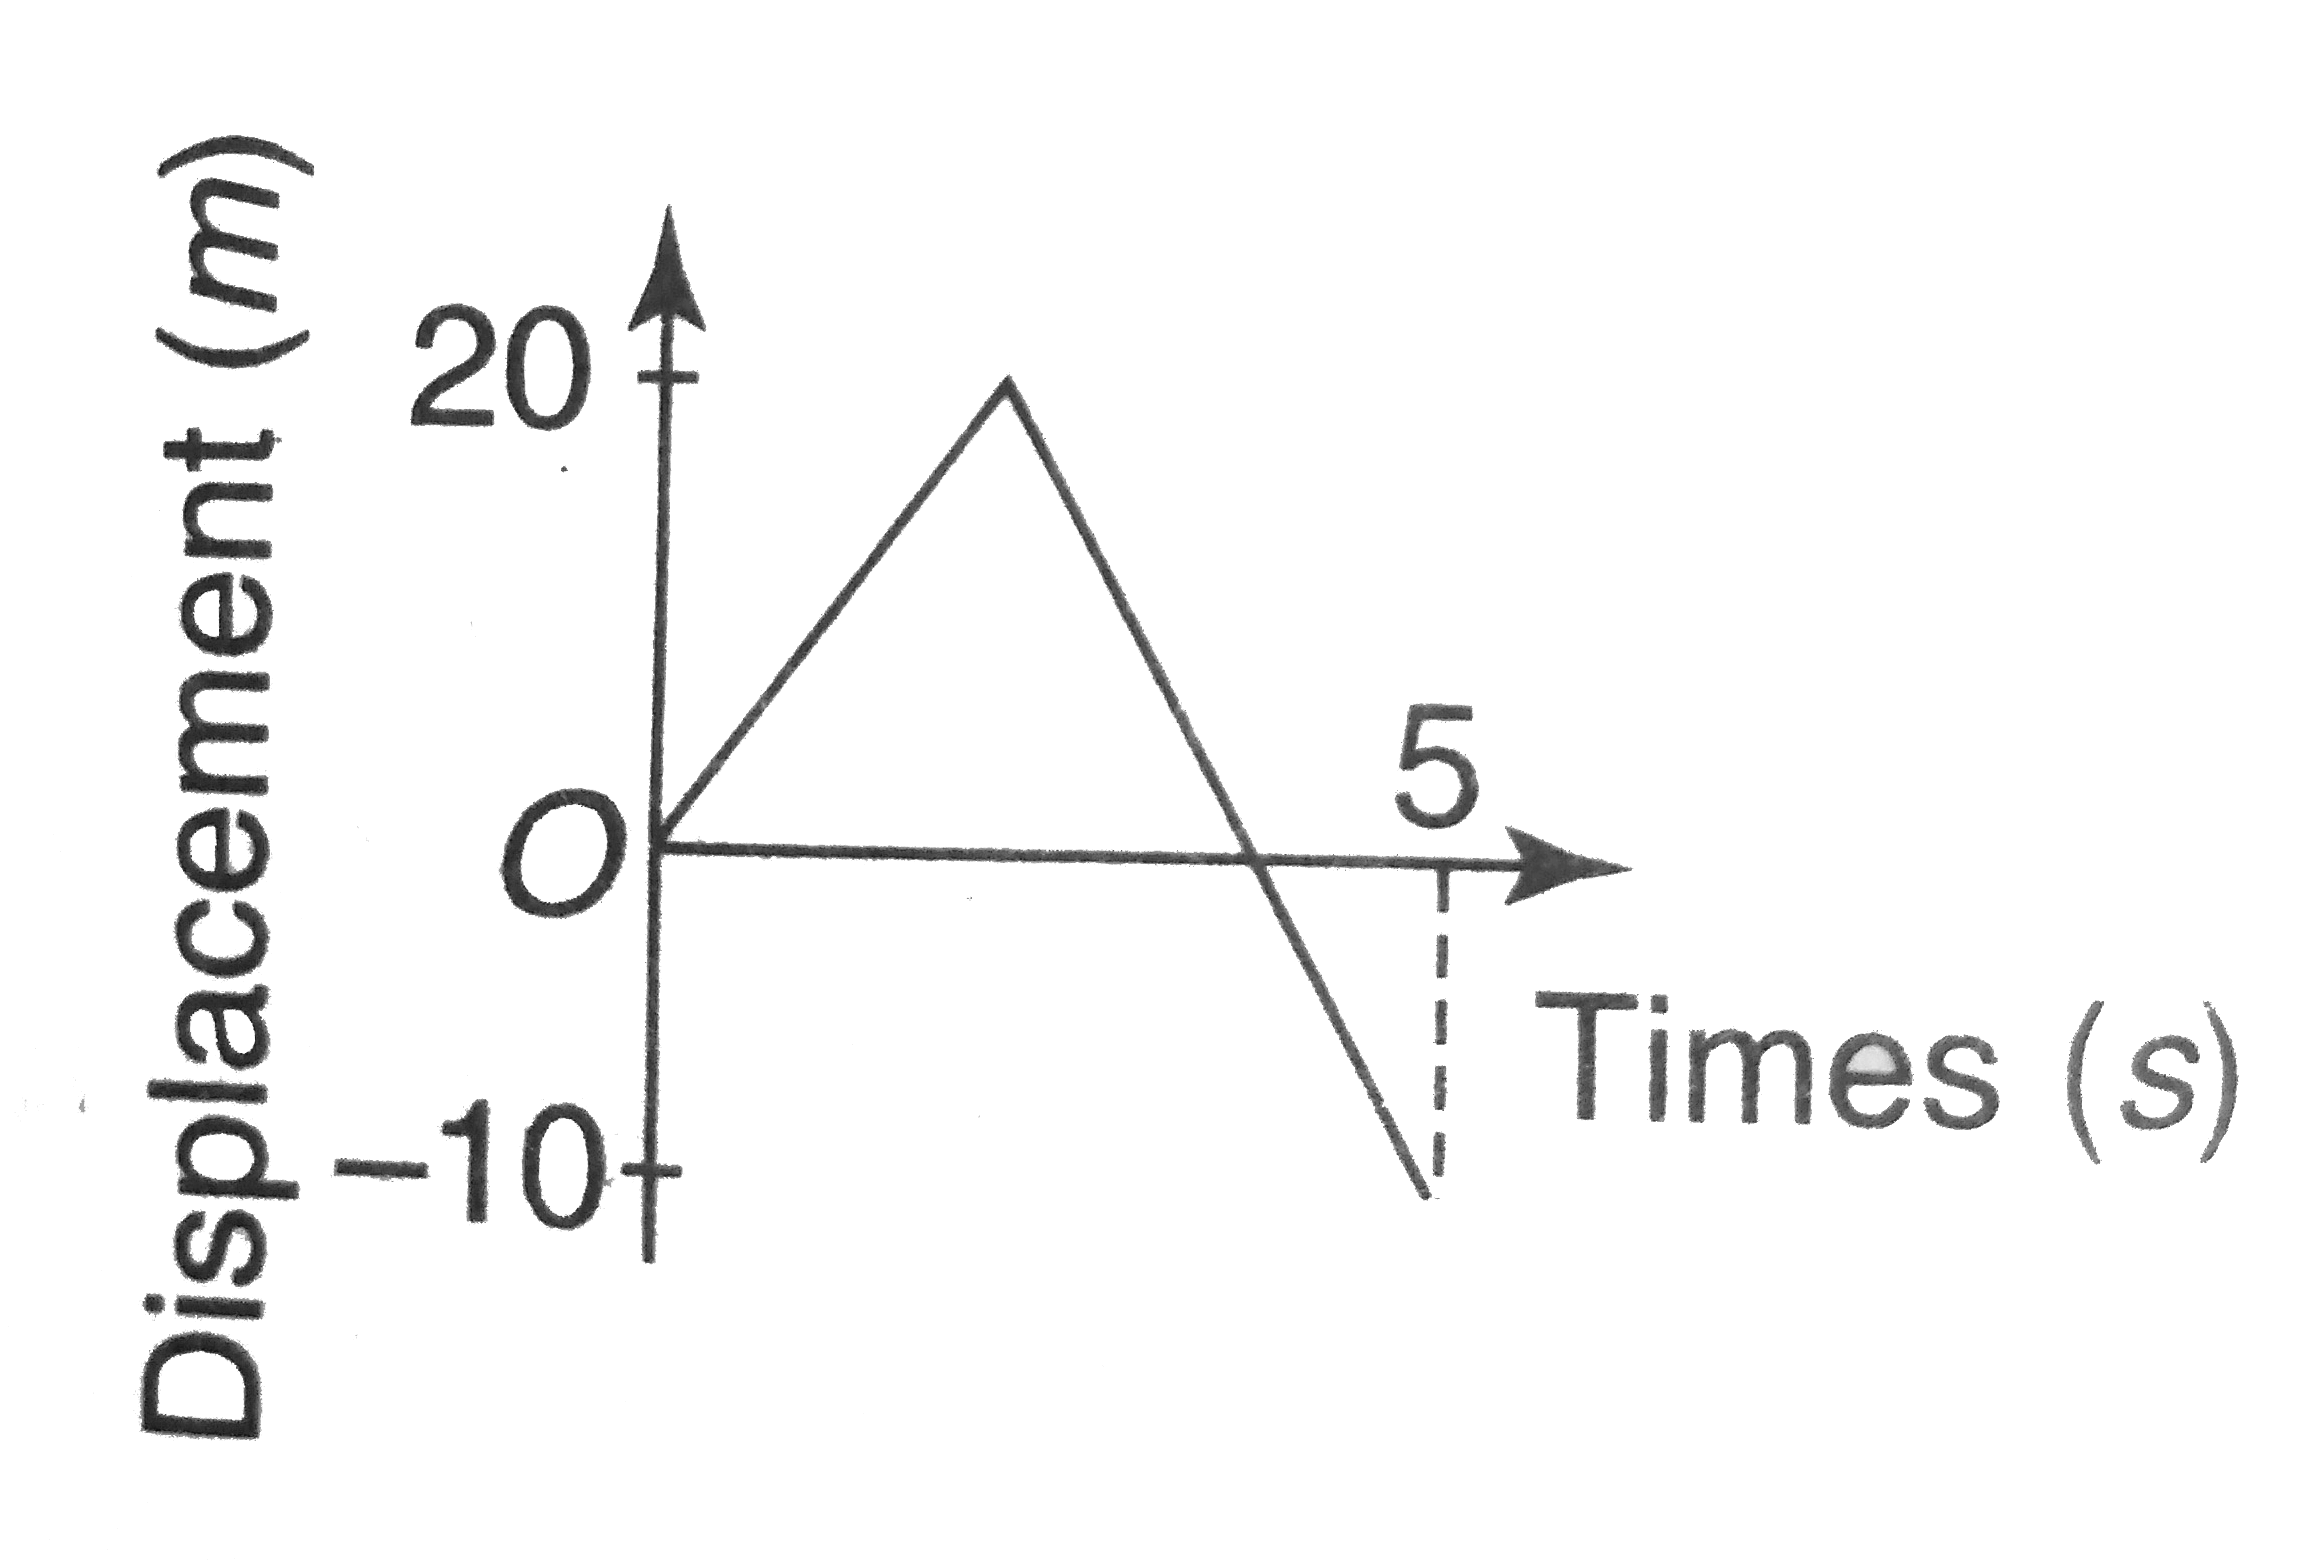 A−2ms−1B2ms−1C−4ms−1D4ms−1
 - Question 3 - Select One
The diagram shows the displacement-time graph for a particle moving in a straight line. Find the average velocity for the interval from t=0 to t=5s.
 A−2ms−1B2ms−1C−4ms−1D4ms−1
The figure shows a velocity-time graph of a particle moving along a straight line
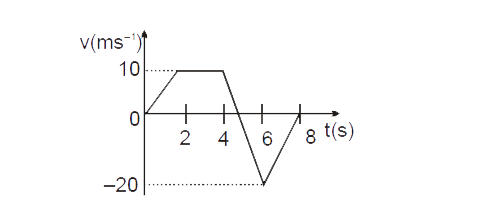
Choose the incorrect statement. The particle comes to rest atView SolutionThe figure shows velocity-time graph of a particle moving along a straight line. Identify the correct statement.
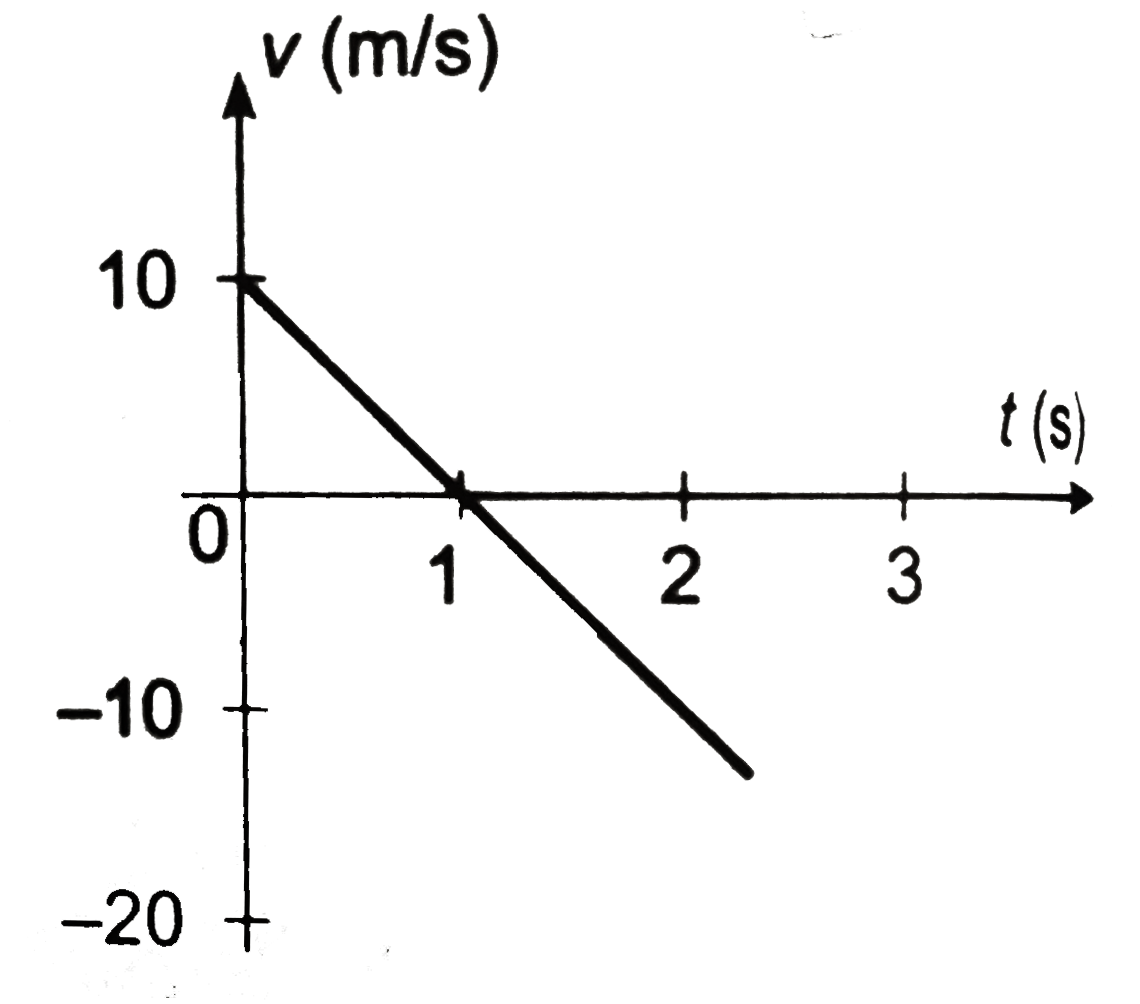 View Solution
The figure shows a velocity-time graph of a particle moving along a straight line
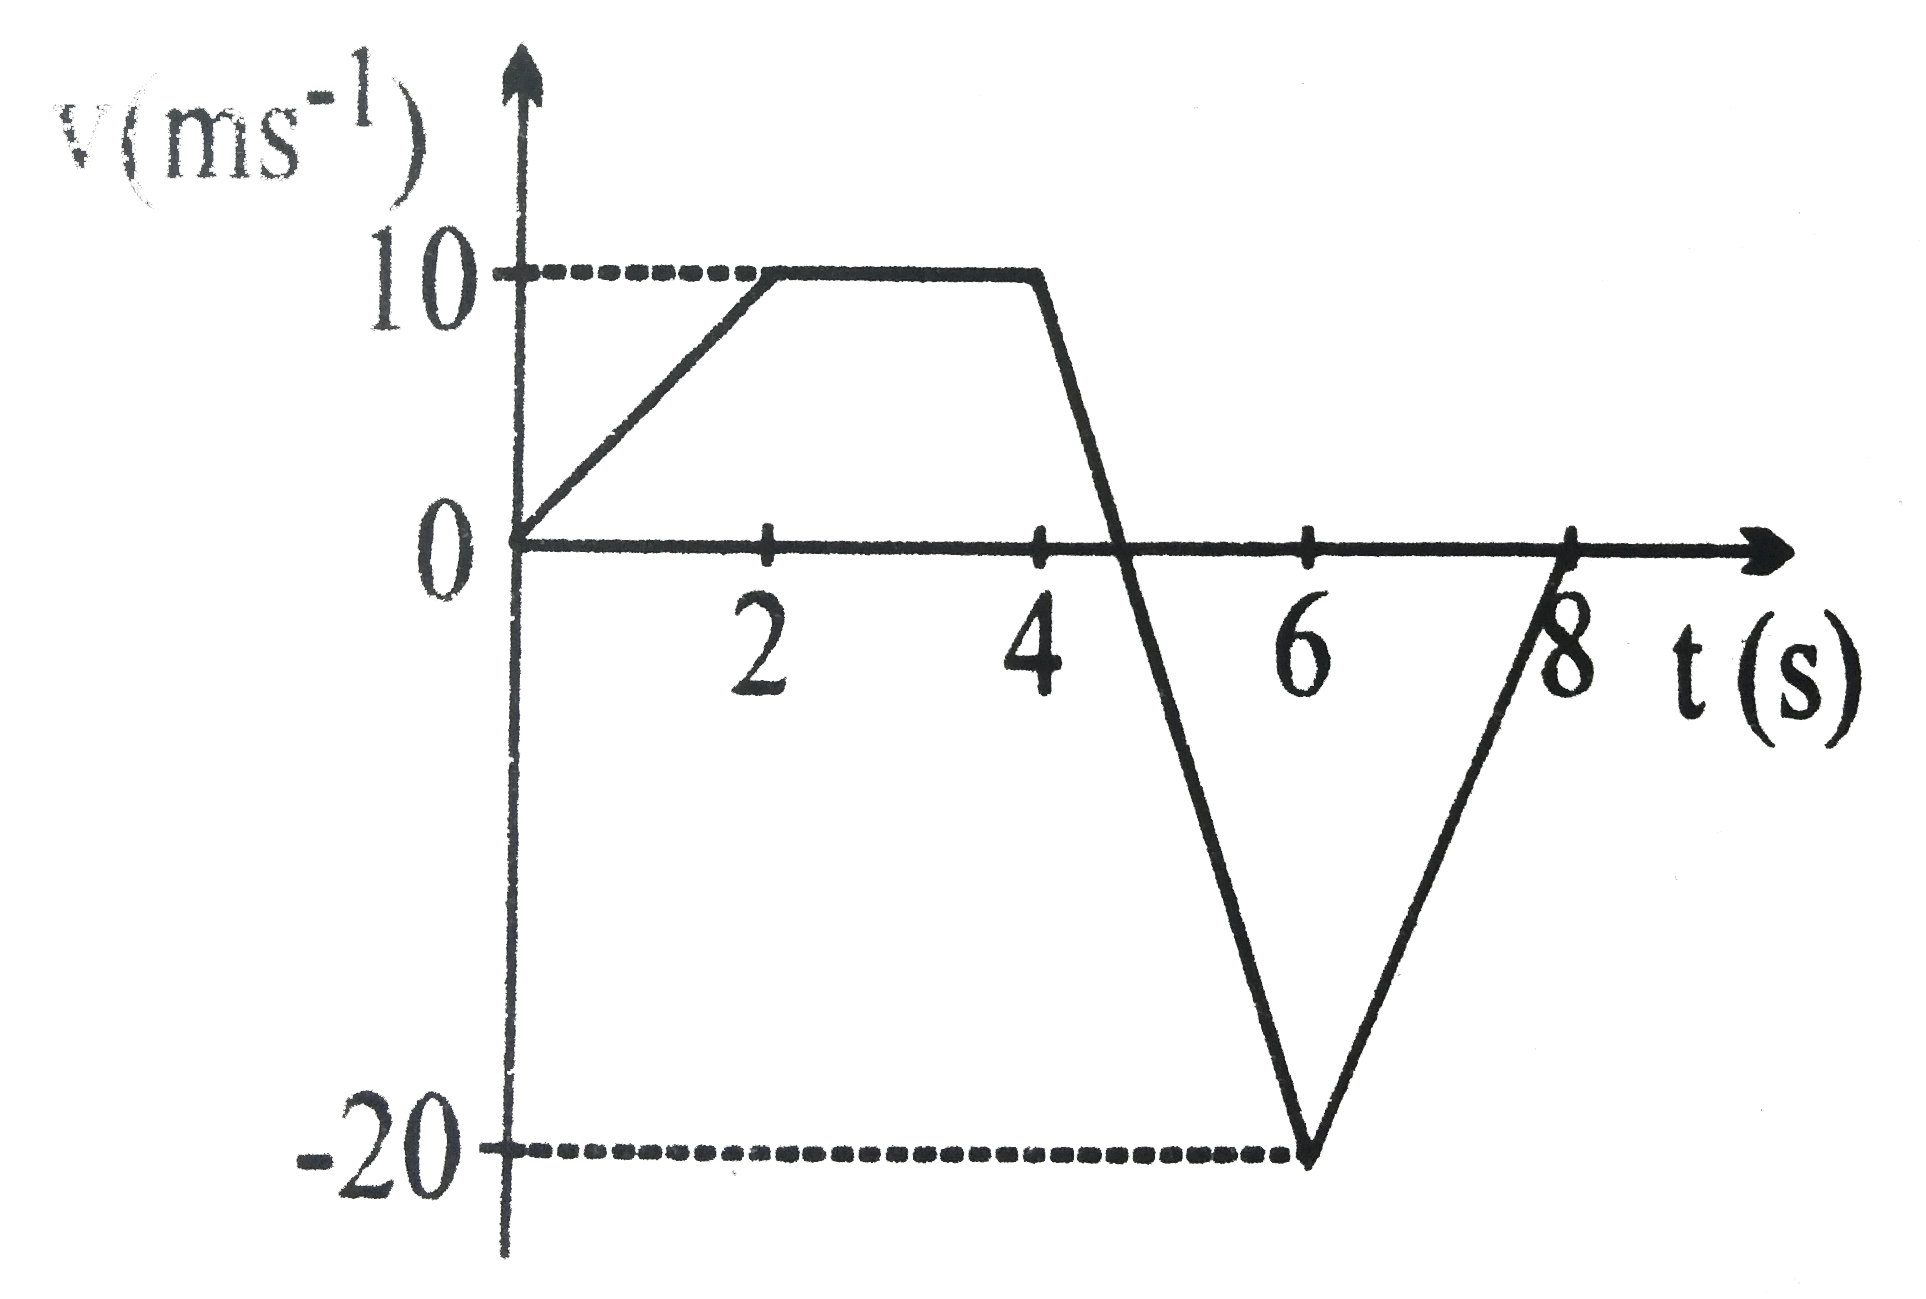
Choose the incorrect statement. The particle comes to rest atView SolutionThe figure shows a velocity-time graph of a particle moving along a straight line
Q. Identify the region in which the rate of change of velocity ∣∣∣Δ→vΔt∣∣∣ of the particle is maximumView SolutionThe figure shows a velocity-time graph of a particle moving along a straight line
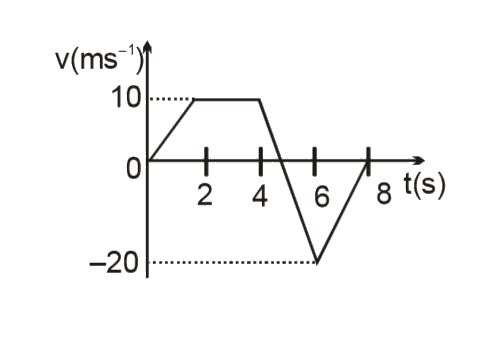
Q. The maximum of displacement of the particle isView Solution


