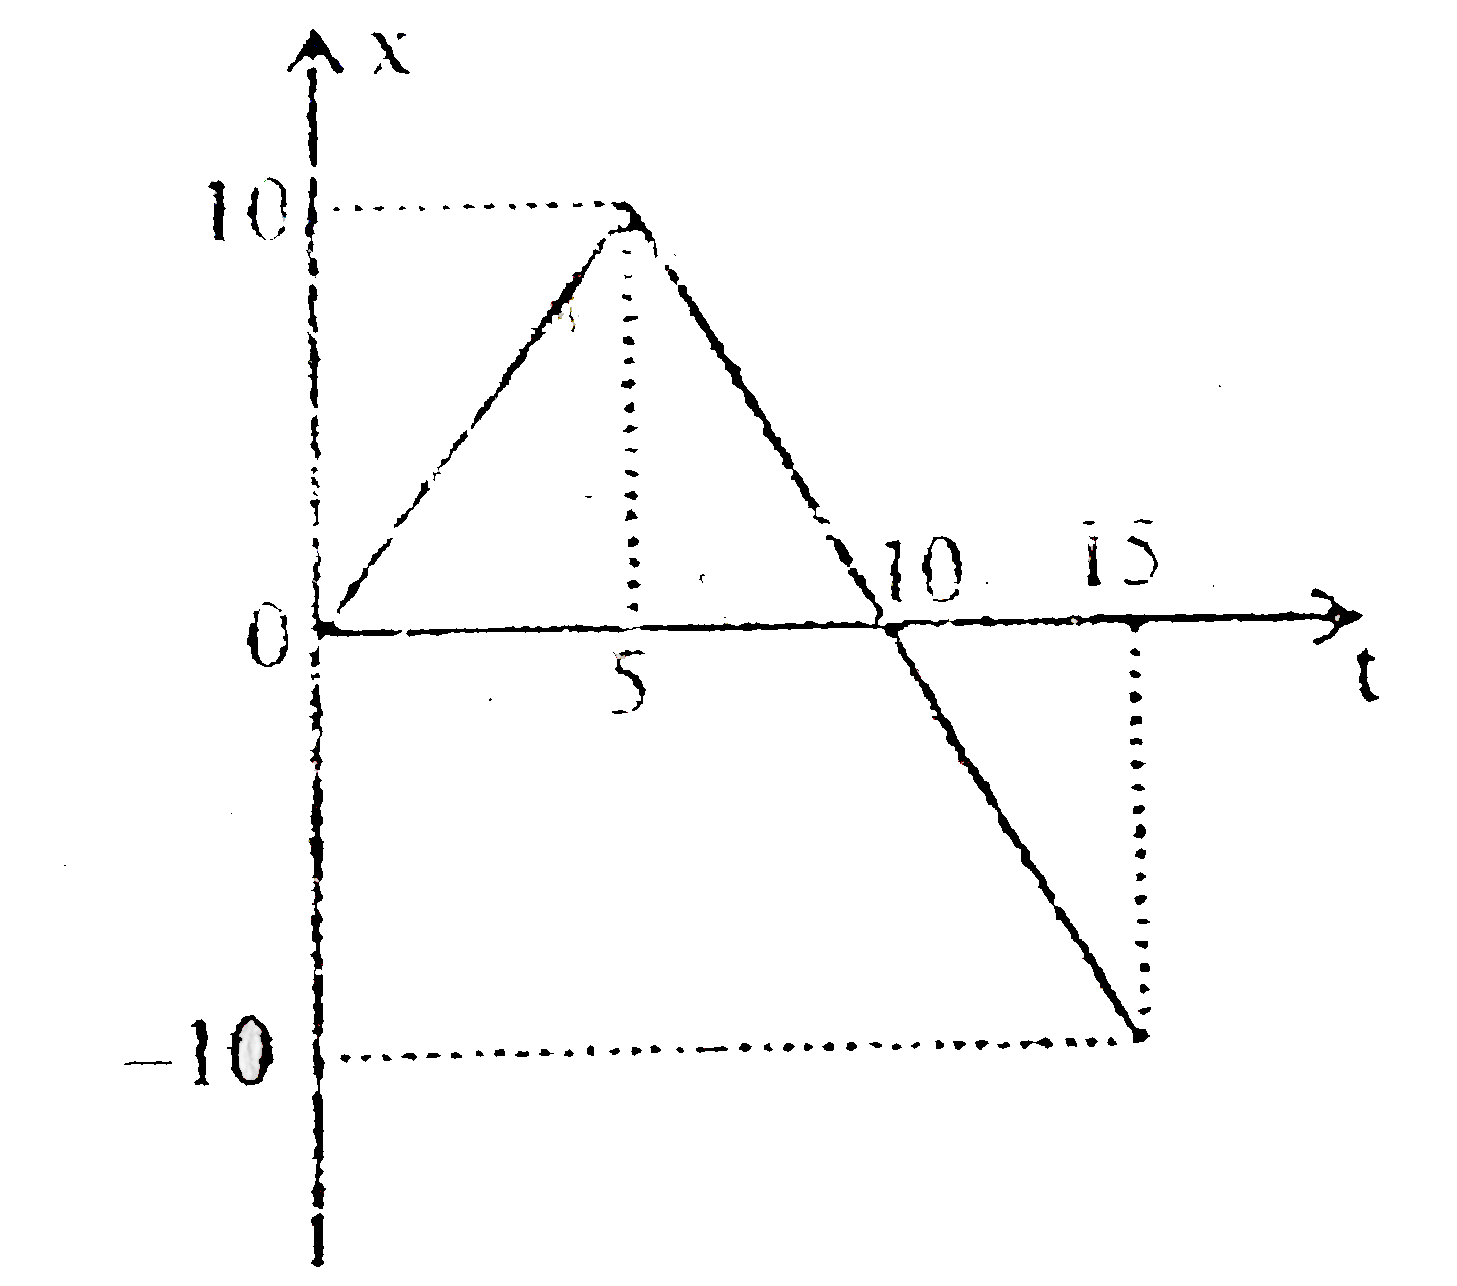
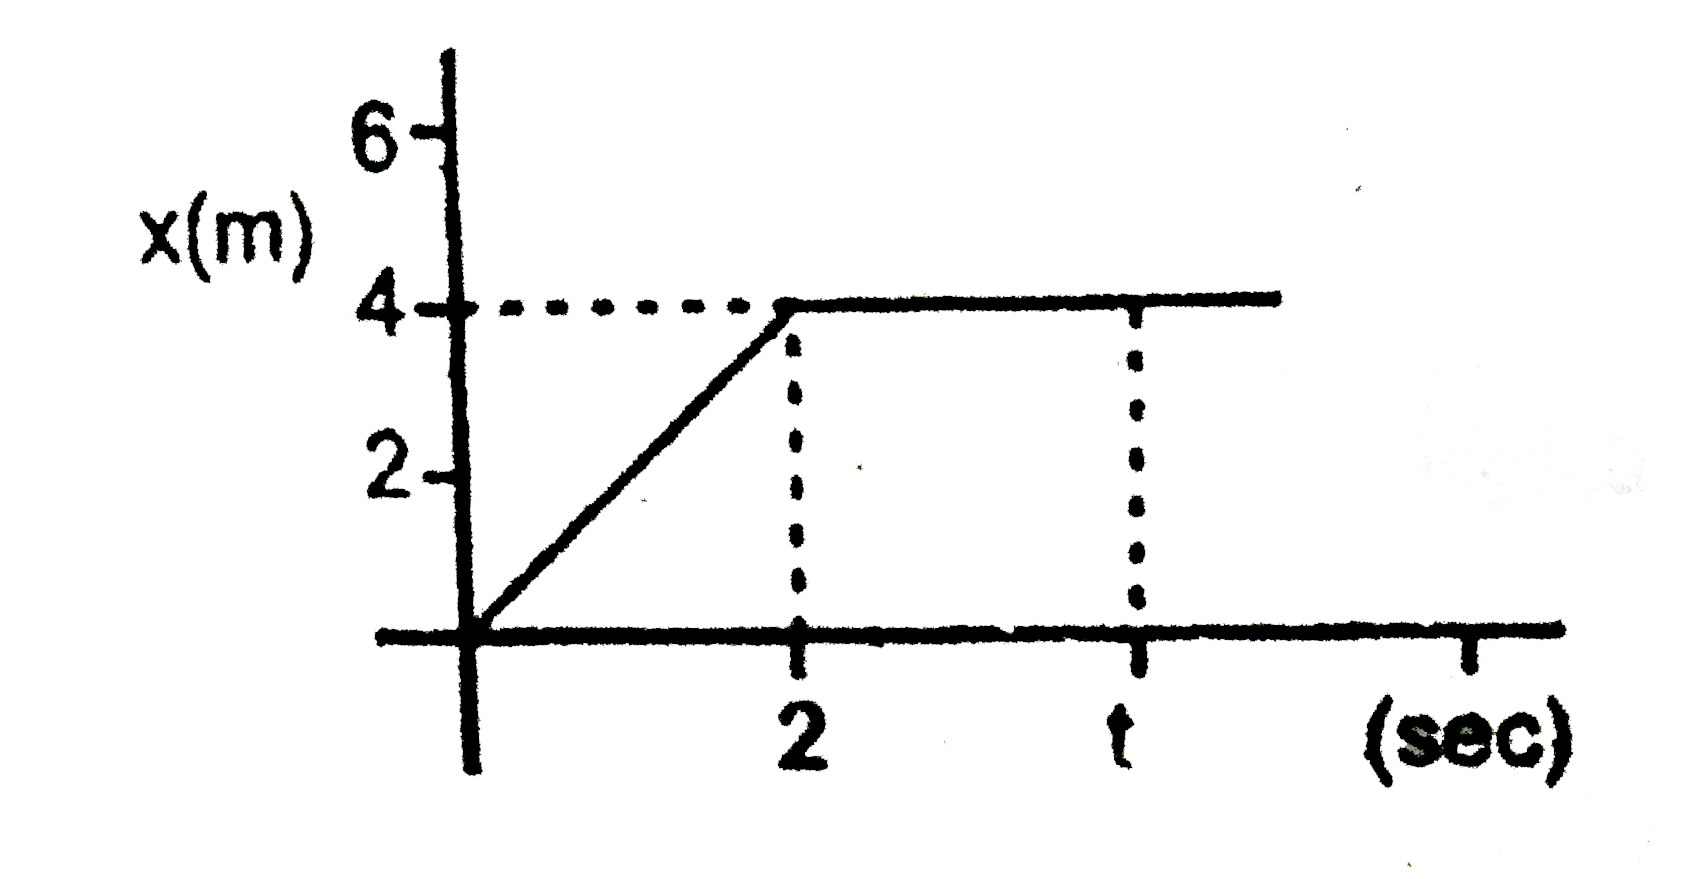
Position time graph is given find average speed in time t=0 and t=15sec is
A
5m/s
B
53m/s
C
2m/s
D
23m/s
Video Solution
Text Solution
The correct Answer is:C
Average speed =30/15=2m/s
|
Updated on:21/07/2023
Topper's Solved these Questions
- BOOK - ALLENCHAPTER - TEST PAPEREXERCISE - Exercise (Physics)330videos
TEST PAPER
- BOOK - ALLENCHAPTER - TEST PAPEREXERCISE - PHYSICS4videos
TEST PAPER
- BOOK - ALLENCHAPTER - SIMPLE HARMONIC MOTIONEXERCISE - Example1videos
SIMPLE HARMONIC MOTION
- BOOK - ALLENCHAPTER - TEST PAPER 1EXERCISE - PHYSICS11videos
TEST PAPER 1
Similar Questions
Knowledge Check
- Question 1 - Select One
The velocity-time plot is shown in figure. Find the average speed in time interval t=0 to t=40s during the period.
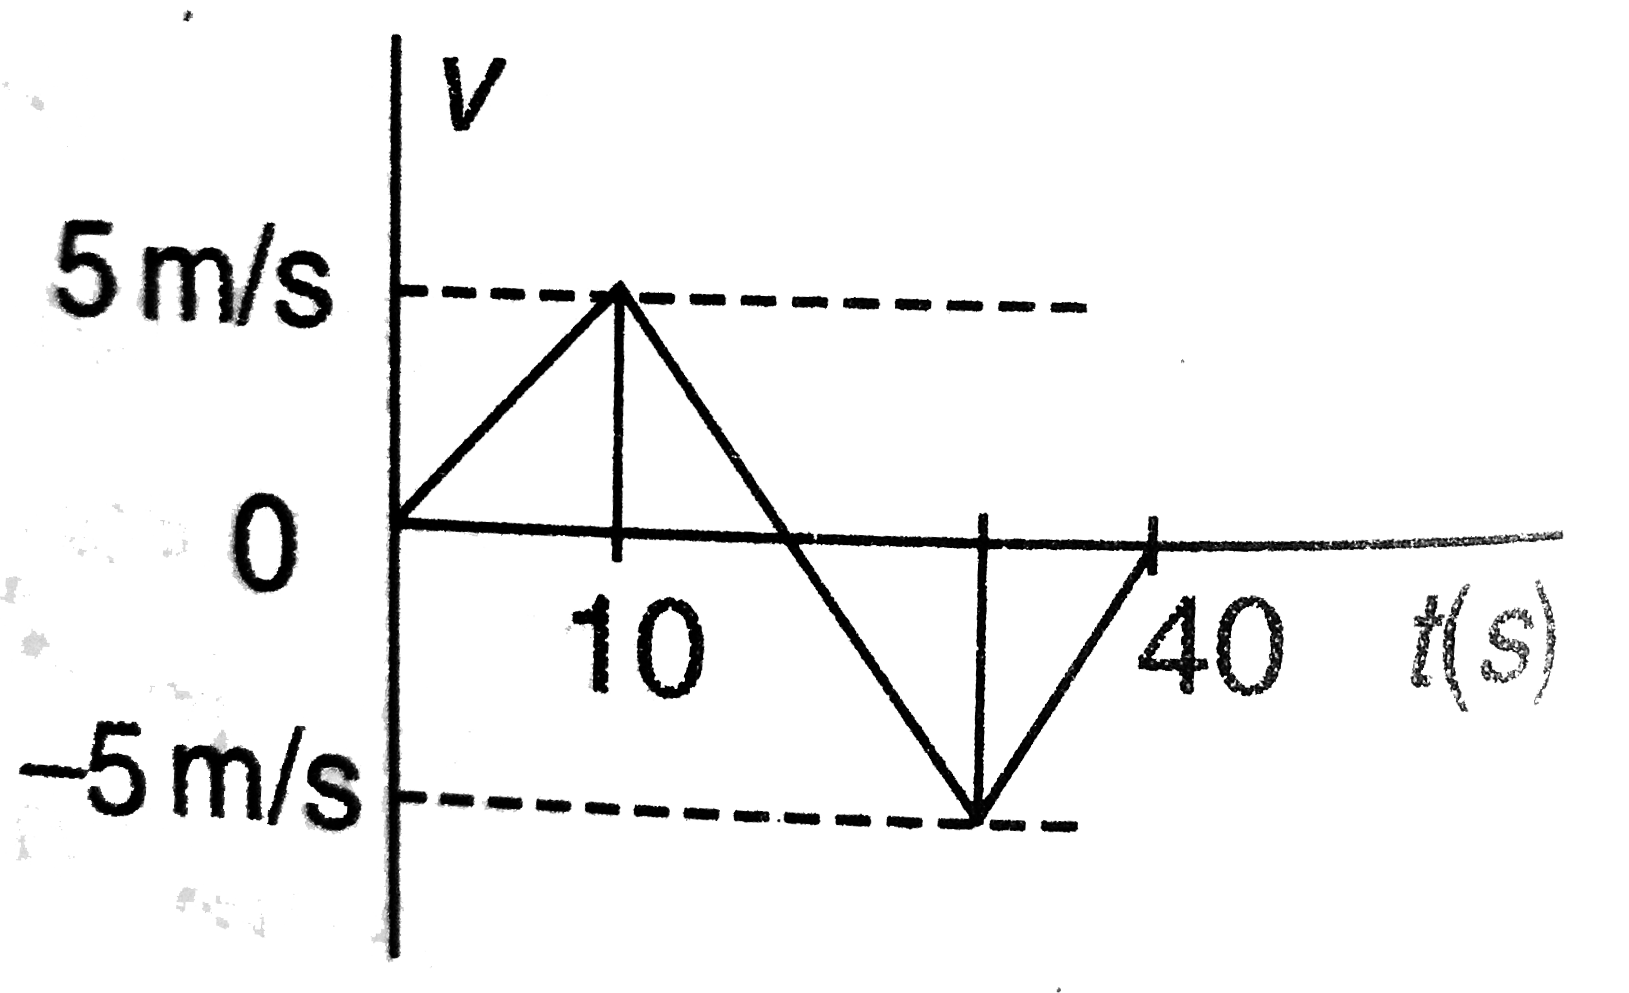 AzeroB2.5m/sC5m/sDnone
 - Question 2 - Select One
Position time graph is shown which is a semicircle form t=2 to t=8sec. Find time t at which the instantaneous velocity, is equal to average velocity over first t second.
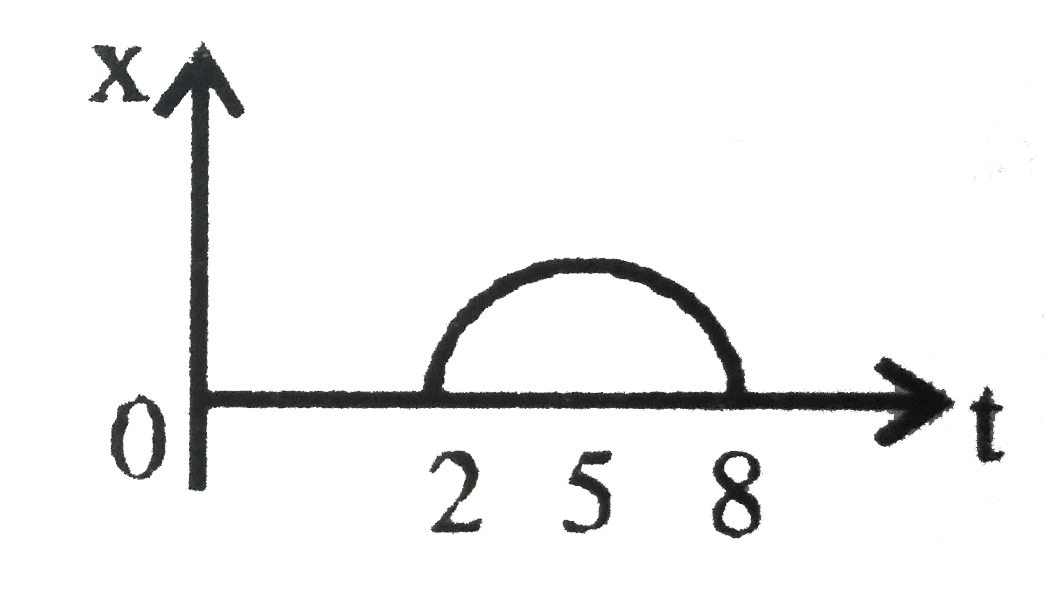 A4.8secB3.2secC2.4secD5sec
 - Question 3 - Select One
A car is moving on a straight road. The velocity of the car varies with time as shown in the figure. Initially (at t=0), the car was at x=0, where, x is the position of the car at any time 't'.
Average speed from t=0 to t=70s will be :-A167m/sB247m/sC207m/sDzero
Shows position time graph of a particle of mass 100g Find the impulse at t=0 and at t=4s
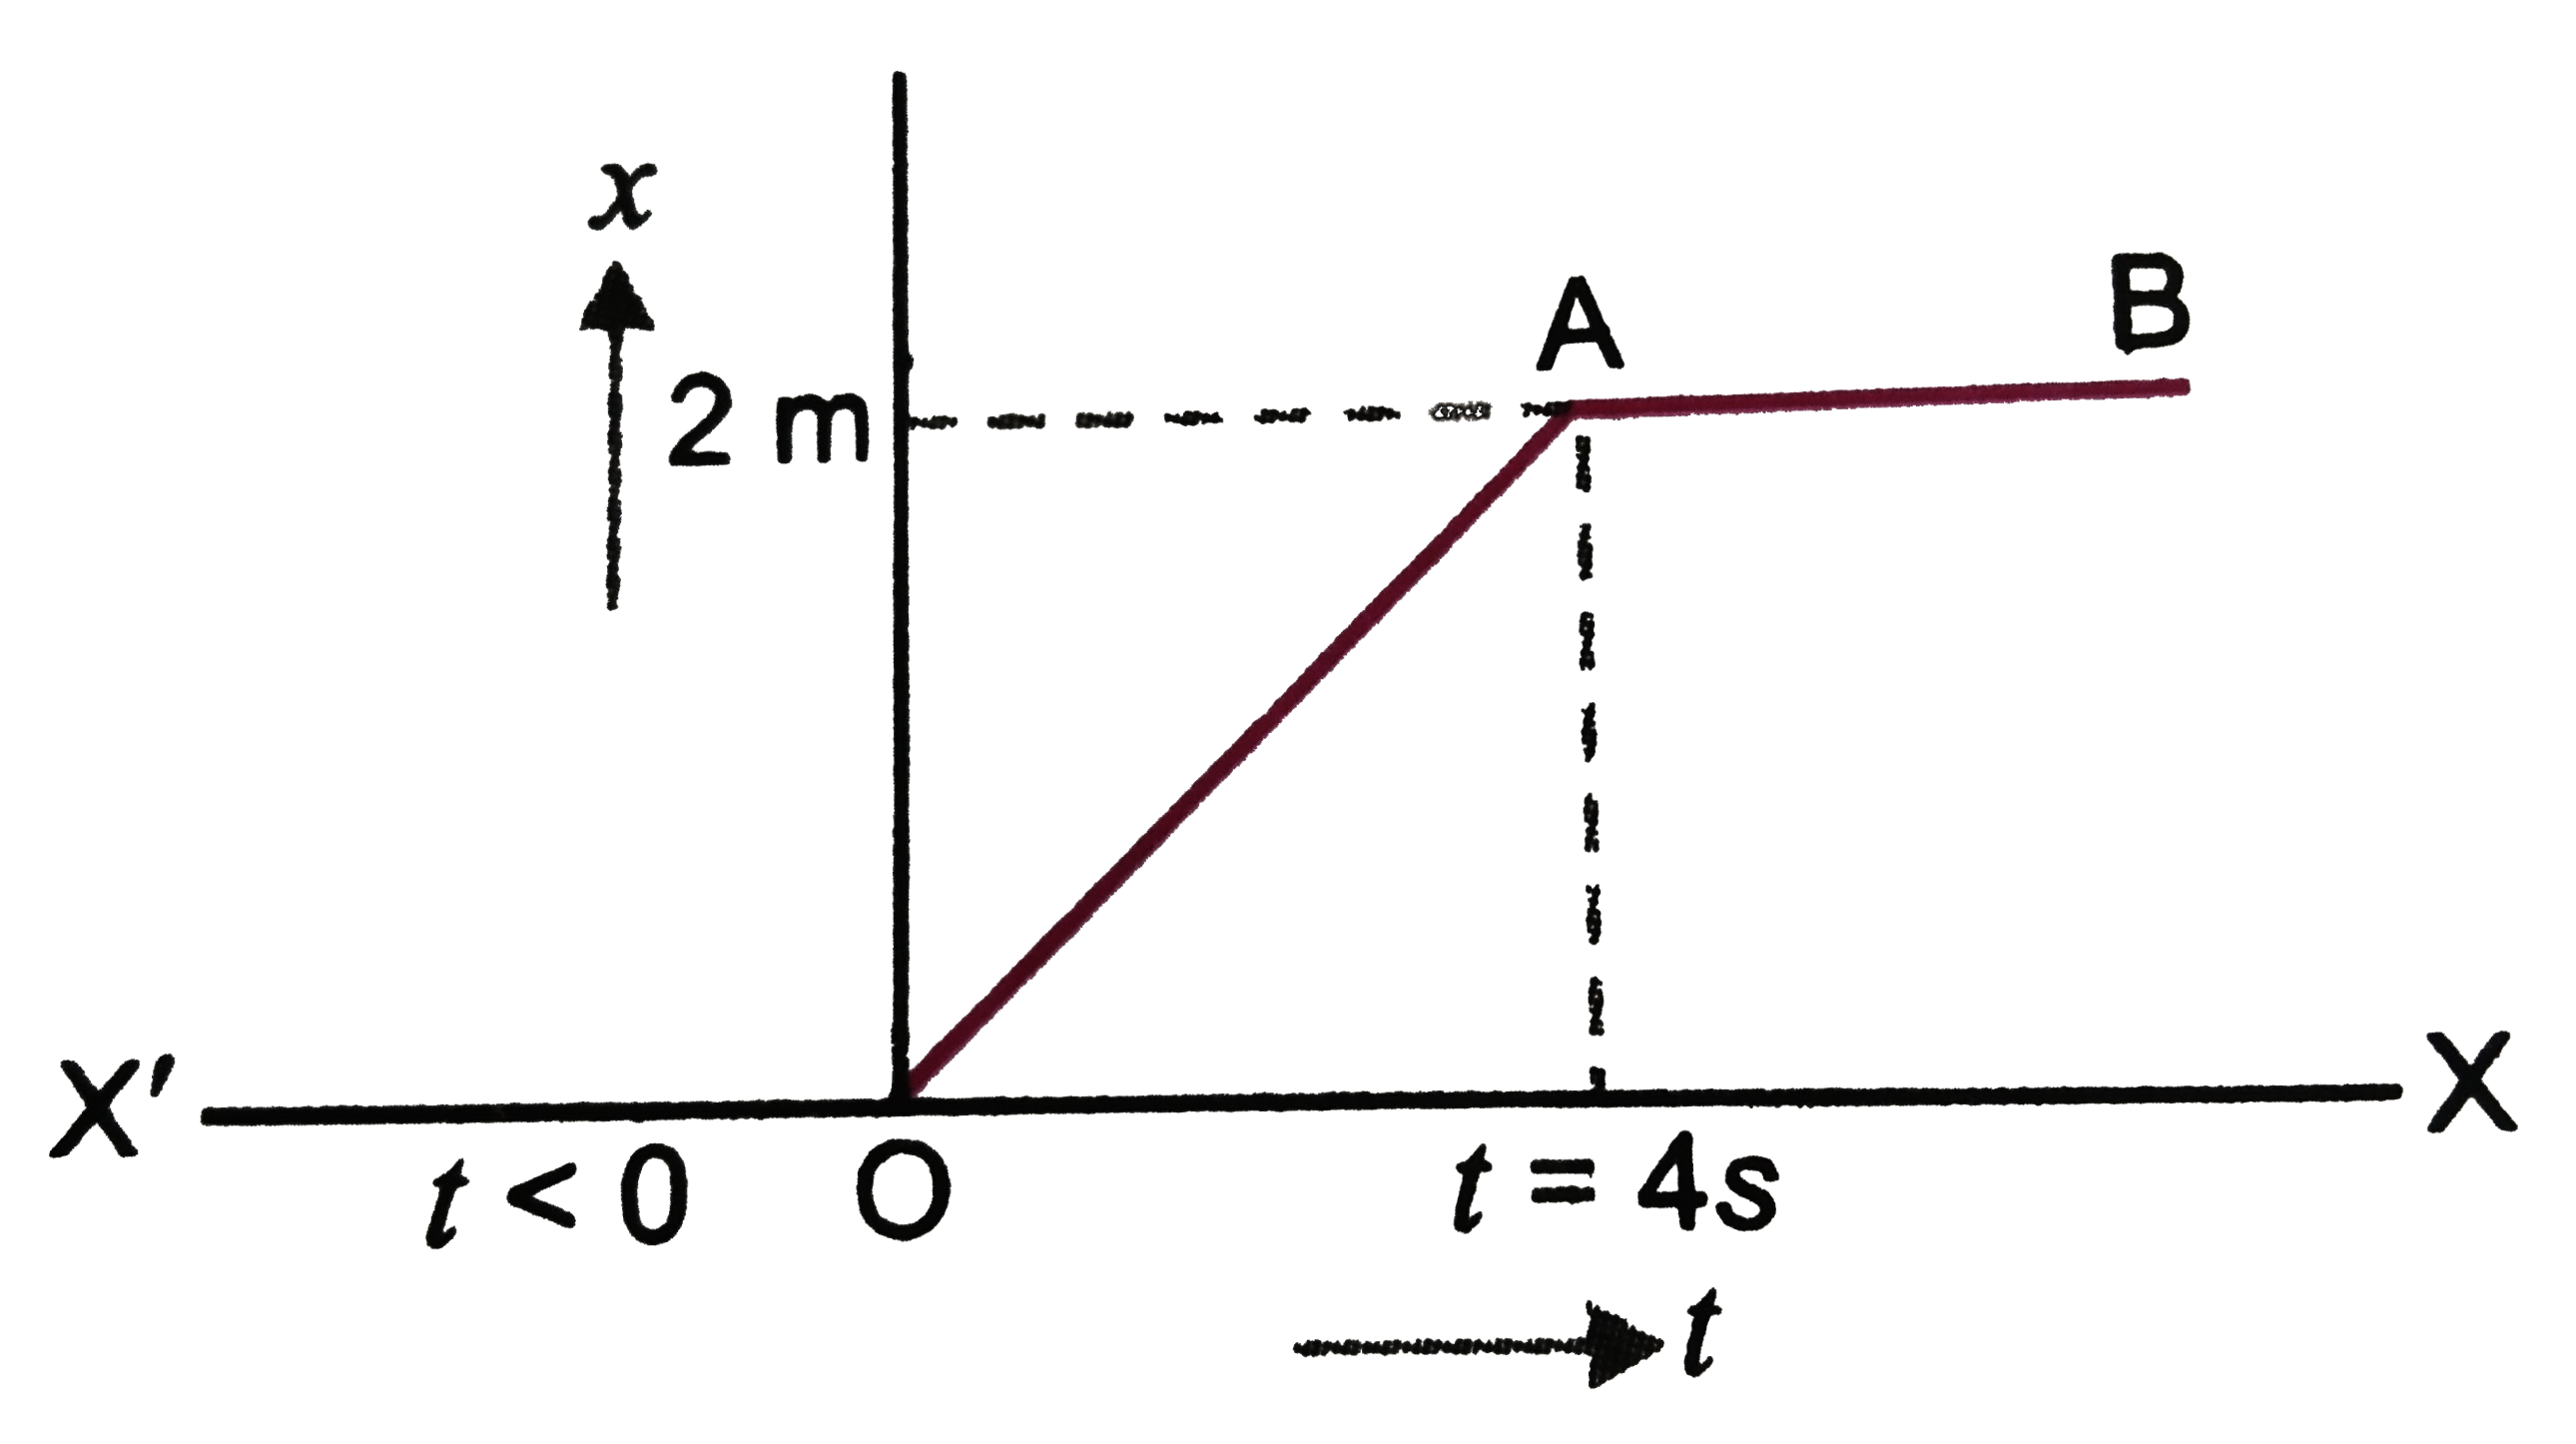 .View Solution
If Electric-current 'i' time (t) graph shown in figure. The average current in first 6 sec. is :-
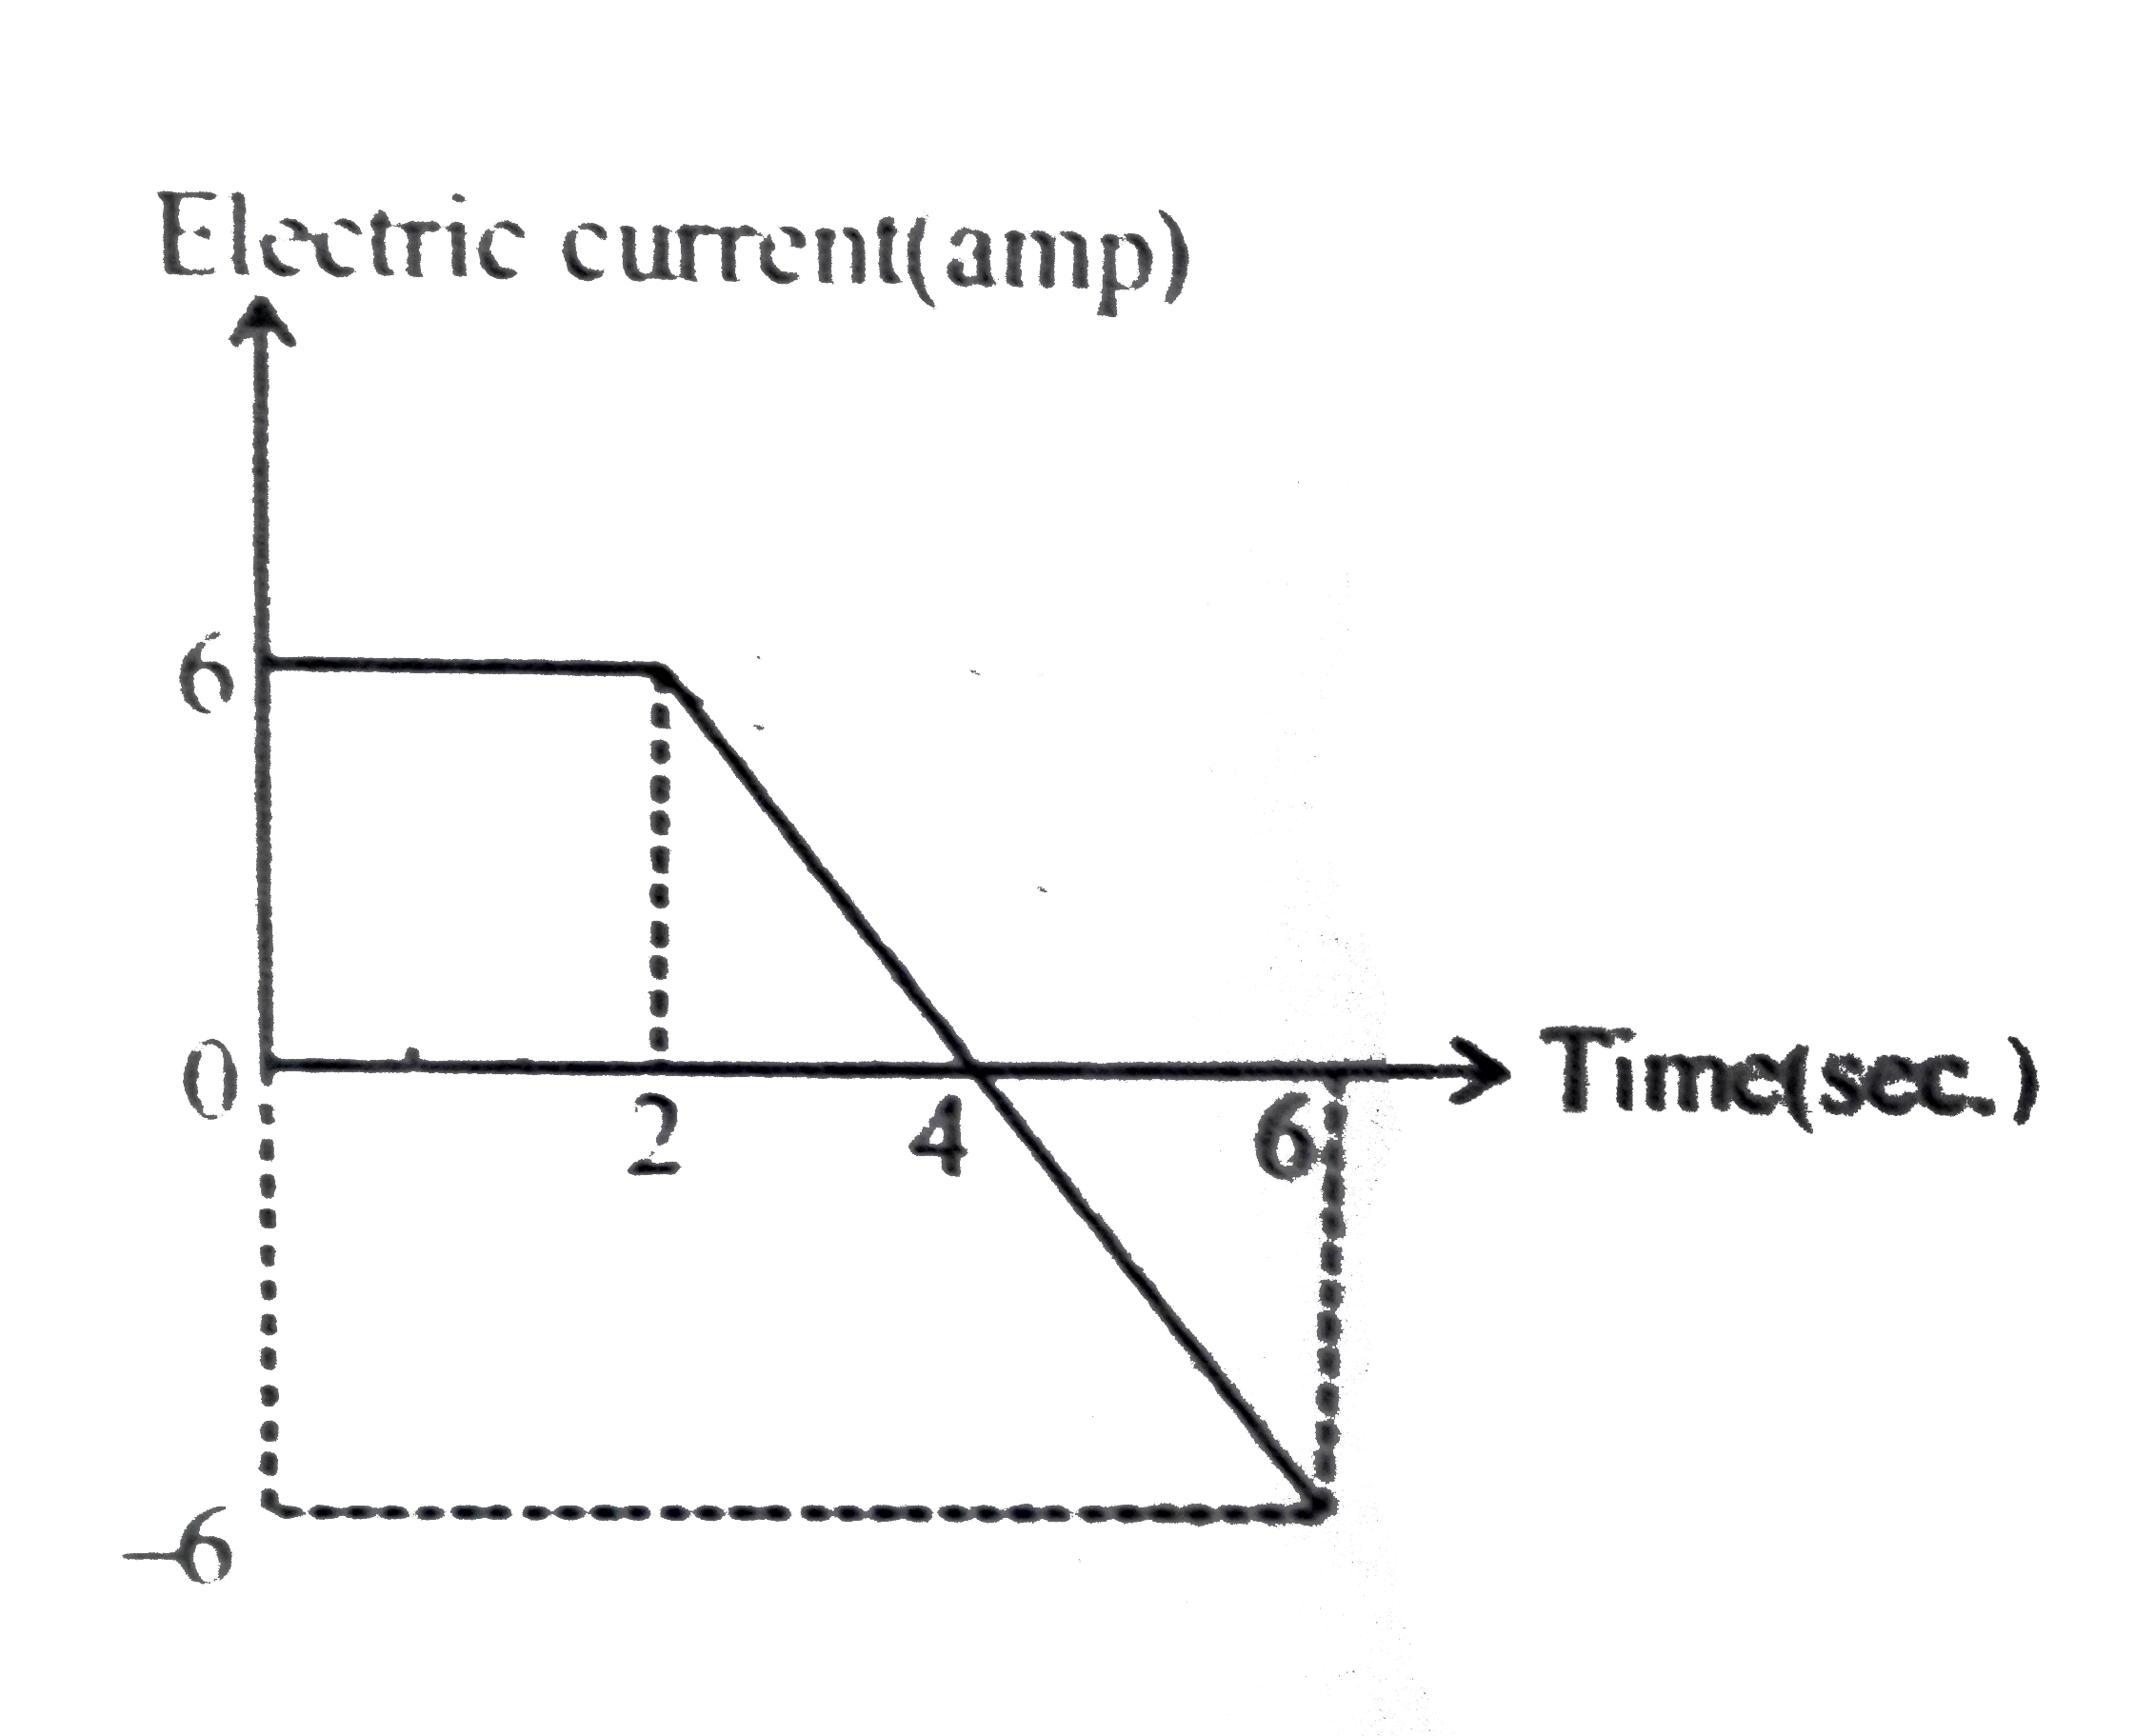 View Solution
During one dimensional motion on x-axis Velocity time graph for particle is given.
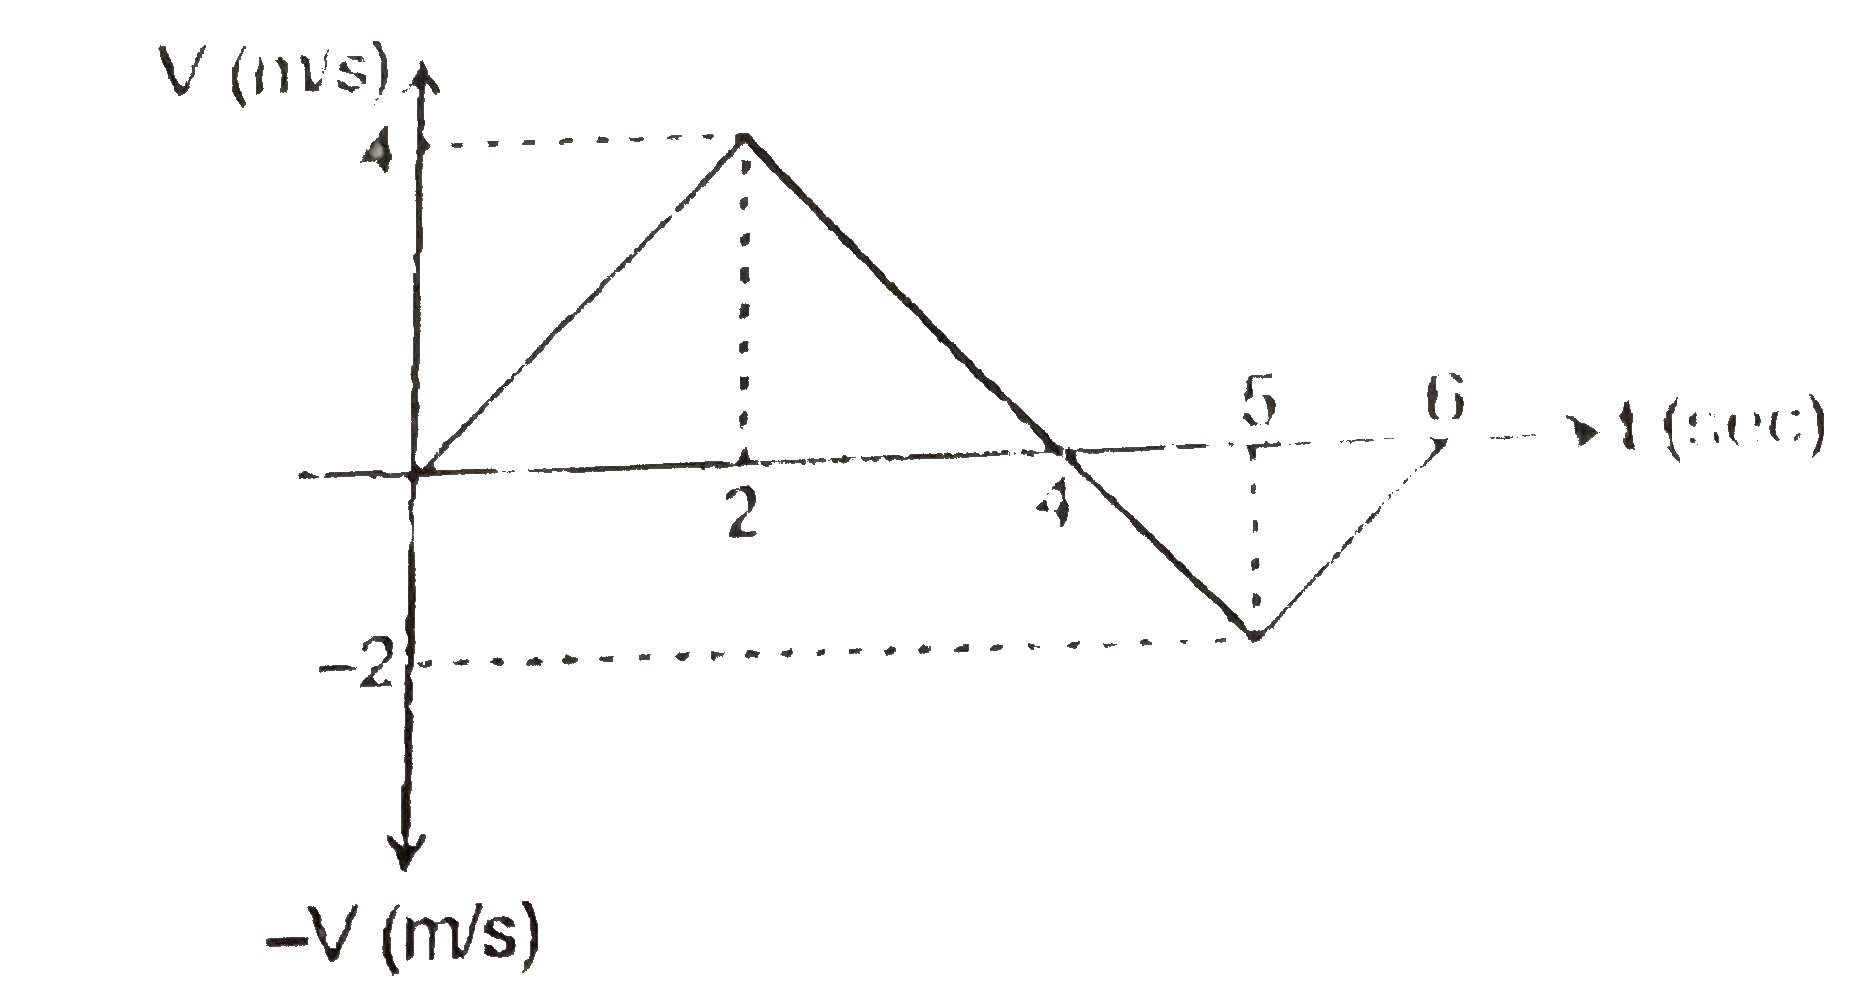
Average acceleration between (t = 0 sec) to (t = 6 sec)View SolutionIn the figure given below, the position time graph of a particle of mass 0.1kg is shown. The impulse at t=2 sec is
 View Solution
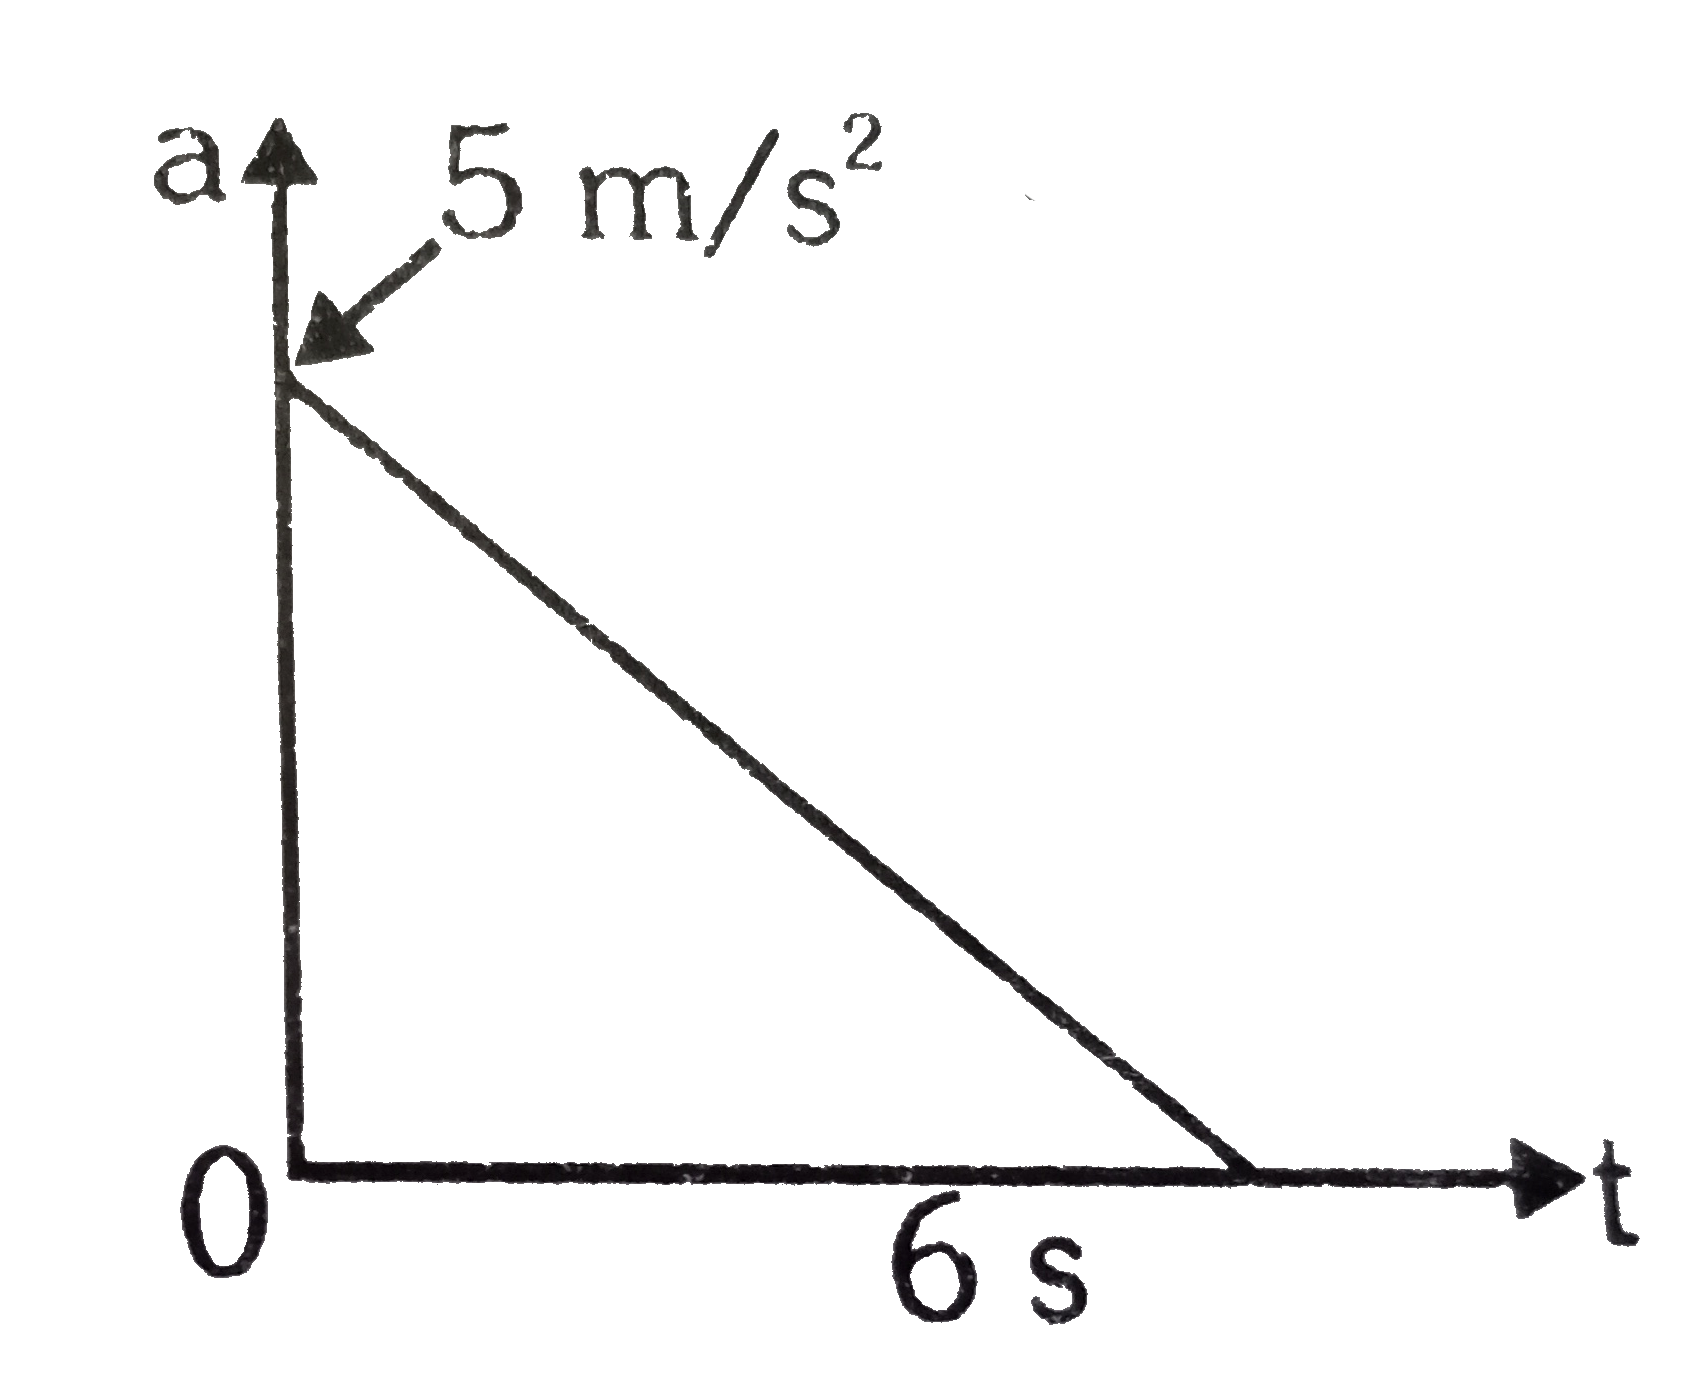
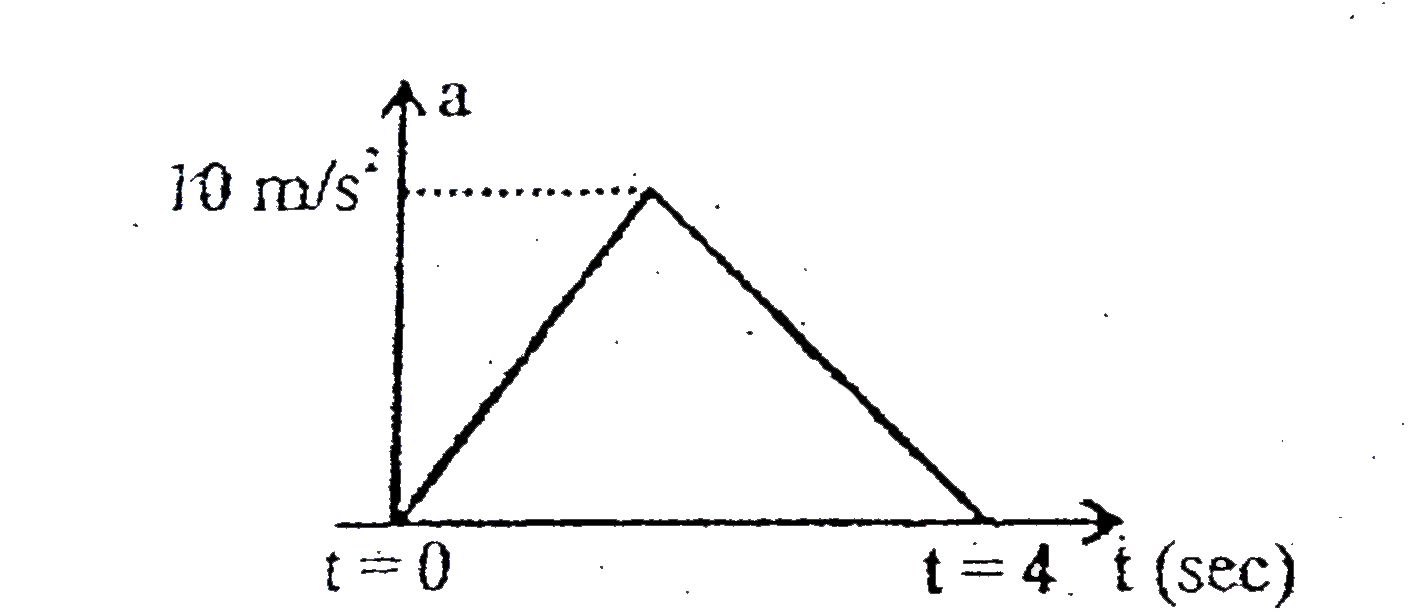
Acceleration time graph of a particle moving along a straight line is given. Then average acceleration between t=0 & t=4 is :−
 View Solution


