bar graph and their construction
Step by step video & image solution for bar graph and their construction by Maths experts to help you in doubts & scoring excellent marks in Class 6 exams.
Updated on:21/07/2023Similar Questions
A bar graph showing the heights of six mountain peaks is given below. Study the bar graph and answer the questions.
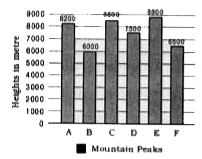
The average hight of all the peaks (in metre) is
View SolutionA bar graph showing the heights of six mountain peaks is given below. Study the bar graph and answer the questions.
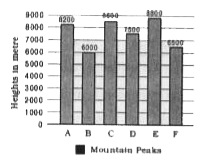
Which peak is the second highest ?
View Solution
Knowledge Check
Study the following bar graph and answer the question that follows.
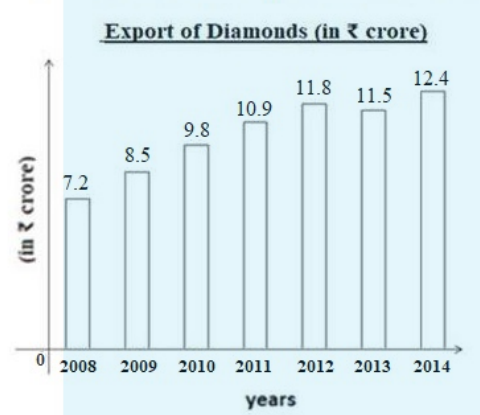
In which year was the maximin percentage increase in diamonds exports compared to the previous year?A2014B2009C2010D2012The given bar graph shows the biscuit exports of India over a period of five years. Study the graph and answer the questions that follows
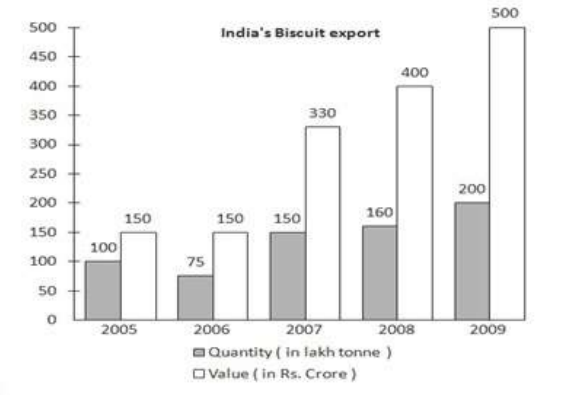
In which two year was the value per tonne equal?A2006 and 2007B2008 and 2009C2007 and 2008D2005 and 2006
What are the general rules related to construction of graphs, maps and diagrams?
View SolutionStudy the bar graph and match the lists.
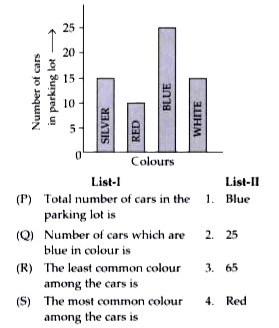
View SolutionRead the bar graph and answer the following questons.
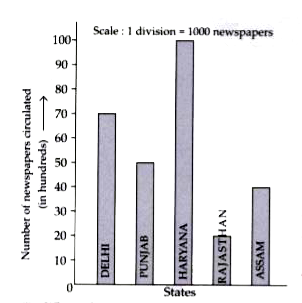
What information is given by graph ?
View SolutionIn the given bar graph, the white bar shows the income and the black bar shows the expenditure of a company. Study the graph and answer the question that follows.
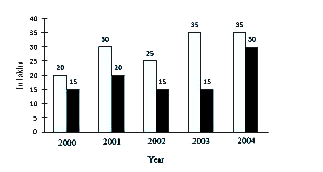
The income in 2001 was equal to the expenditure in the year :
View SolutionIn the given bar graph, the white bar shows the income and black bar shows the expenditure of a company . Study the graph and answer the question that follows .
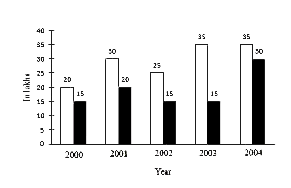
The expenditure from 2001 to 2002 decreased by
View SolutionConstruct the graph of the following functions. y=|x+1|−|x−1|2 .
View Solution
