A bar graph showing the heights of six mountain peaks is given below. Study the bar graph and answer the questions.
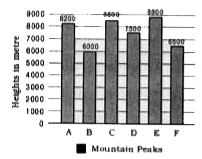
The average hight of all the peaks (in metre) is
7601.5
7600
7599.5
7610
The correct Answer is:B
Step by step video & image solution for A bar graph showing the heights of six mountain peaks is given below. Study the bar graph and answer the questions. The average hight of all the peaks (in metre) is by Maths experts to help you in doubts & scoring excellent marks in Class 14 exams.
Updated on:21/07/2023Topper's Solved these Questions
- STATISTICS AND DATA INTERPRETATIONBOOK - KIRAN PUBLICATIONCHAPTER - STATISTICS AND DATA INTERPRETATIONEXERCISE - TYPE-III
39 Videos
- STATISTICS AND DATA INTERPRETATIONBOOK - KIRAN PUBLICATIONCHAPTER - STATISTICS AND DATA INTERPRETATIONEXERCISE - TYPE-IV
182 Videos
- STATISTICS AND DATA INTERPRETATIONBOOK - KIRAN PUBLICATIONCHAPTER - STATISTICS AND DATA INTERPRETATIONEXERCISE - TYPE-VIII
8 Videos
- SIMPLIFICATIONBOOK - KIRAN PUBLICATIONCHAPTER - SIMPLIFICATIONEXERCISE - TEST YOURSELF
25 Videos
- TIME AND DISTANCEBOOK - KIRAN PUBLICATIONCHAPTER - TIME AND DISTANCEEXERCISE - Type -XI
74 Videos
Similar Questions
A bar graph showing the heights of six mountain peaks is given below. Study the bar graph and answer the questions.
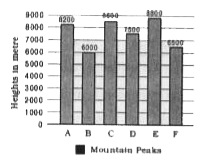
Which peak is the second highest ?
View SolutionA bar graph showing the heights of six mountain peaks is given below. Study the bar graph and answer the questions.
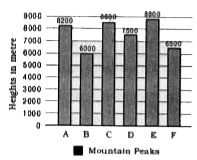
When the heights of the given peaks are written in ascending order, what is the average of the middle two peaks?
View Solution
Knowledge Check
Study the following bar graph and answer the question that follows.
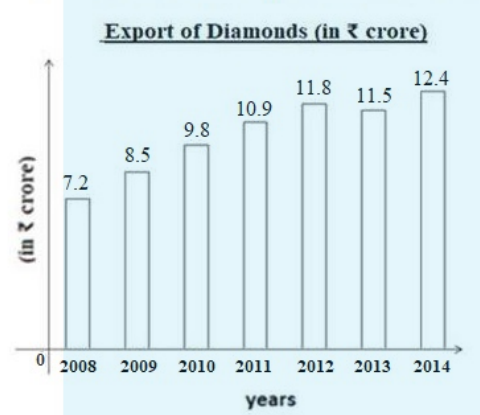
In which year was the maximin percentage increase in diamonds exports compared to the previous year?A2014B2009C2010D2012The given bar graph shows the biscuit exports of India over a period of five years. Study the graph and answer the questions that follows
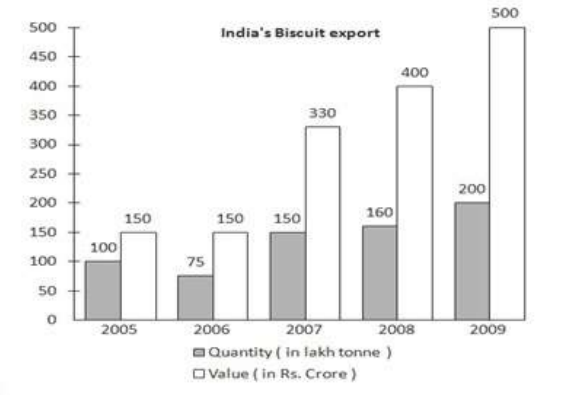
In which two year was the value per tonne equal?A2006 and 2007B2008 and 2009C2007 and 2008D2005 and 2006
A bar graph showing the heights of six mountain peaks is given below. Study the bar graph and answer the questions.
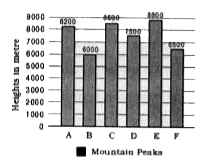
What is the respective ratio of the heights of the highest peak and the lowest peak?
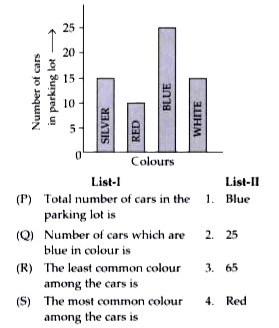
View SolutionStudy the bar graph and match the lists.
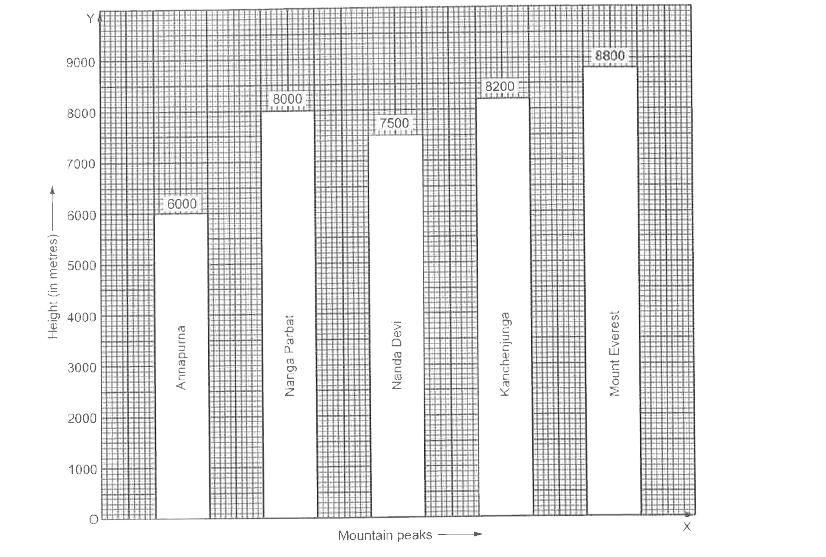
View SolutionGiven below is a bar graph showing the heights of five mountain peaks
Read the bar graph carefully and answer the following questions
Q(i) Which is the highest peak and what is its height (ii) What is the ratio of the heights of the highest peak and the next highest peak (iii) Arrange the heights of the given peaks in descending order
View SolutionStudy the bar graph and answer the following questions.
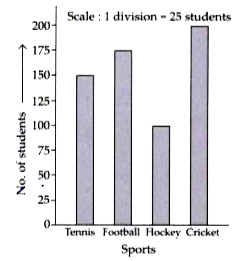
Which sport is preferred least ?
View SolutionStudy the bar graph and answer the following questions.
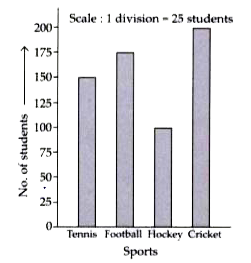
Which is the most popular sport ?
View SolutionStudy the following bar-graph carefully and answer the question:
The average export of pearls for the given period (in crores Rs) is
View Solution
