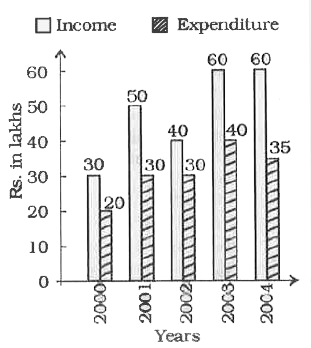
In the given bar graph, the white bar shows the income and the black bar shows the expenditure of a company. Study the graph and answer the question that follows.
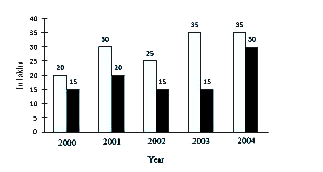
The income in 2001 was equal to the expenditure in the year :
2004
2002
2003
2000
The correct Answer is:B, D
Step by step video & image solution for In the given bar graph, the white bar shows the income and the black bar shows the expenditure of a company. Study the graph and answer the question that follows. The income in 2001 was equal to the expenditure in the year : by Maths experts to help you in doubts & scoring excellent marks in Class 14 exams.
Updated on:21/07/2023Similar Questions
The graph shows Income and Expenditure of a company. Study the graph and answer the questions.
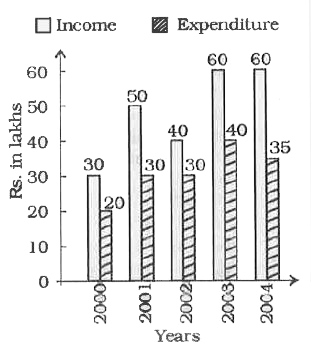
The income in 2002 was equal to the expenditure in the year
View SolutionIn the given bar graph, the white bar shows the income and black bar shows the expenditure of a company . Study the graph and answer the question that follows .
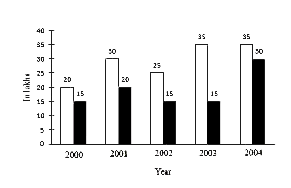
The expenditure from 2001 to 2002 decreased by
View Solution
Knowledge Check
Study the following bar graph and answer the question that follows.
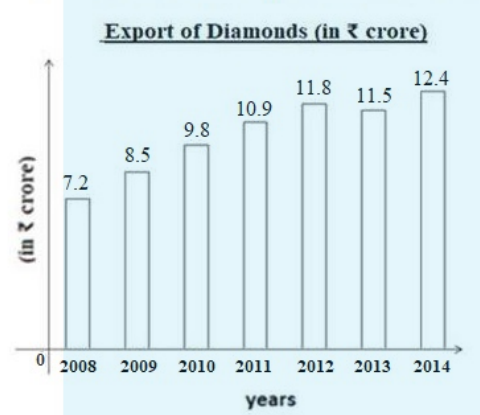
In which year was the maximin percentage increase in diamonds exports compared to the previous year?A2014B2009C2010D2012The bar diagram shows the monthly expenditure of a company. Study the graph and answer the questions.
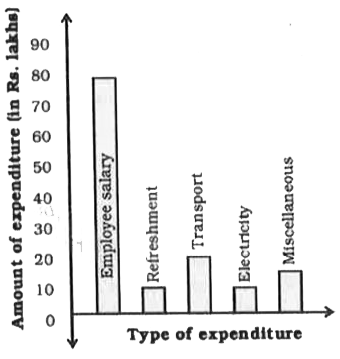
The total monthly expenditure of the company is :ARs. 153 lakhsBRs. 315 lakhsCRs. 135 lakhsDRs. 531 lakhsThe bar diagram shows the monthly expenditure of a company. Study the graph and answer the questions.
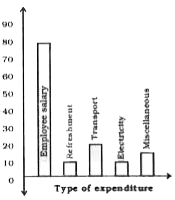
The total monthly expenditure of the company is :ARs. 153 lakhsBRs. 315 lakhsCRs. 135 lakhsDRs. 531 lakhs
In the given bar graph , the white bar shows the income and the black bar shows the expenditure of company (in Rs. Lakhs) . Study the graph and answer the question that follows .
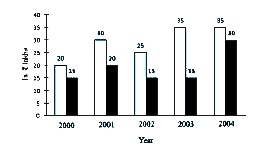
The percentage decrease in the income of the company in 2002 as compared to that in 2001 is :
View SolutionIn the given bar graph, the Blue bar shows the income and the Red bar shows the expenditure of a company. Study the graph and answer the question that follows
दिए गए दंड आरेख में, नीला दंड एक कंपनी की आय दिखाता है और लाल दंड खर्च (लाख रुपये में) को दर्शाता है। आरेख का अध्ययन करें और उस प्रश्न का उत्तर दें जो नीचे पूछा गया है। The income in 2001 was equal to the expenditure in the year:
2001 में आय किस वर्ष के व्यय के बराबर है :
View SolutionIn the given bar graph, the Blue bar shows the income and the Red bar shows the expenditure of a company. Study the graph and answer the question that follows
दिए गए दंड आरेख में, नीला दंड एक कंपनी की आय दिखाता है और लाल दंड खर्च (लाख रुपये में) को दर्शाता है। आरेख का अध्ययन करें और उस प्रश्न का उत्तर दें जो नीचे पूछा गया है। The percentage decrease in the income of the company in 2002 as compared to that in 2001 is:
2001 की तुलना में 2002 में कंपनी की आय में कितने प्रतिशत में कमी आई है:
View SolutionIn the given bar graph, the Blue bar shows the income and the Red bar shows the expenditure of a company. Study the graph and answer the question that follows
दिए गए दंड आरेख में, नीला दंड एक कंपनी की आय दिखाता है और लाल दंड खर्च (लाख रुपये में) को दर्शाता है। आरेख का अध्ययन करें और उस प्रश्न का उत्तर दें जो नीचे पूछा गया है।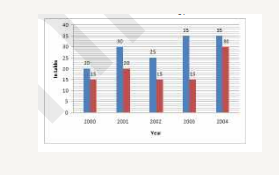 The expenditure from 2001 to 2002 decreased by:
2001 से 2002 तक व्यय में कितनी कमी आई है?
View SolutionThe graph shows Income and Expenditure of a company. Study the graph and answer the questions.
The profit was maximum in the year
View Solution
