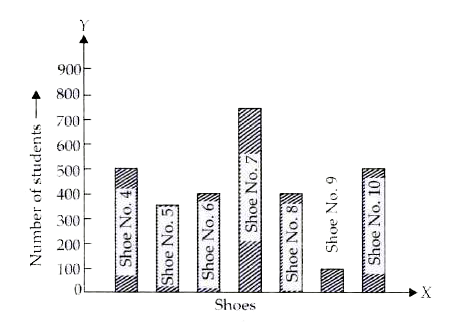
BAR GRAPH: Definition
Step-by-Step Solution for the Definition of a Bar Graph
1. Understanding Graphs: A graph is a visual representation of data. It helps us to understand and analyze numerical information easily.
Hint: Think about how graphs can make complex data simpler to understand.
2. What is a Bar Graph?: A bar graph is a specific type of graph that uses bars to represent numerical data. Each bar's length or height corresponds to the value it represents.
Hint: Consider how the length of each bar can show different quantities.
3. Structure of Bar Graphs: Bar graphs consist of bars that can be arranged either horizontally or vertically. Each bar has a uniform width, meaning all bars are the same thickness.
Hint: Visualize how the bars are spaced out evenly in a graph.
4. Spacing Between Bars: It is important that there is equal spacing between the bars in a bar graph. This uniformity helps in accurately representing the data.
Hint: Think about how consistent spacing can help in comparing the values represented by the bars.
5. Purpose of Bar Graphs: Bar graphs are used to compare different categories of data. They make it easy to see which categories have higher or lower values.
Hint: Reflect on how you can quickly identify trends or differences in data using a bar graph.
Summary
A bar graph is a pictorial representation of numerical data using bars of uniform width, arranged either horizontally or vertically, with equal spacing between them. It is a useful tool for comparing different categories of data.
A bar graph is a pictorial representation of numerical data using bars of uniform width, arranged either horizontally or vertically, with equal spacing between them. It is a useful tool for comparing different categories of data.
Similar Questions
Knowledge Check
In the given bar graph, what is the average number of females in all five organisations?
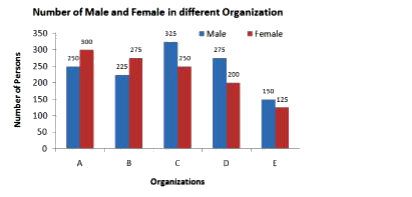 A245B235C230D225
Recap|Empirical Relationship|Question Practice|Bar Graph|OMR
View SolutionIn the given bar graph, what is the average number of females in all five organisation.
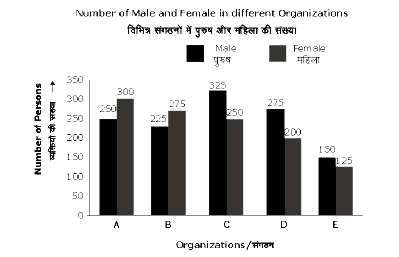
View SolutionRecap|Empirical Relationship|Question Practice|Bar Graph|OMR
View SolutionReading and interpretation of bar graphs
View SolutionRead the following bar graph given in figure and answer the following questions.
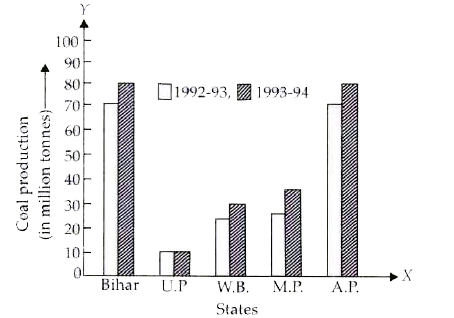
(i) What information is given by this bar graph?
View SolutionRead the bar graph and answer the following questons.
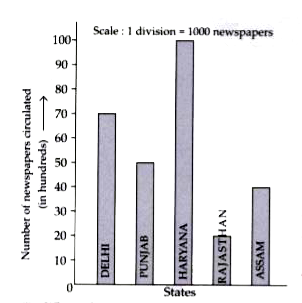
What information is given by graph ?
View SolutionRead the graph and answer the following questions
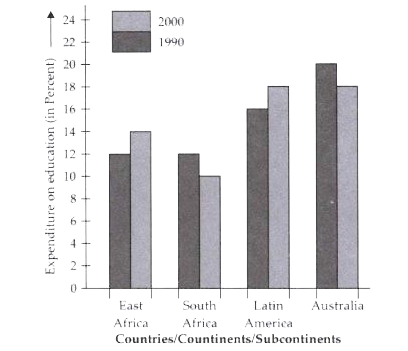
Give a suitable title to bar graph
View Solution

