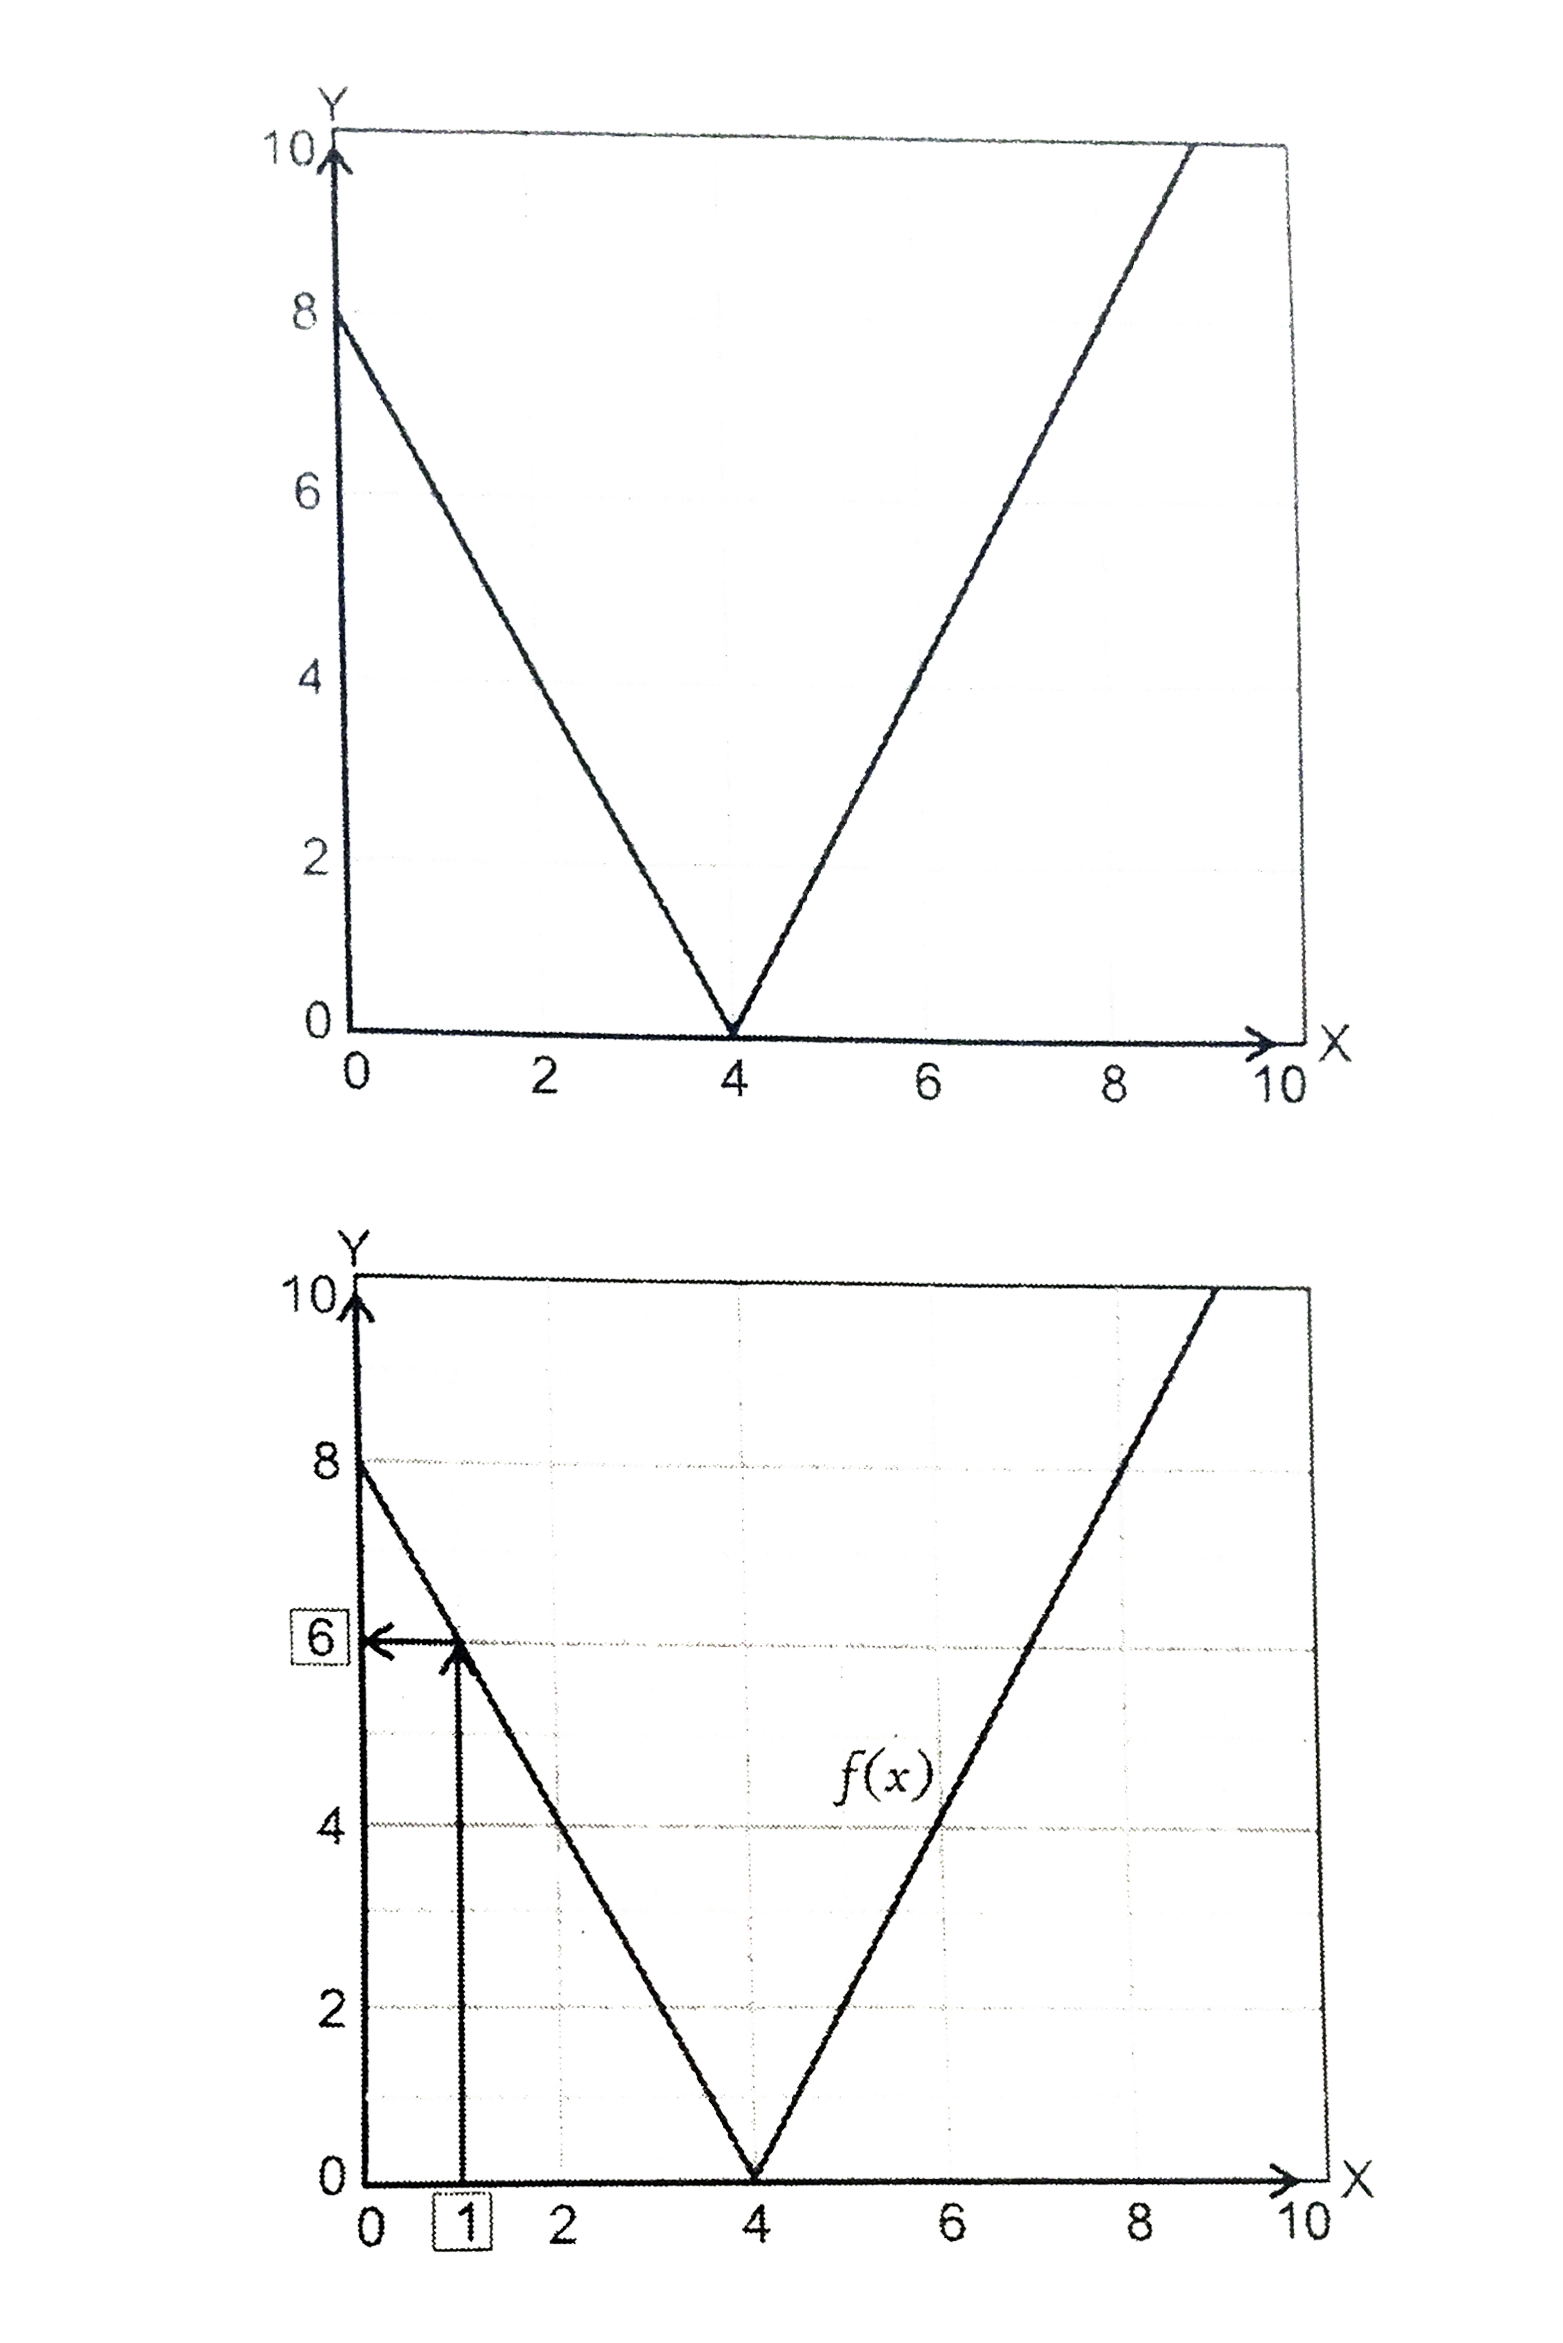
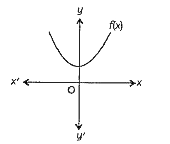
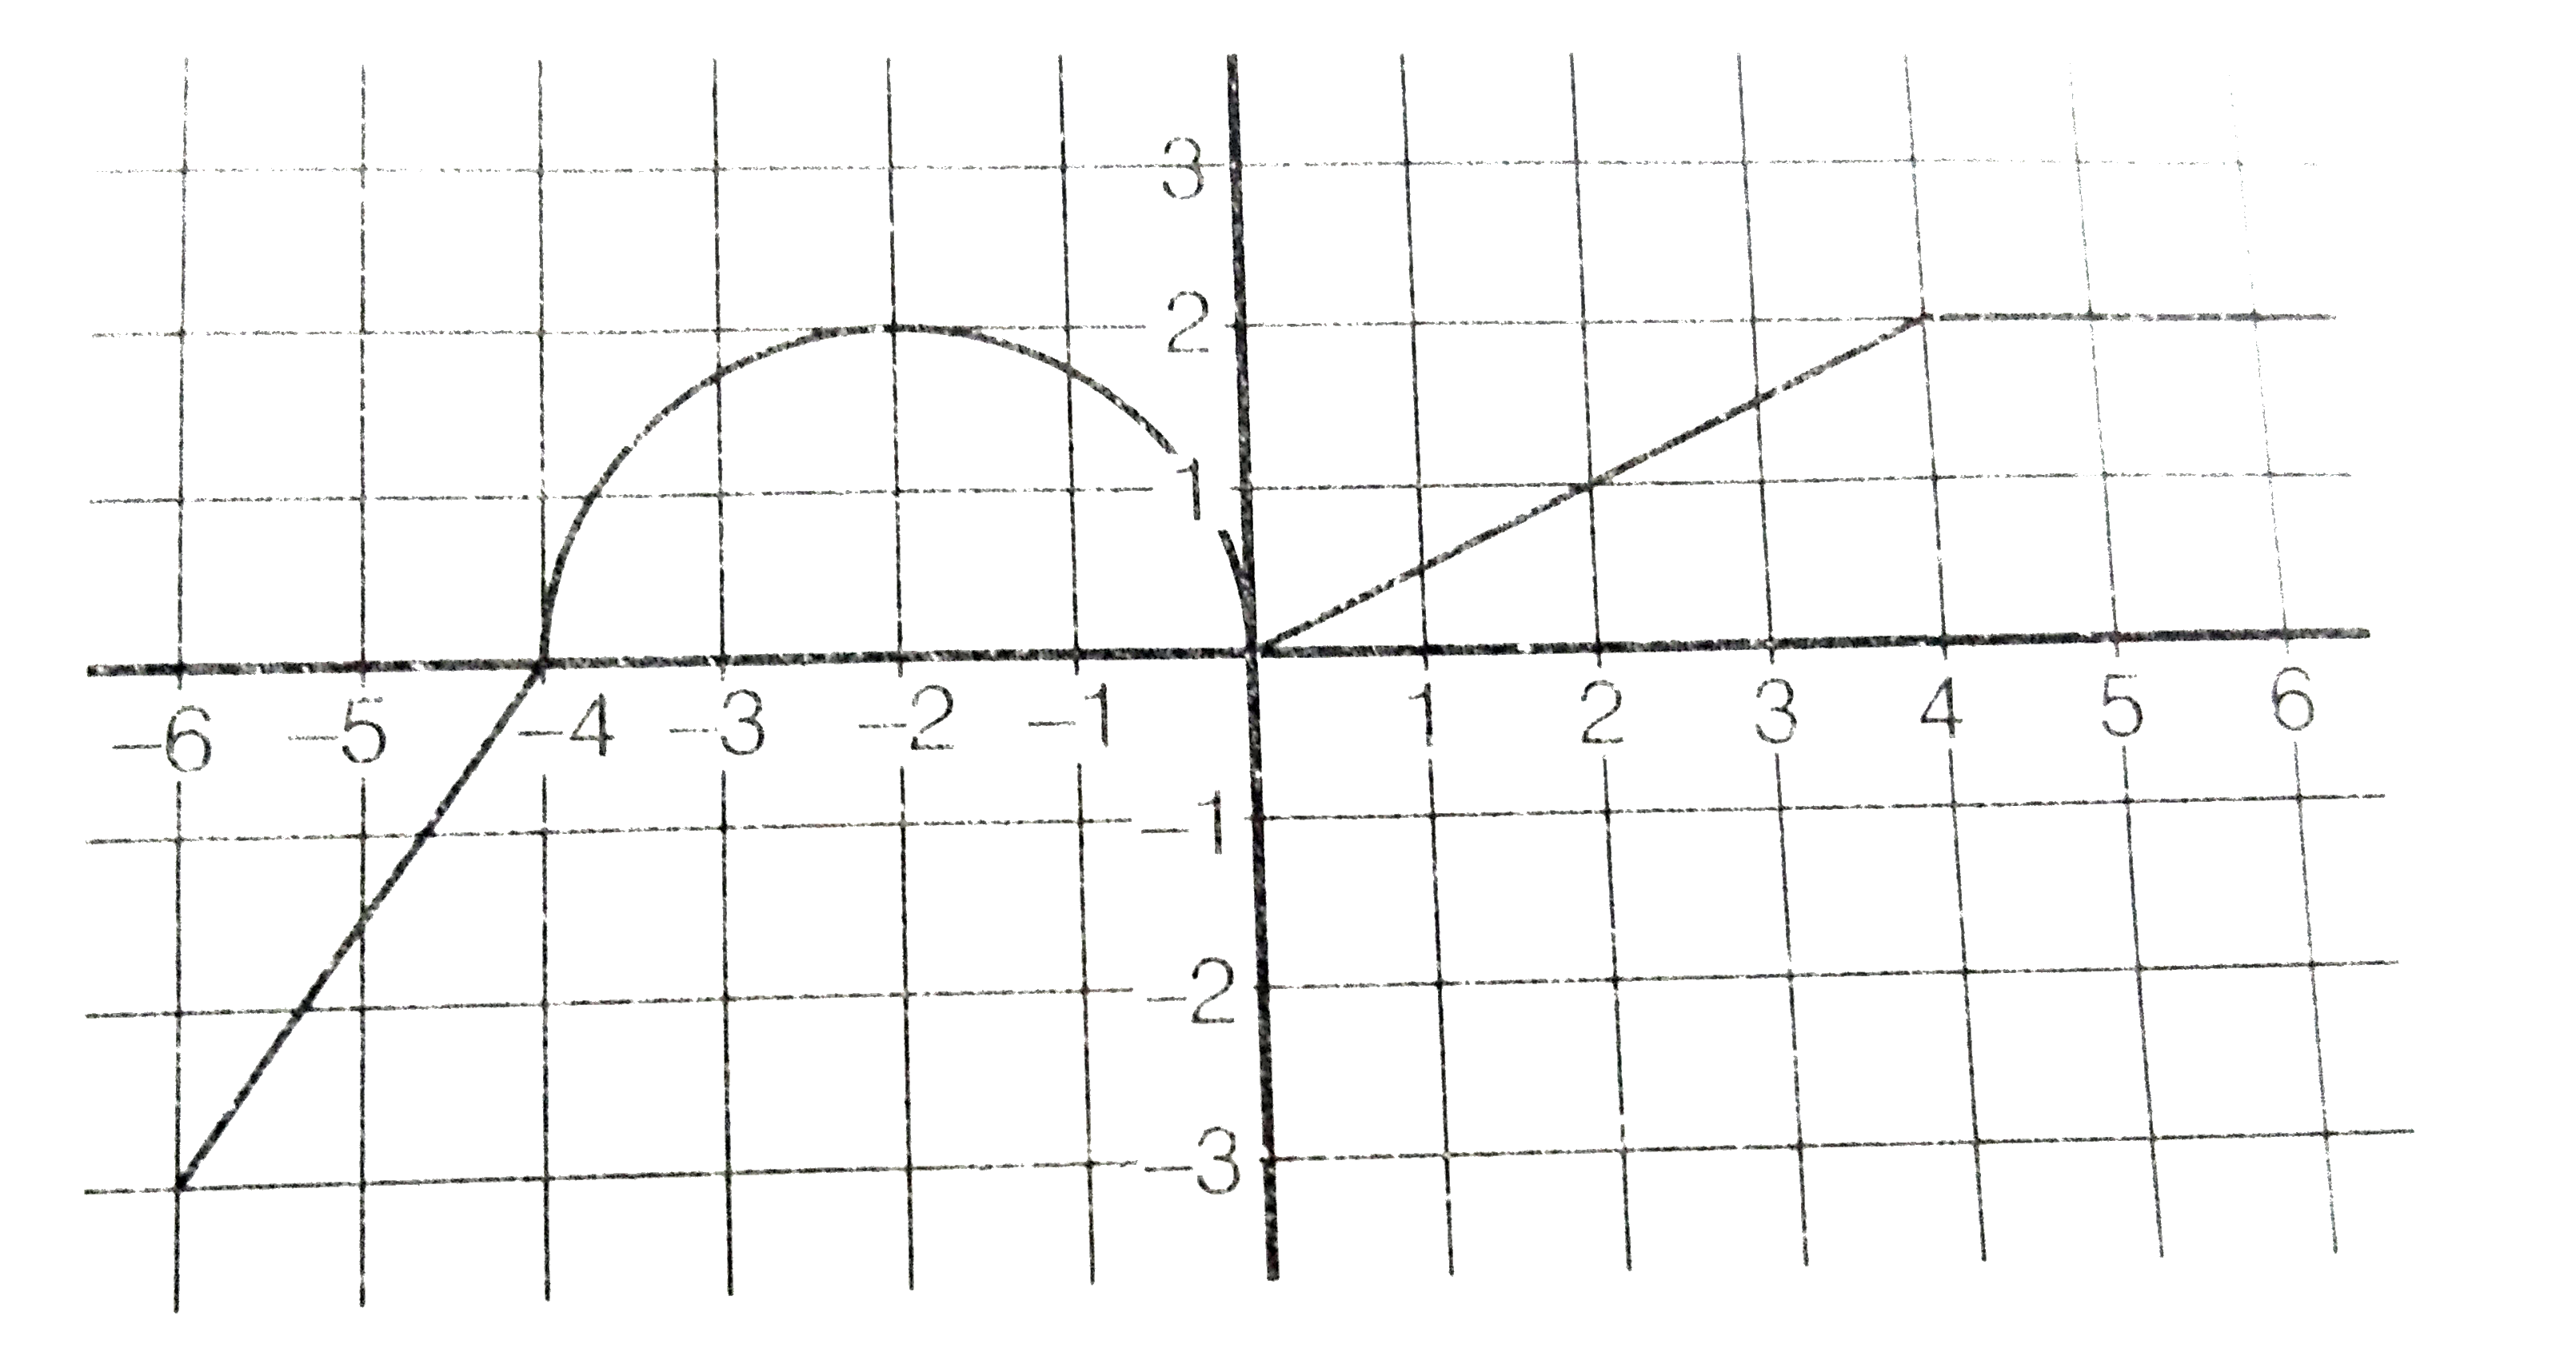
Given the graph of f(x) is shown below.

Text Solution
Sketch the graphs of y|f(x)|andy=f(|x|).
Since |f(x)|≥0, by the definition of absolute value, the graph cannot have any points below the x-axis. If f(x)<0, then |f(x)|=−f(x). Thus, all points below the x-axis are reflected about the x-axis, and all points above the x-axis remain unchanged.

Since the absolute value of x is taken before the function value is found, and since |x|=−x when x<0, any negative value of x will graph the same y-values as the corresponding positive values of x. Thus, the graph to the left of the y-axis will be a reflection of the graph to the right of the y-axis.

|
Topper's Solved these Questions
- PIECEWISE FUNCTIONSBOOK - ENGLISH SATCHAPTER - PIECEWISE FUNCTIONSEXERCISE - EXERCISES
8 Videos
- PASSPORT TO ADVANCED MATHBOOK - ENGLISH SATCHAPTER - PASSPORT TO ADVANCED MATHEXERCISE - EXERCISE
80 Videos
- PLANE GEOMETRY/ TRIGONOMETRYBOOK - ENGLISH SATCHAPTER - PLANE GEOMETRY/ TRIGONOMETRYEXERCISE - EXERCISE
12 Videos
Similar Questions
Knowledge Check
The graph of y=f(x) is shown below.
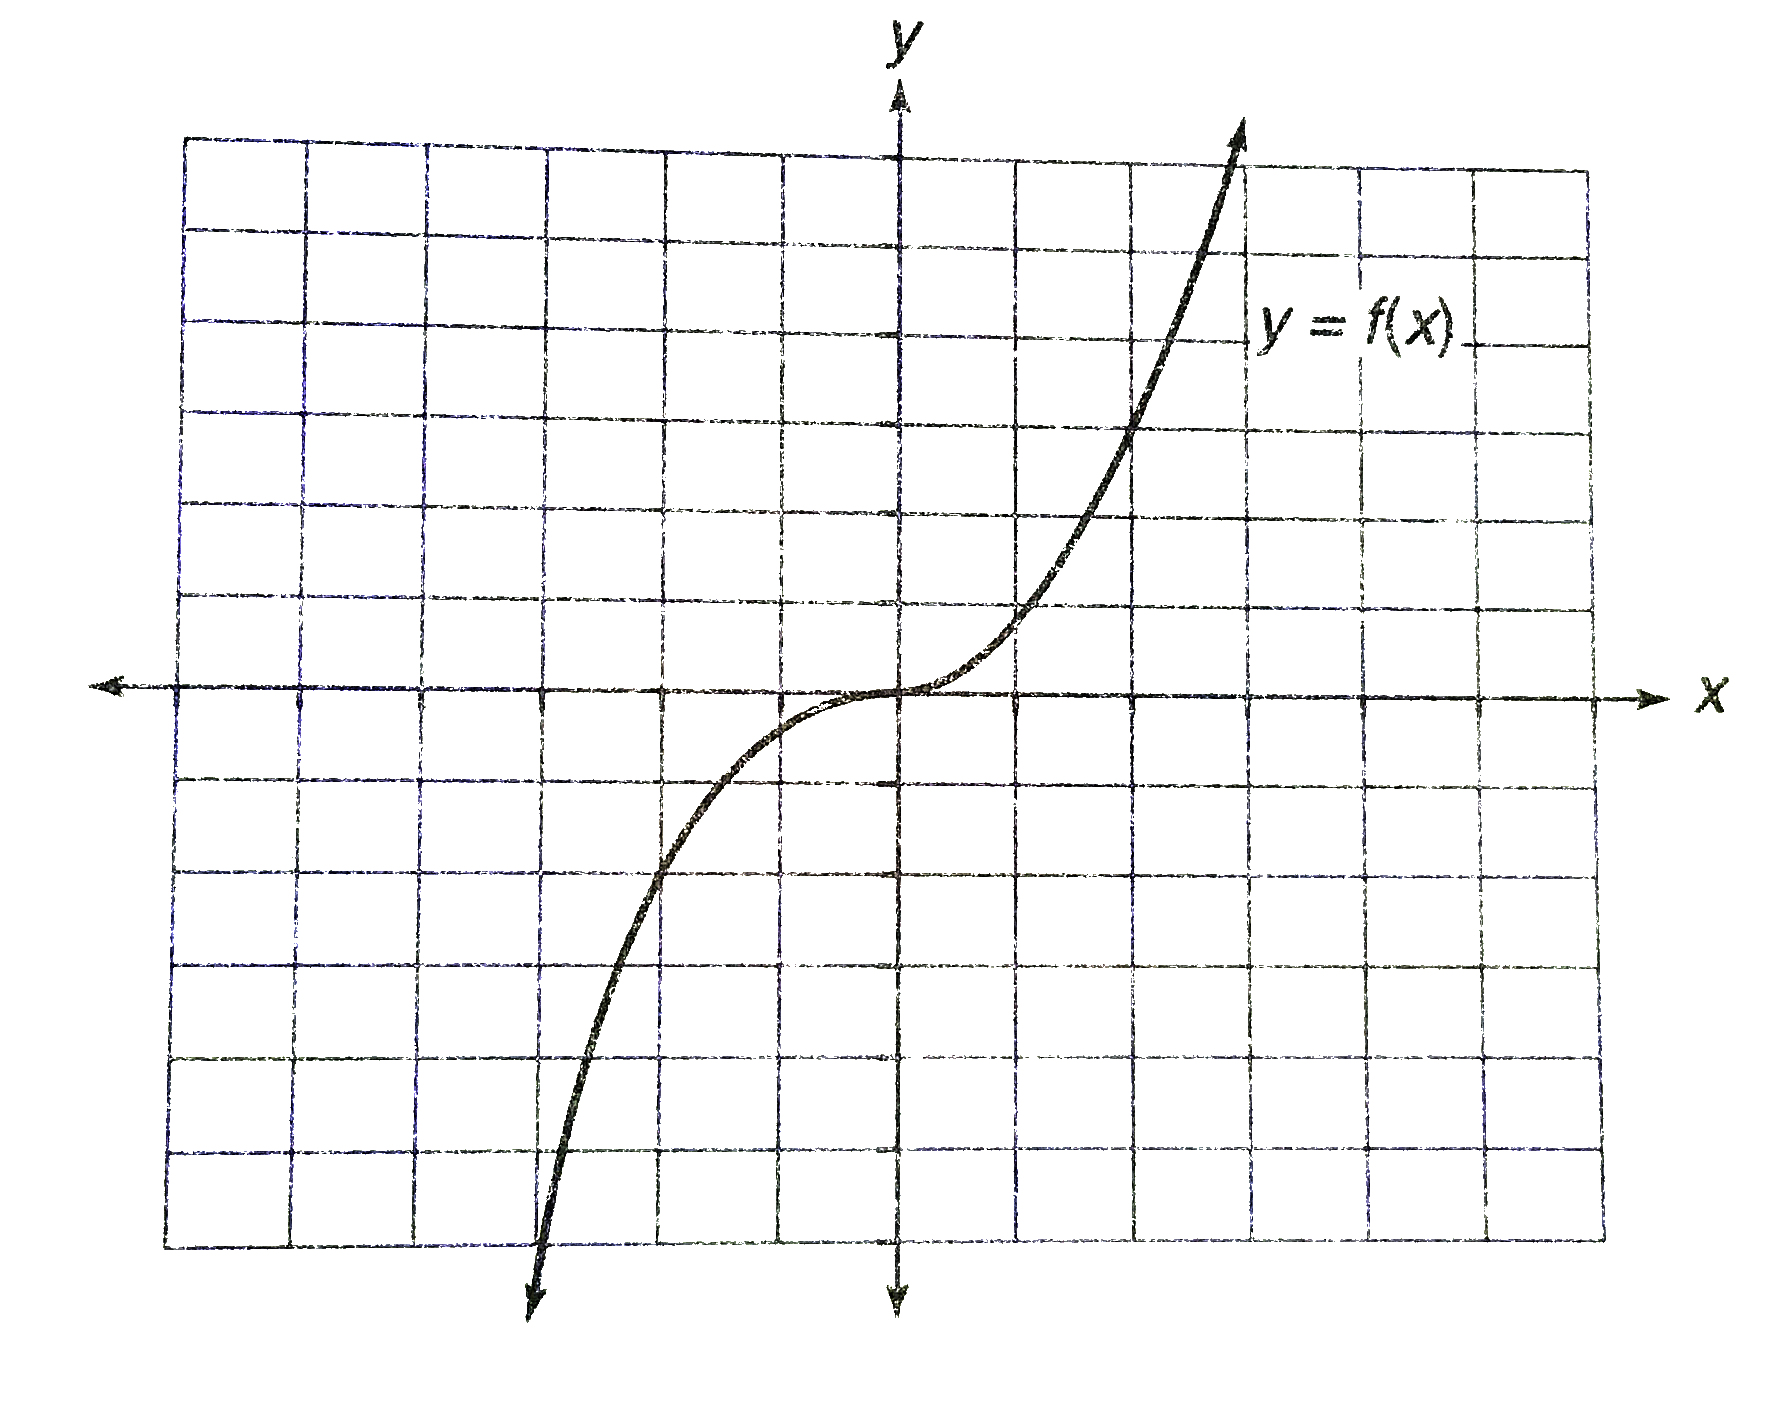
Which of the following could represents the graph of y=f(x−2)+1?A B
B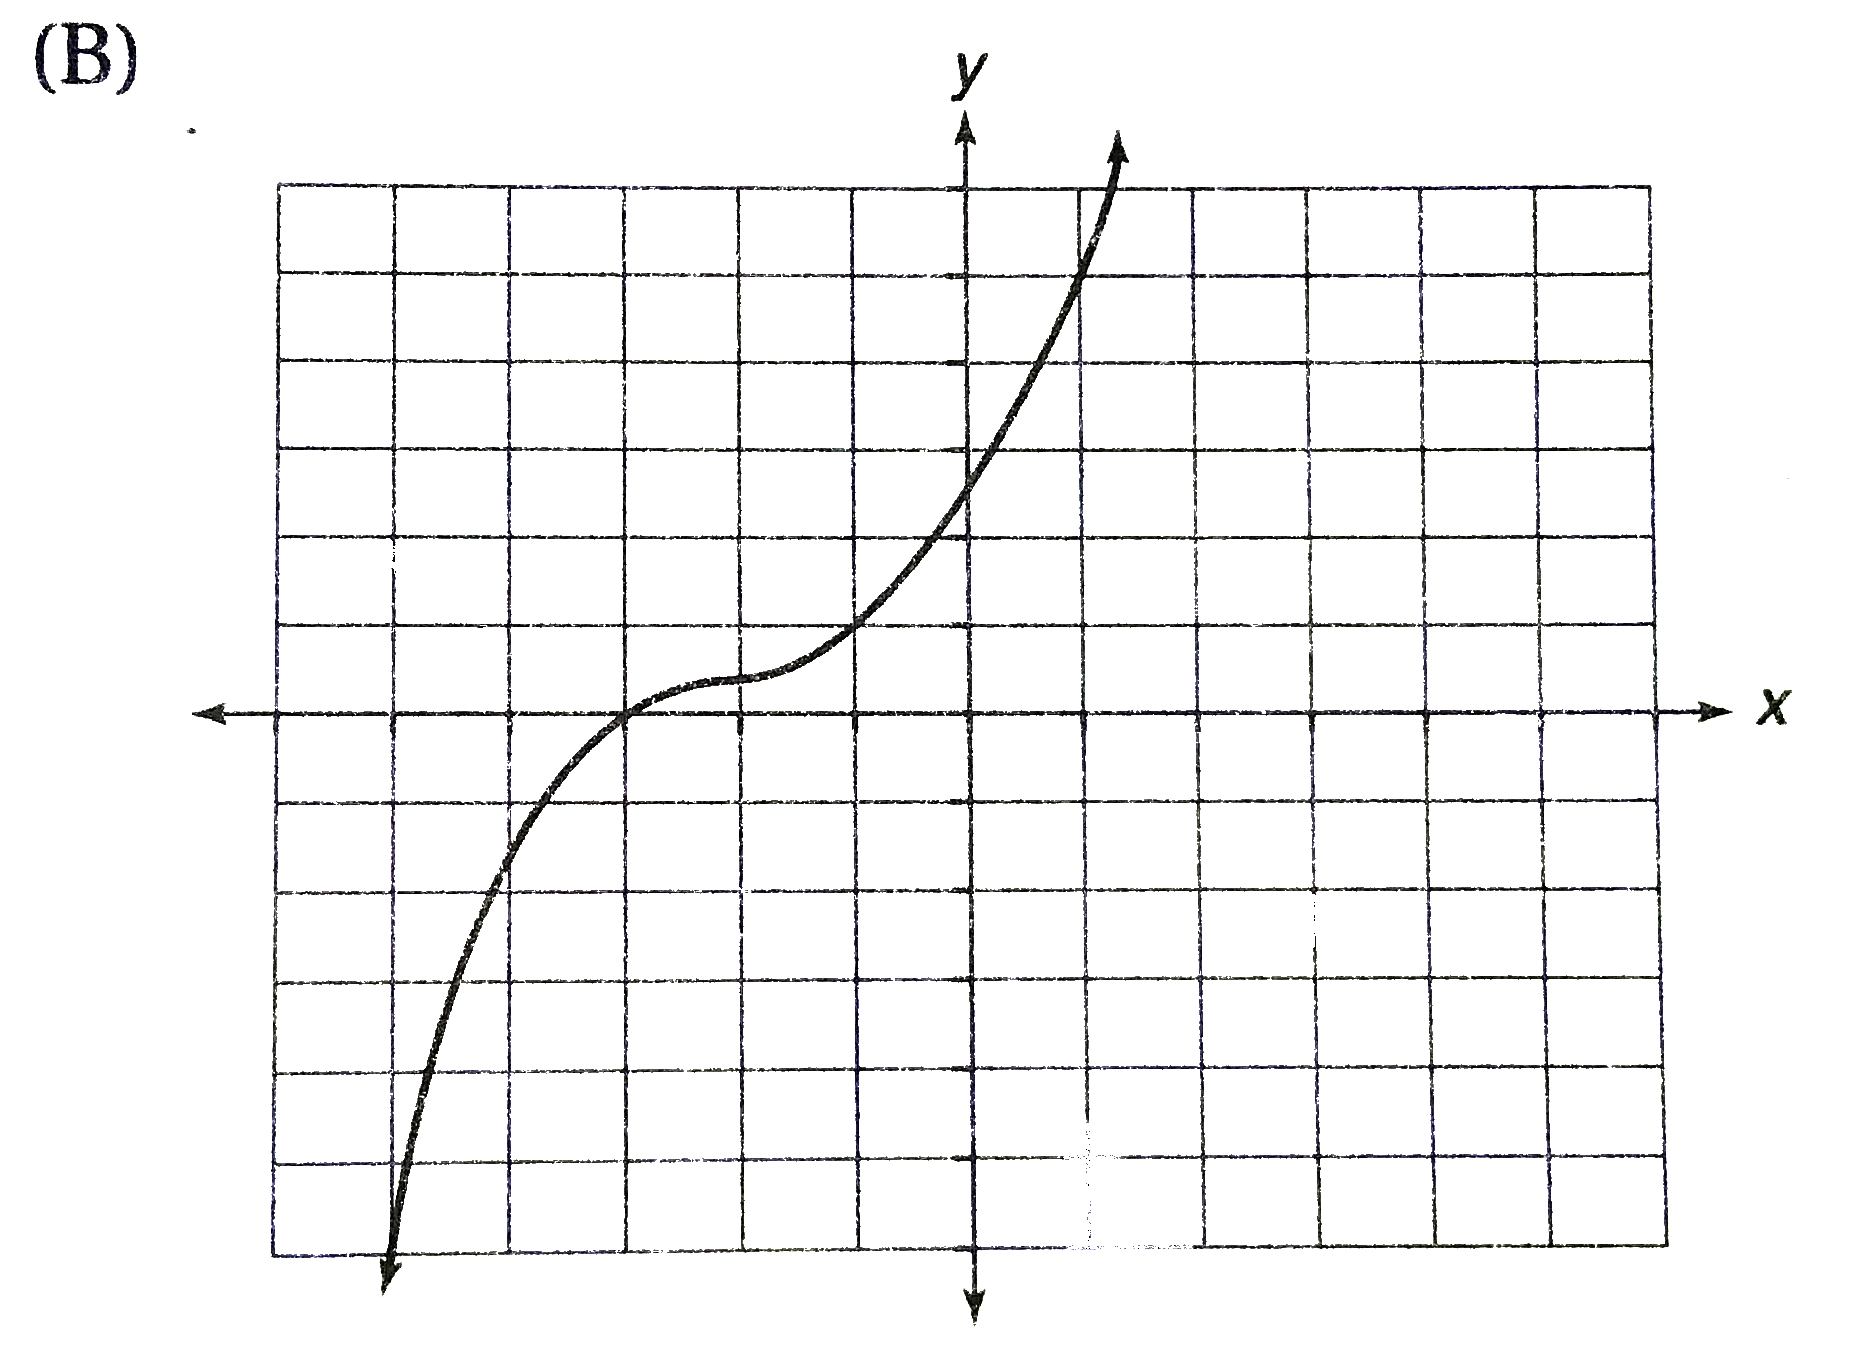 C
C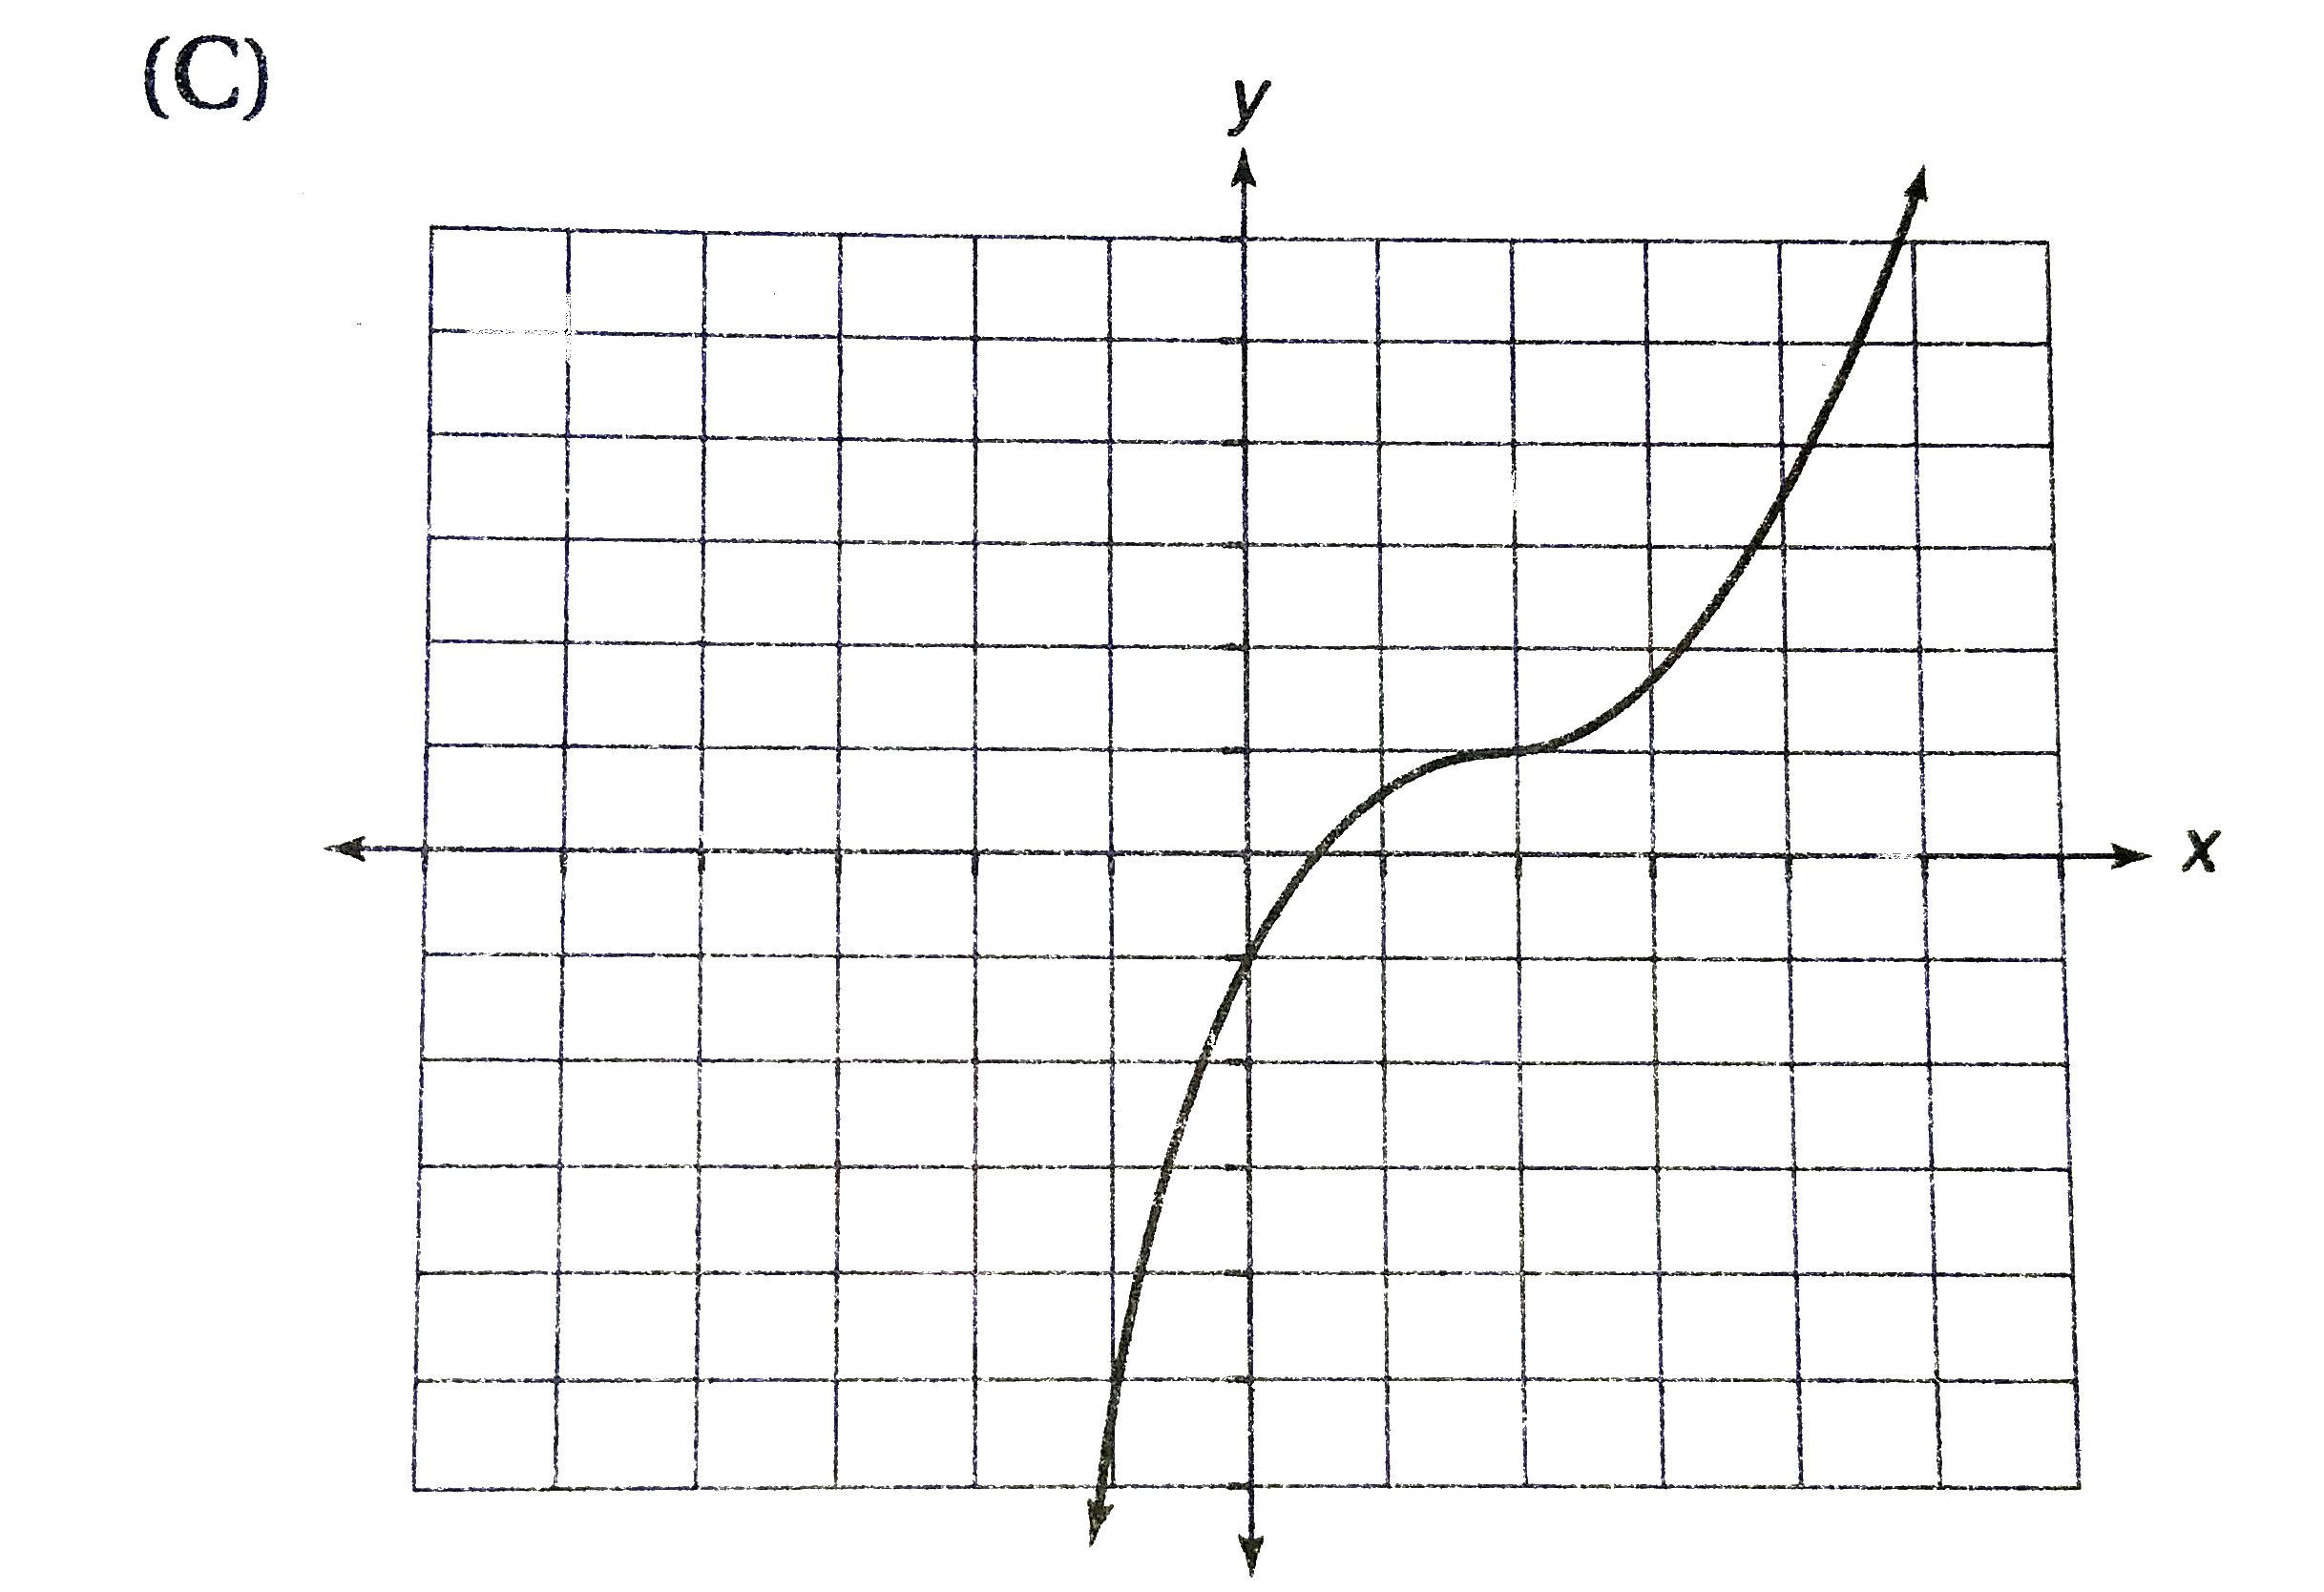 D
D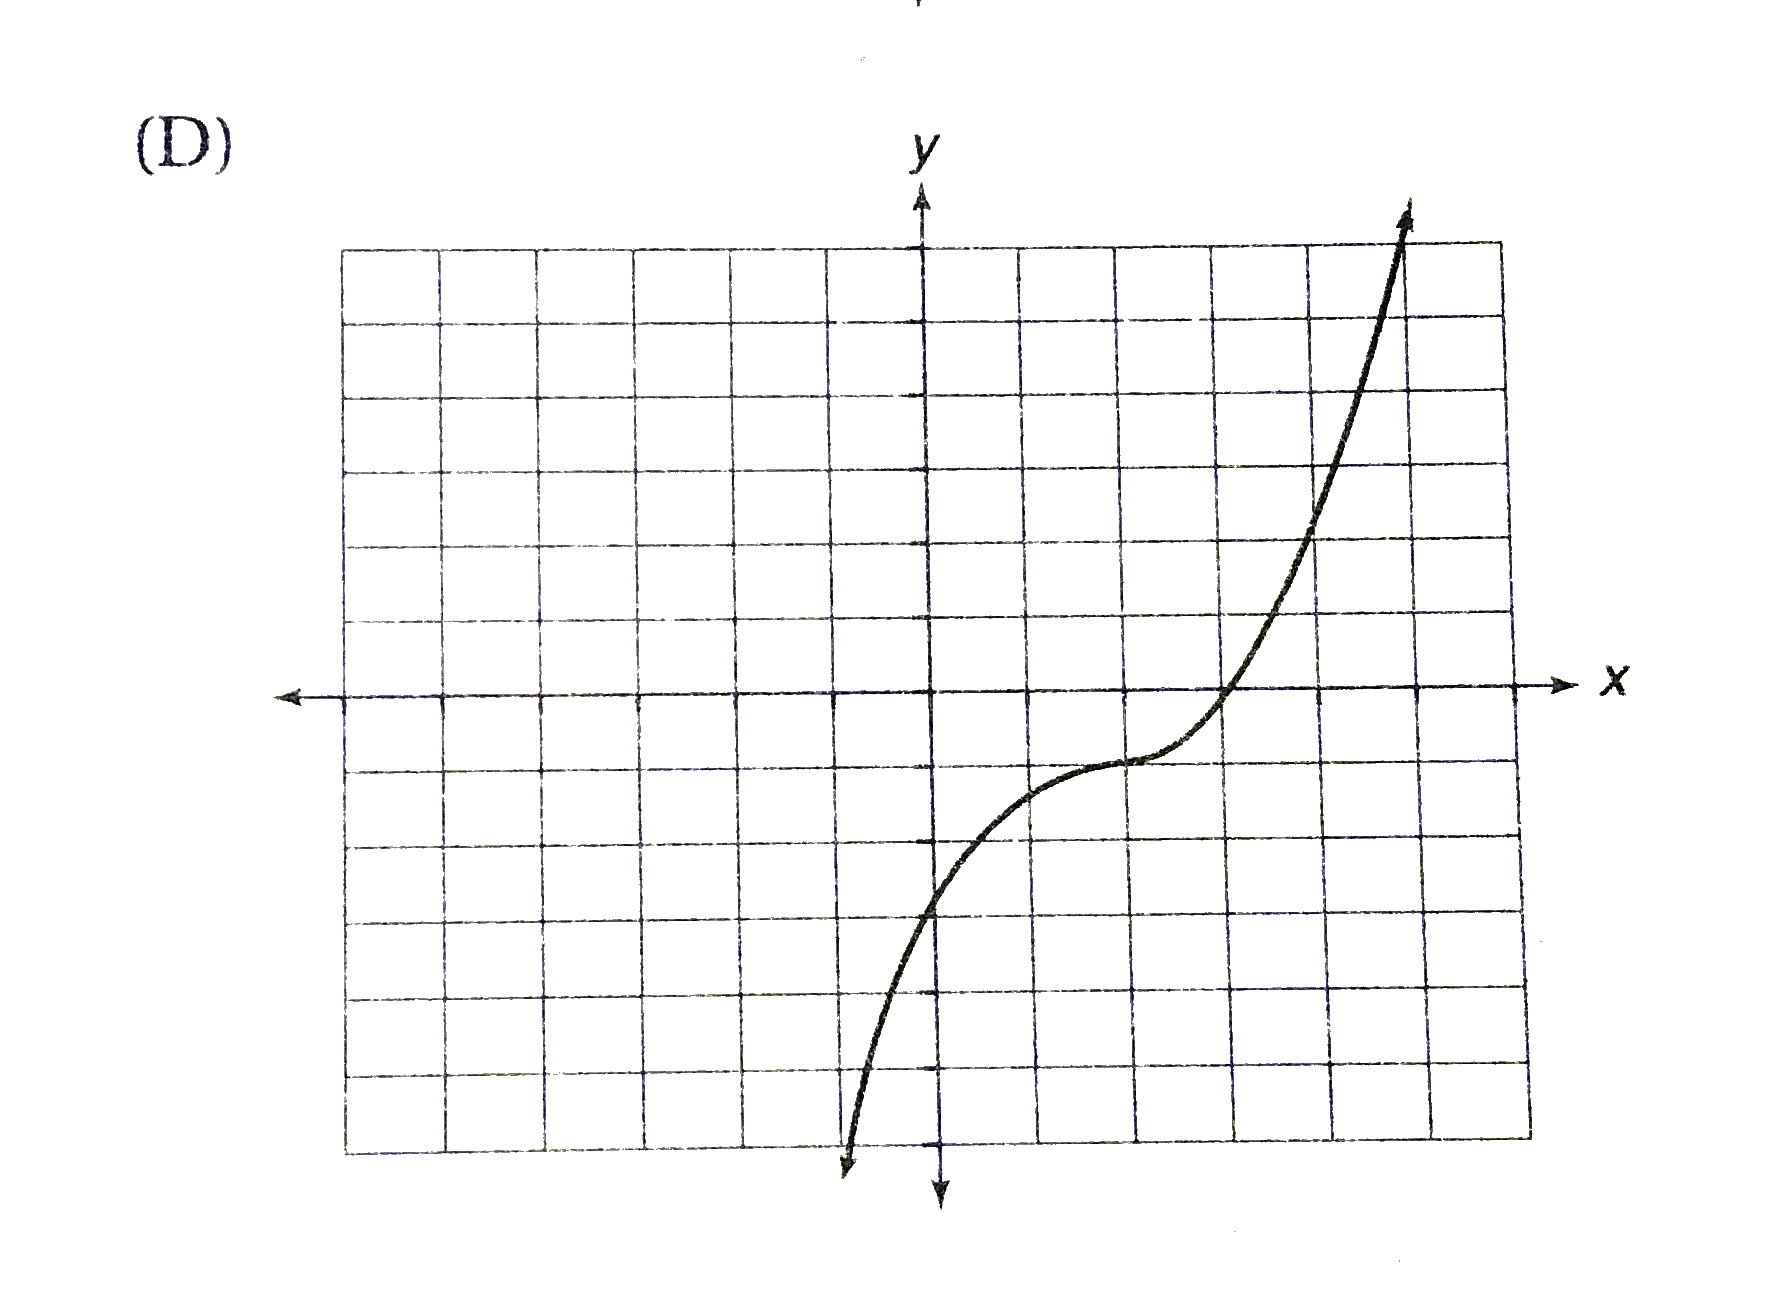
The graph of f(x) is shown below :
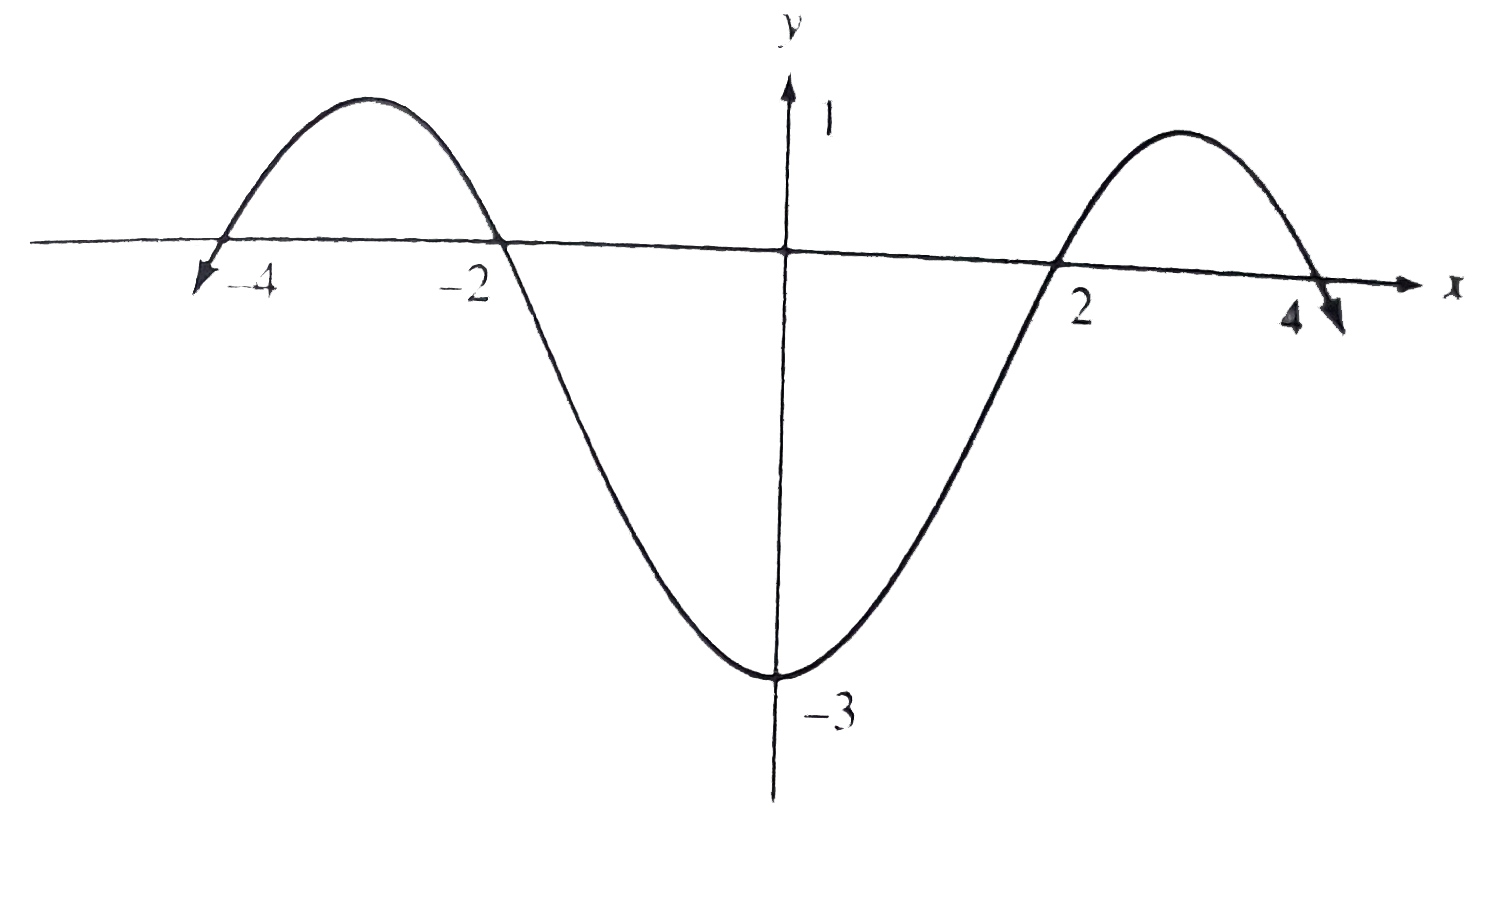
A transformation is applied that results in the following graph :
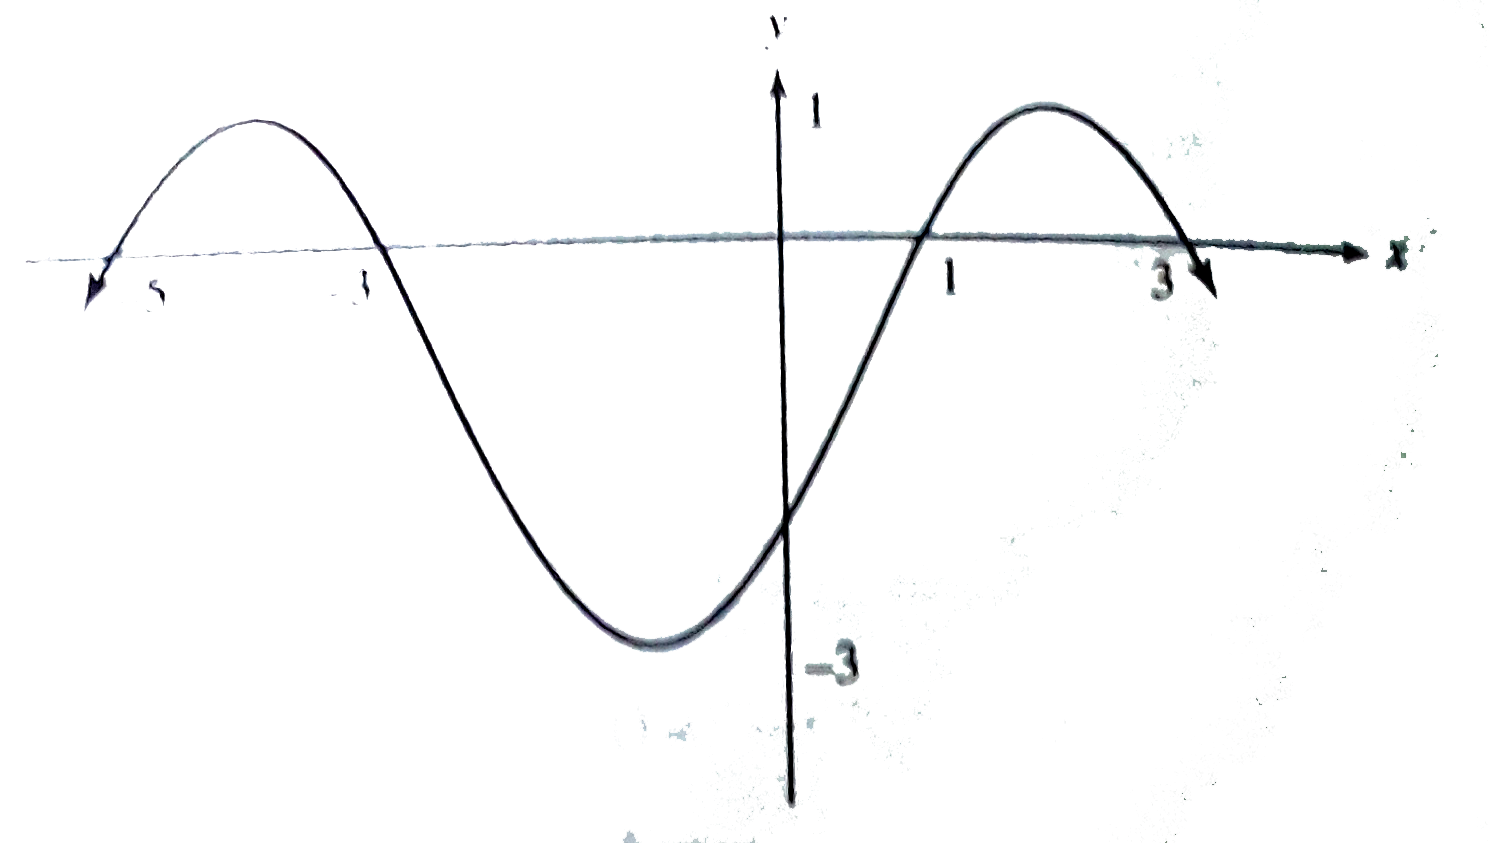
Which of the following functions describes this graph ?Af(x-1)Bf(x+1)Cf(x)-1Df(x)+1
For the graph of y = f(x) shown below, how many zeroes of f(x) are there ?
View SolutionThe graph of f(x) is given below.
Then, (a) Graph of −f(x)+2 is

View SolutionThe graph of f(x) is given below.

Then, (a) Graph of −f(x)+2 is

View SolutionThe graph of function f(x) is shown below :
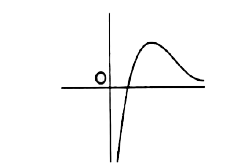
Then the graph of g(x)=1f(|x|) is:
View SolutionThe graph of function f(x) is shown below :

Then the graph of g(x)=1f(|x|) is:
View SolutionThe graph of function f(x) is shown below :

Then the graph of g(x)=1f(|x|) is:
View Solution

