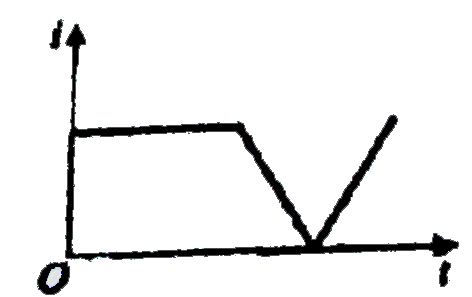
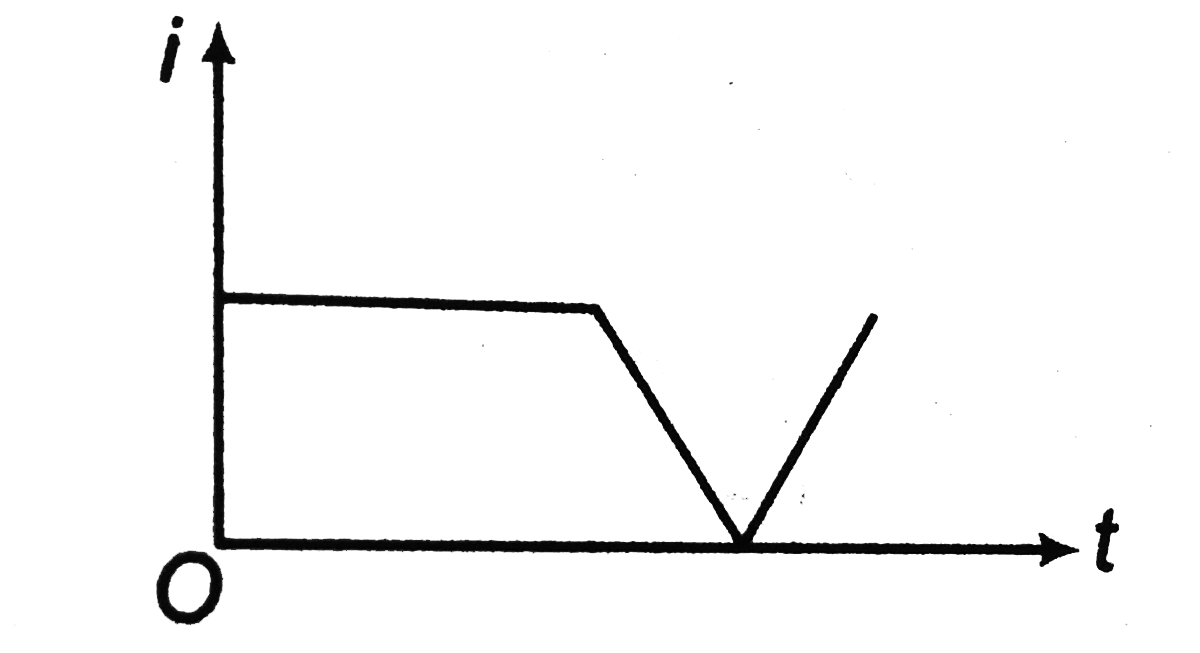
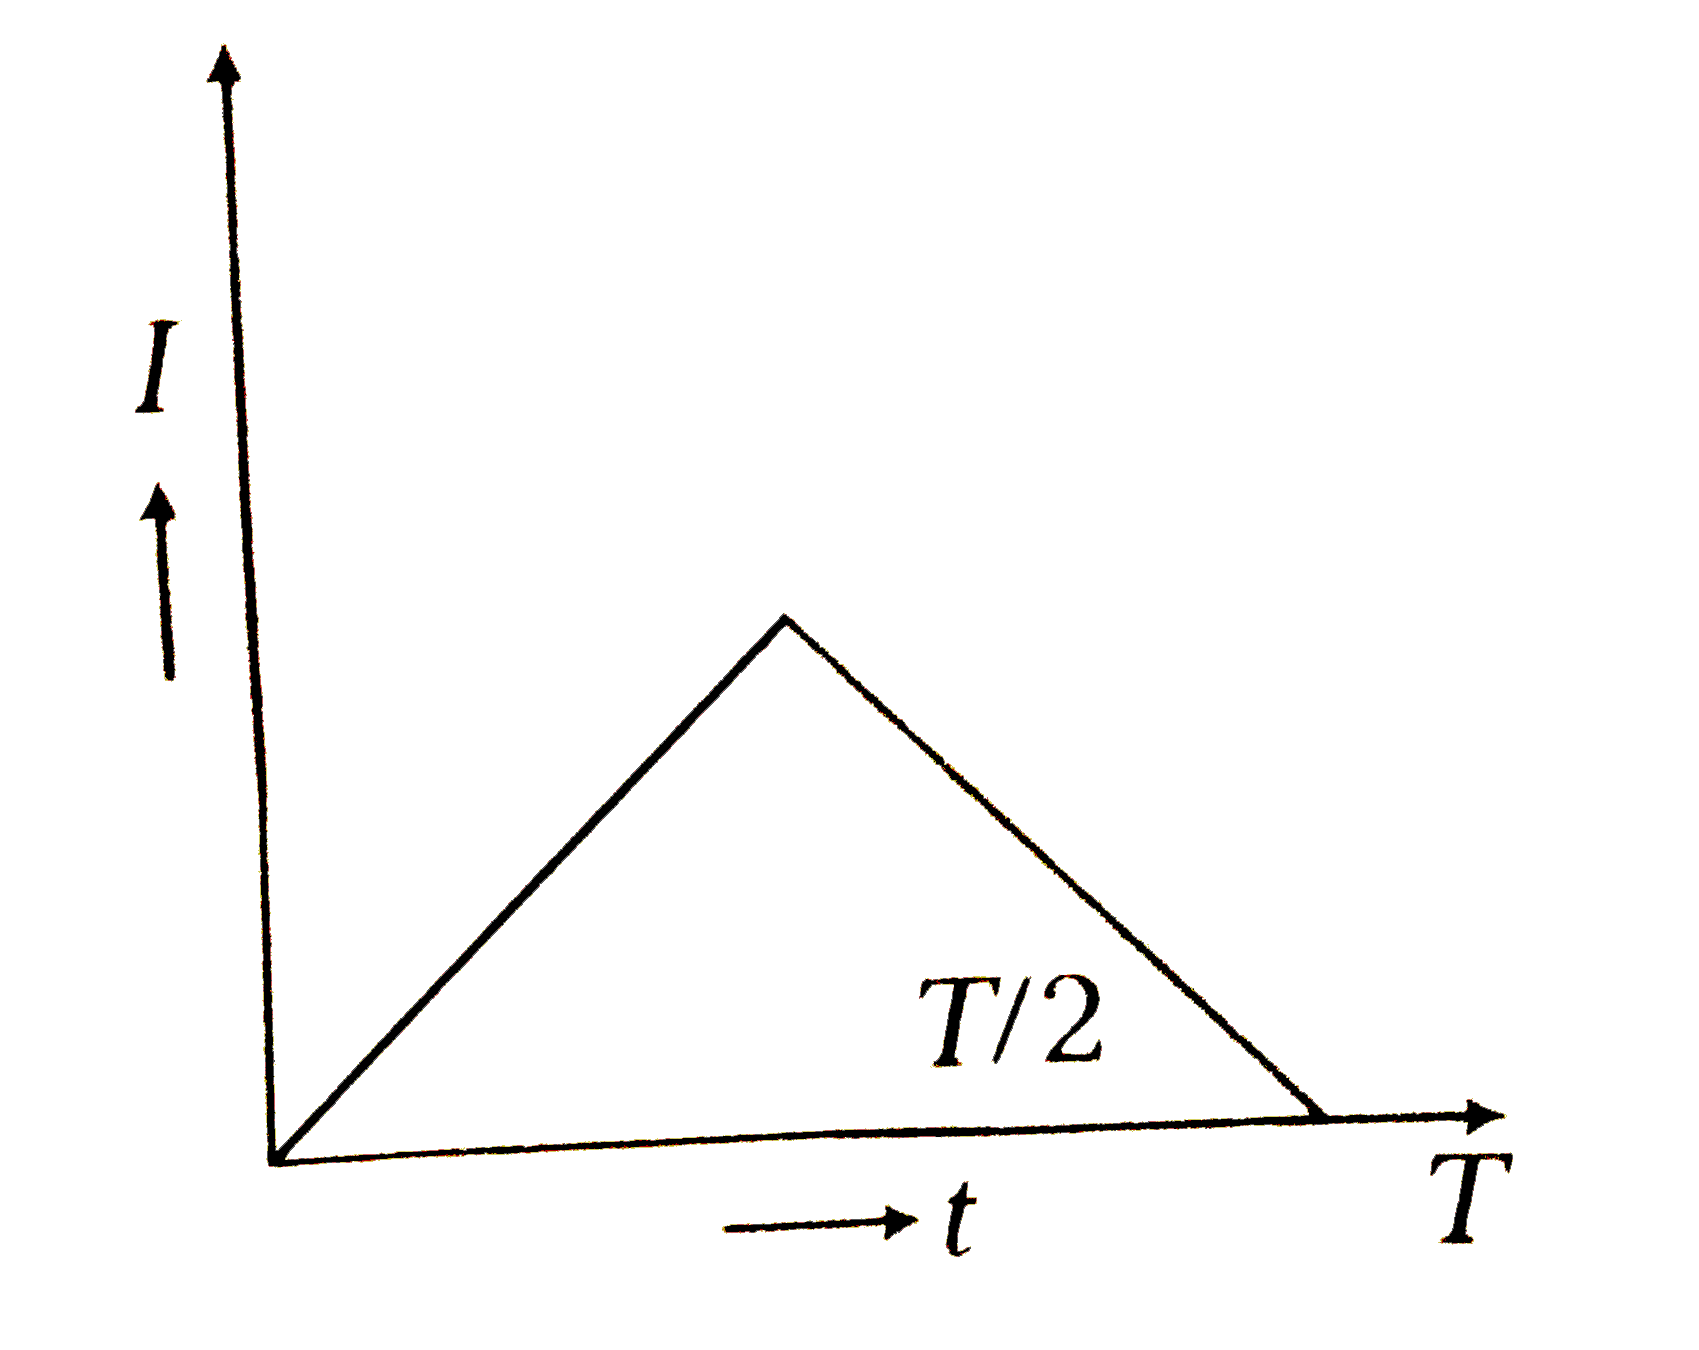
The current i in an induction coil varies with time according to the graph shown in figure. Which of the following graph shows induced emf in the coil with time:
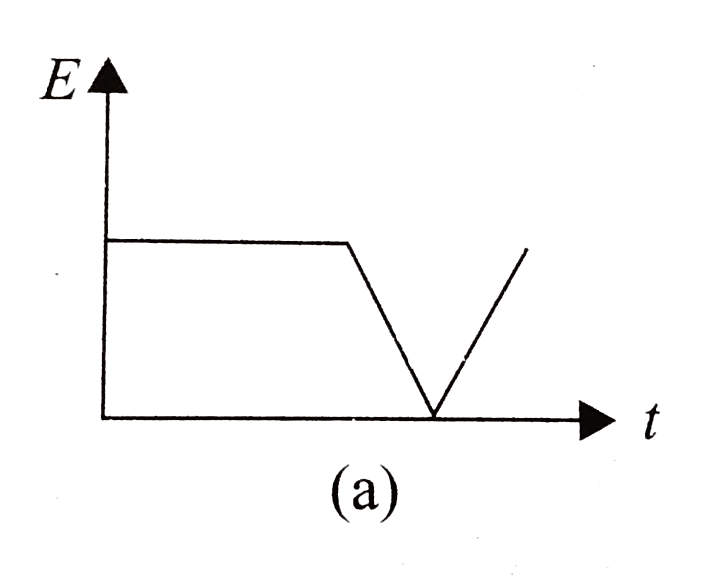
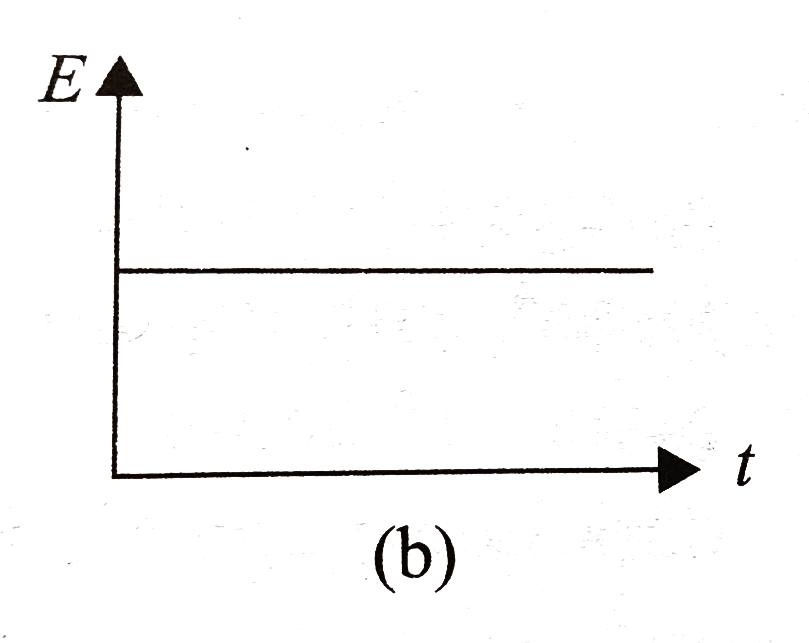
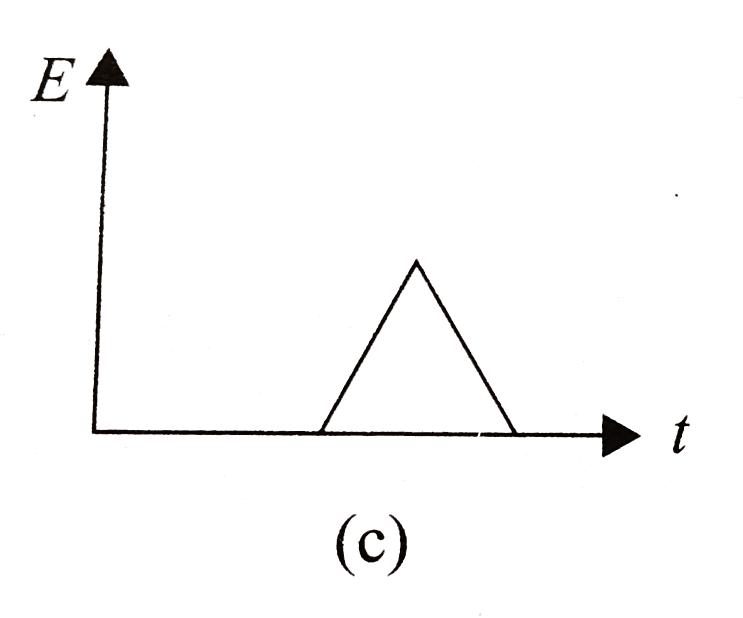
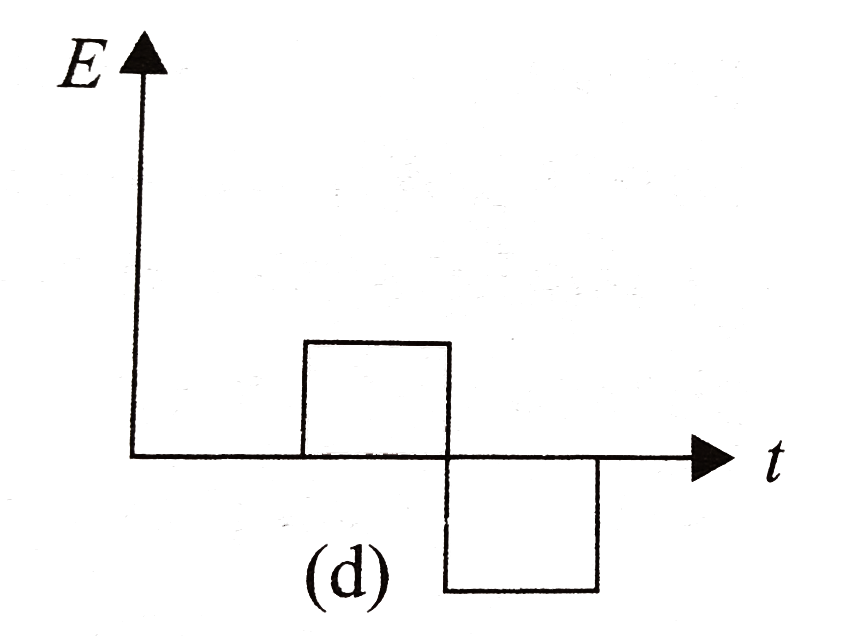
The correct Answer is:D
To solve the problem, we need to analyze the relationship between the current I in the induction coil and the induced electromotive force (emf) ϵ over time. The induced emf is given by Faraday's law of electromagnetic induction, which states:
ϵ=−LdIdt
where L is the inductance of the coil and dIdt is the rate of change of current with respect to time.
1. Analyze the Current Graph:
- The current I varies with time according to a given graph. We need to identify the intervals where the current is changing and where it is constant.
2. Determine dIdt:
- For the time interval from 0 to T1:
- The current is constant (flat line), so dIdt=0.
- Thus, the induced emf ϵ=−L⋅0=0.
- For the time interval from T1 to T2:
- The current is decreasing (the graph slopes downward).
- Here, dIdt<0 (negative value), which means ϵ will be positive (since the negative sign in the formula will cancel out the negative rate of change).
- Since the slope is constant, ϵ will also be constant during this interval.
3. Evaluate the Remaining Time Intervals:
- For the time interval from T2 to T3:
- If the current is again constant, dIdt=0 and thus ϵ=0.
- For the time interval from T3 onwards:
- If the current is increasing, dIdt>0 which will result in a negative induced emf (since the formula has a negative sign).
4. Construct the Induced EMF Graph:
- From 0 to T1: ϵ=0.
- From T1 to T2: ϵ is a constant positive value.
- From T2 to T3: ϵ=0.
- From T3 onwards: ϵ is a constant negative value.
5. Select the Correct Graph:
- Based on the analysis, the graph of induced emf ϵ versus time should reflect these intervals: zero, a constant positive value, back to zero, and then a constant negative value.
Conclusion:
The correct graph showing the induced emf in the coil with time would be the one that matches the described behavior of ϵ.
- The current I varies with time according to a given graph. We need to identify the intervals where the current is changing and where it is constant.
- For the time interval from 0 to T1:
- The current is constant (flat line), so dIdt=0.
- Thus, the induced emf ϵ=−L⋅0=0.
- For the time interval from T1 to T2:
- The current is decreasing (the graph slopes downward).
- Here, dIdt<0 (negative value), which means ϵ will be positive (since the negative sign in the formula will cancel out the negative rate of change).
- Since the slope is constant, ϵ will also be constant during this interval.
- For the time interval from T2 to T3:
- If the current is again constant, dIdt=0 and thus ϵ=0.
- For the time interval from T3 onwards:
- If the current is increasing, dIdt>0 which will result in a negative induced emf (since the formula has a negative sign).
- From 0 to T1: ϵ=0.
- From T1 to T2: ϵ is a constant positive value.
- From T2 to T3: ϵ=0.
- From T3 onwards: ϵ is a constant negative value.
- Based on the analysis, the graph of induced emf ϵ versus time should reflect these intervals: zero, a constant positive value, back to zero, and then a constant negative value.
The correct graph showing the induced emf in the coil with time would be the one that matches the described behavior of ϵ.
Topper's Solved these Questions
- BOOK - CENGAGE PHYSICS ENGLISHCHAPTER - MISCELLANEOUS VOLUME 5EXERCISE - Multiple Correct34videos
MISCELLANEOUS VOLUME 5
- BOOK - CENGAGE PHYSICS ENGLISHCHAPTER - MISCELLANEOUS VOLUME 5EXERCISE - Linked Comprehension84videos
MISCELLANEOUS VOLUME 5
- BOOK - CENGAGE PHYSICS ENGLISHCHAPTER - MISCELLANEOUS VOLUME 3EXERCISE - True and False3videos
MISCELLANEOUS VOLUME 3
- BOOK - CENGAGE PHYSICS ENGLISHCHAPTER - NUCLEAR PHYSICSEXERCISE - ddp.5.514videos
NUCLEAR PHYSICS
Similar Questions
The current i in an induction coil varies with time t according to the graph shown in the figure-5.250. Which of the following graphs shows the induced EMF in the coil with time ?
 View Solution
The current i in an inductionn coil varies with time t according to the graph shown in the figure. Which of the following grahs shows athe induced emf (ε) in the coil with time?
 View Solution
The current i in an inductionn coil varies with time t according to the graph shown in the figure. Which of the following grahs shows athe induced emf (ε) in the coil with time?
 View Solution
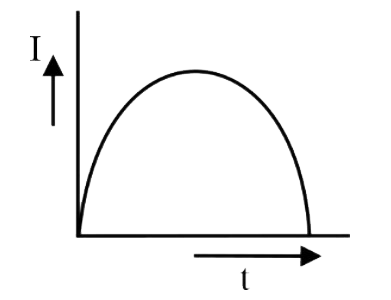
The current I in an inductance coil varies with time according to the graph given in the figure.
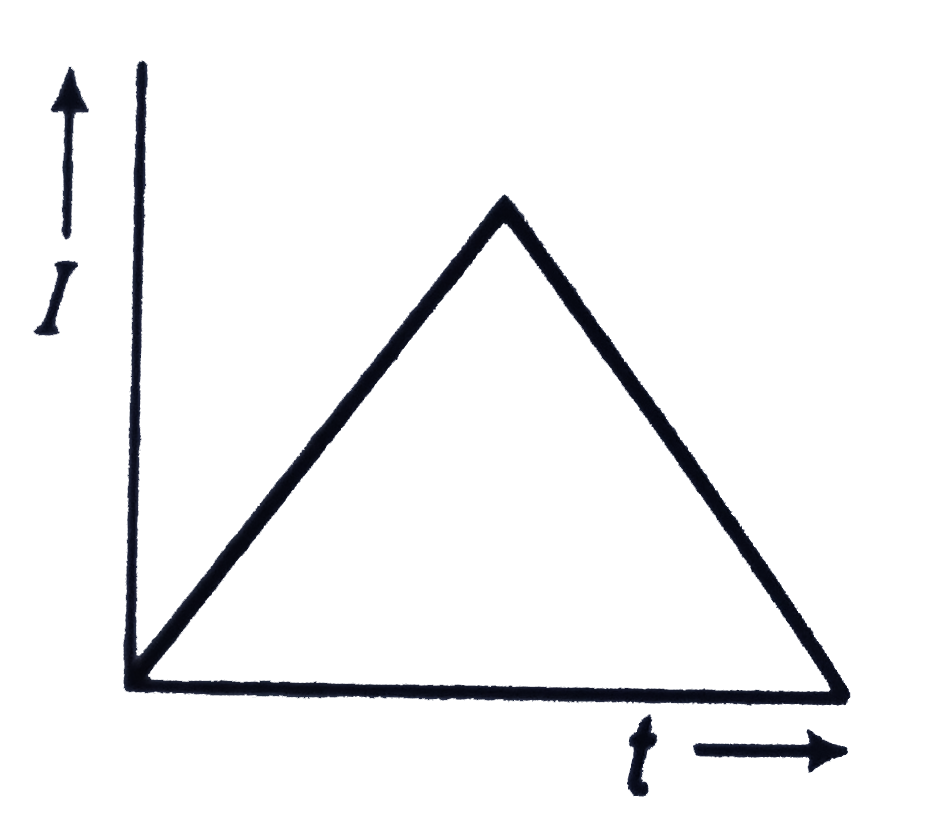
Which one of the following graphs gives the variation of voltage with time across the inductor?View SolutionAn alternating current I in an inductance coil varies with time t according to the graph as shown: Which one of the following graph gives the variation of voltage with time?
 View Solution
An alternating current I in an inductance coil varies with time t according to the graph as shown: Which one of the following graph gives the variation of voltage with time?
 View Solution
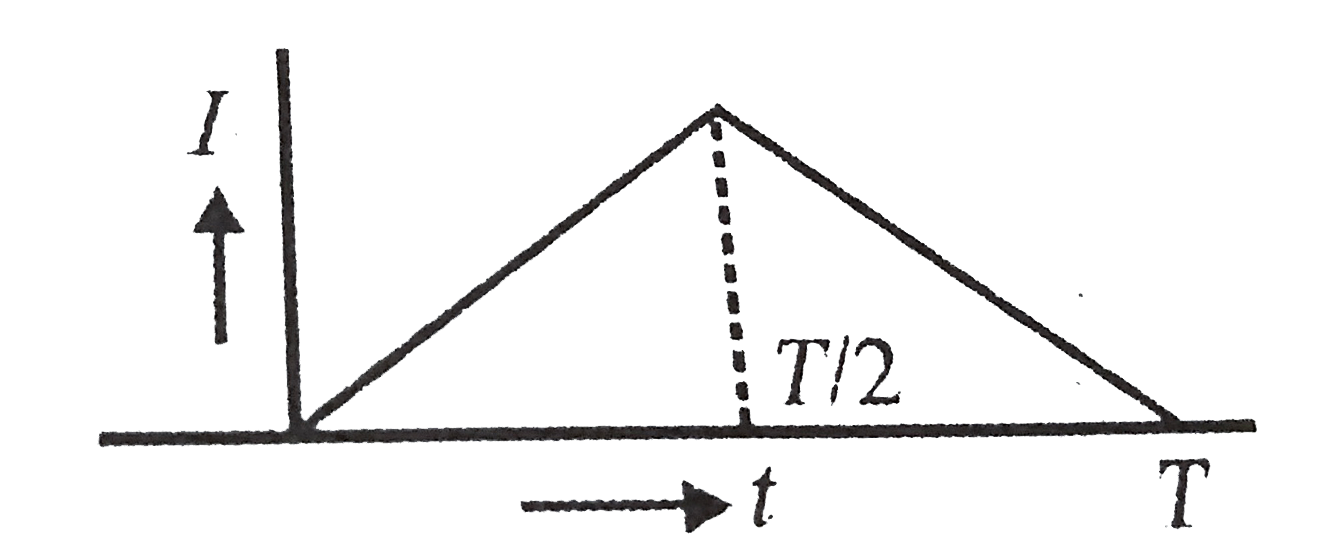
The current (I) in the inductance is varying with time according to the plot shown in figure.
Which one of the following is the corrcet variation of voltage with time in the coil ?View SolutionThe current (I) in the inductance is varying with time according to the plot shown in figure.
Which one of the following is the correct variation of voltage with time in the coil?View SolutionThe current in a coil varies with time as shown in the figuro. The variation of induced emf with time would be
View SolutionThe graph between the current and the time for an inductance coil is shown below. Which of the following graph show the voltage-time variation-
 View Solution

