What is the average production of Company B (in tonnes) from the year 2006 to the year 2011? (a) 574 (b) 649 (c) 675 (d) 593 (e) 618
Step by step video & image solution for What is the average production of Company B (in tonnes) from the year 2006 to the year 2011? (a) 574 (b) 649 (c) 675 (d) 593 (e) 618 by Maths experts to help you in doubts & scoring excellent marks in Class 14 exams.
Updated on:21/07/2023Topper's Solved these Questions
Similar Questions
What is the ratio of production of Company B in the year 2006 to production of Company B in the year 2008? (a) 2 : 5 (b) 4 : 5 (c) 3 : 4 (d) 3 : 5 (e) 1 : 4
View Solution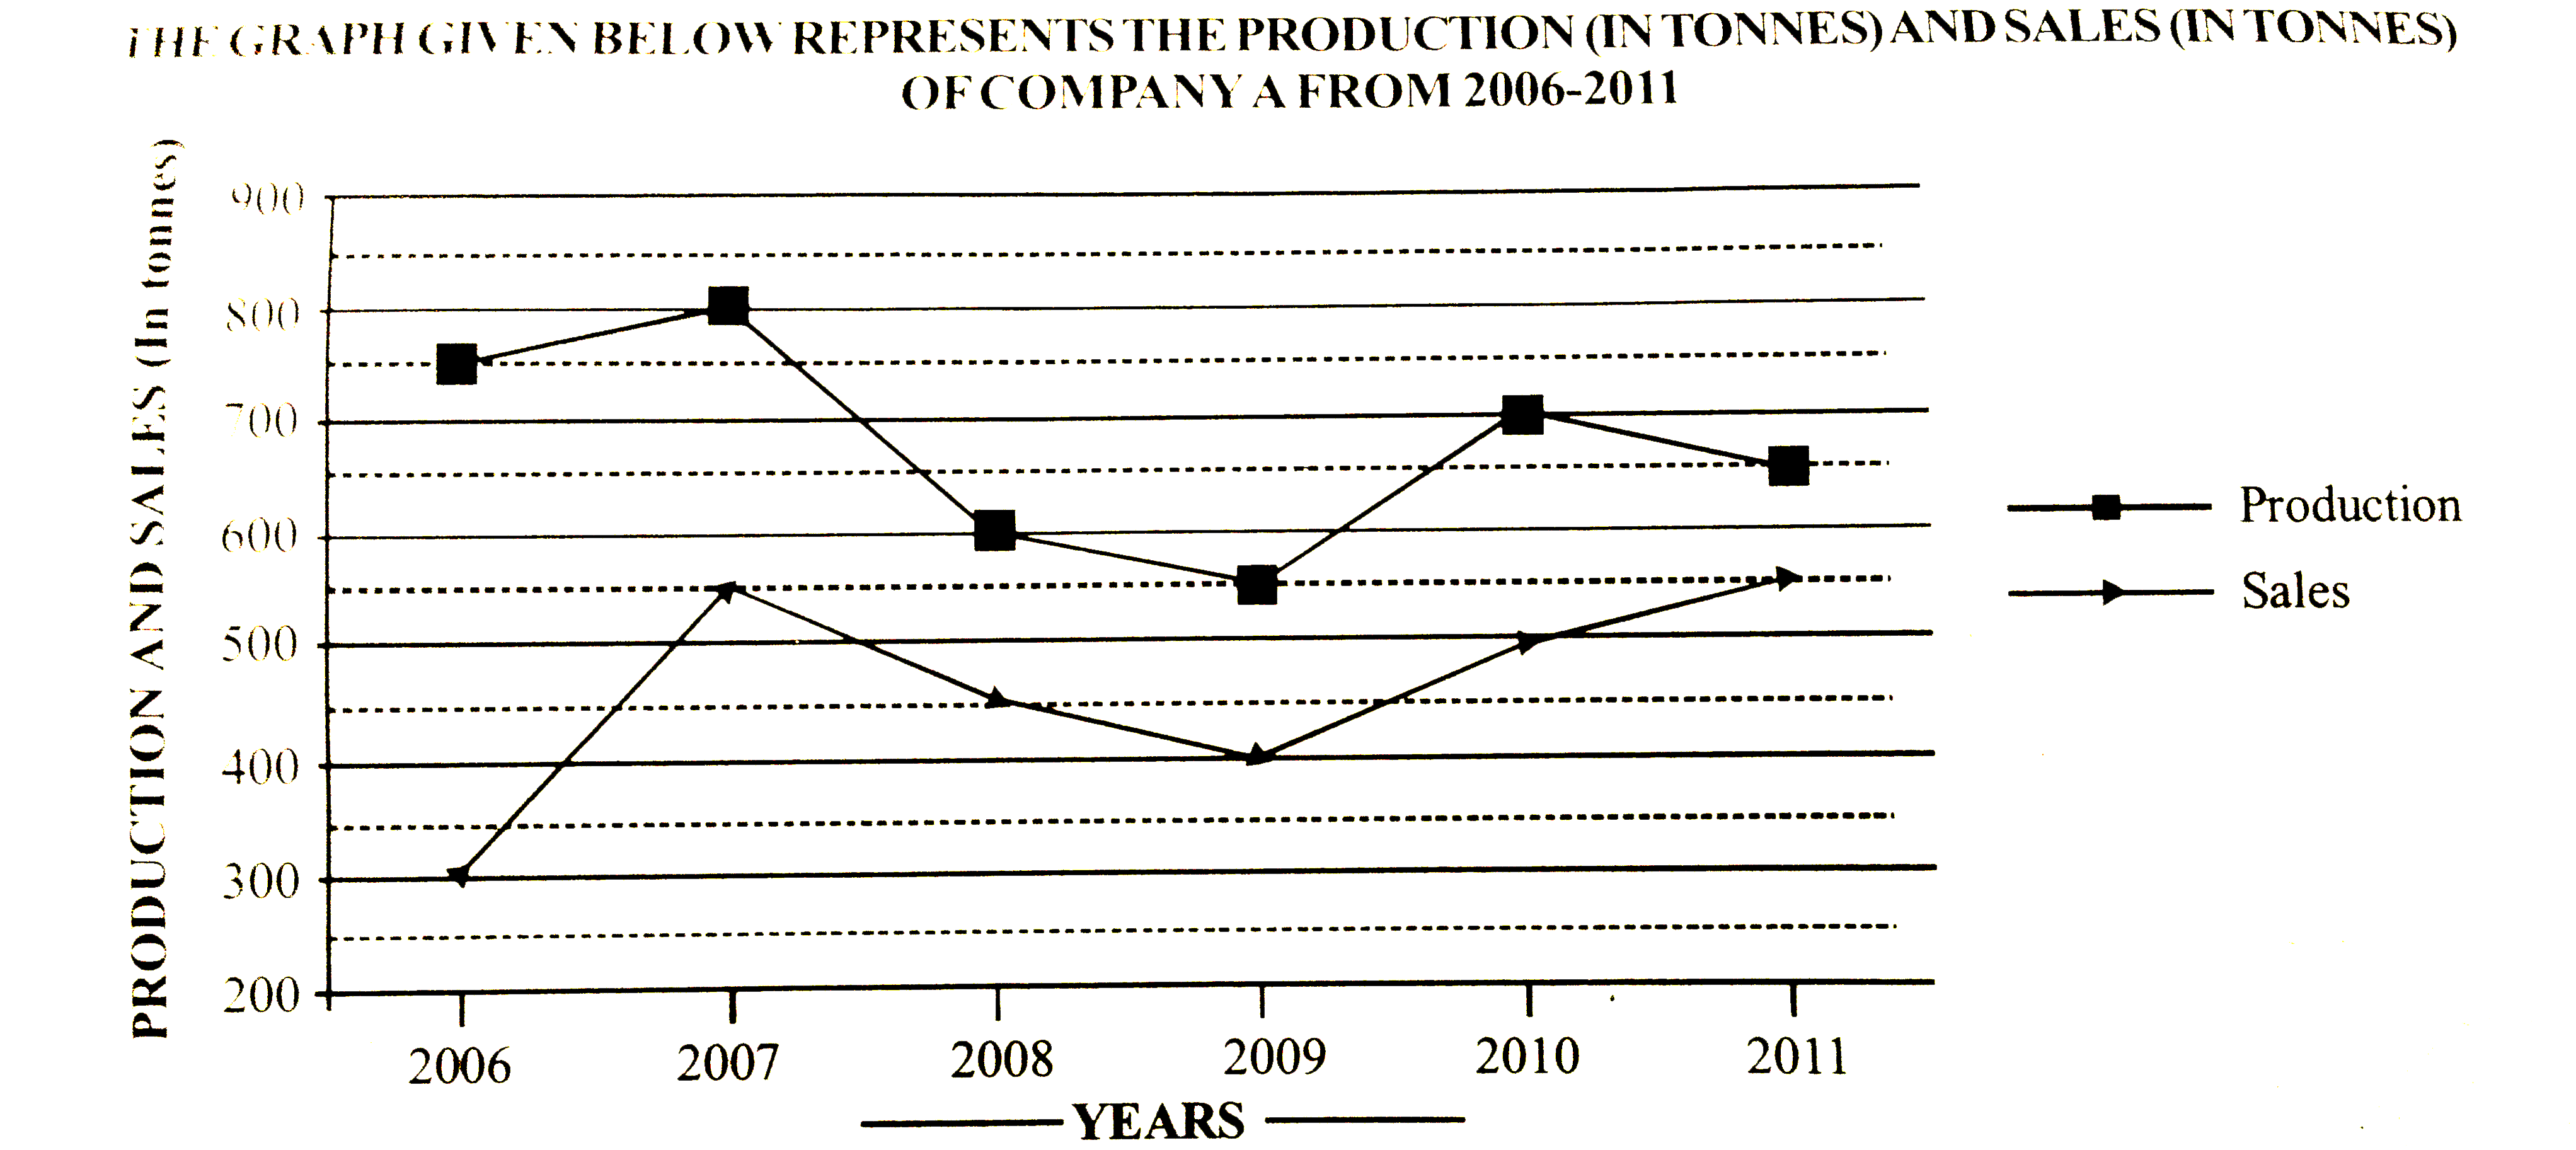
The table given below represents the respective ratio of the production (in tonners) of Company A to the production (in tonnes) of Company B, and the respective ratio of the sales (in tonnes )of Company A to the sales (in tonnes) of Company. B.
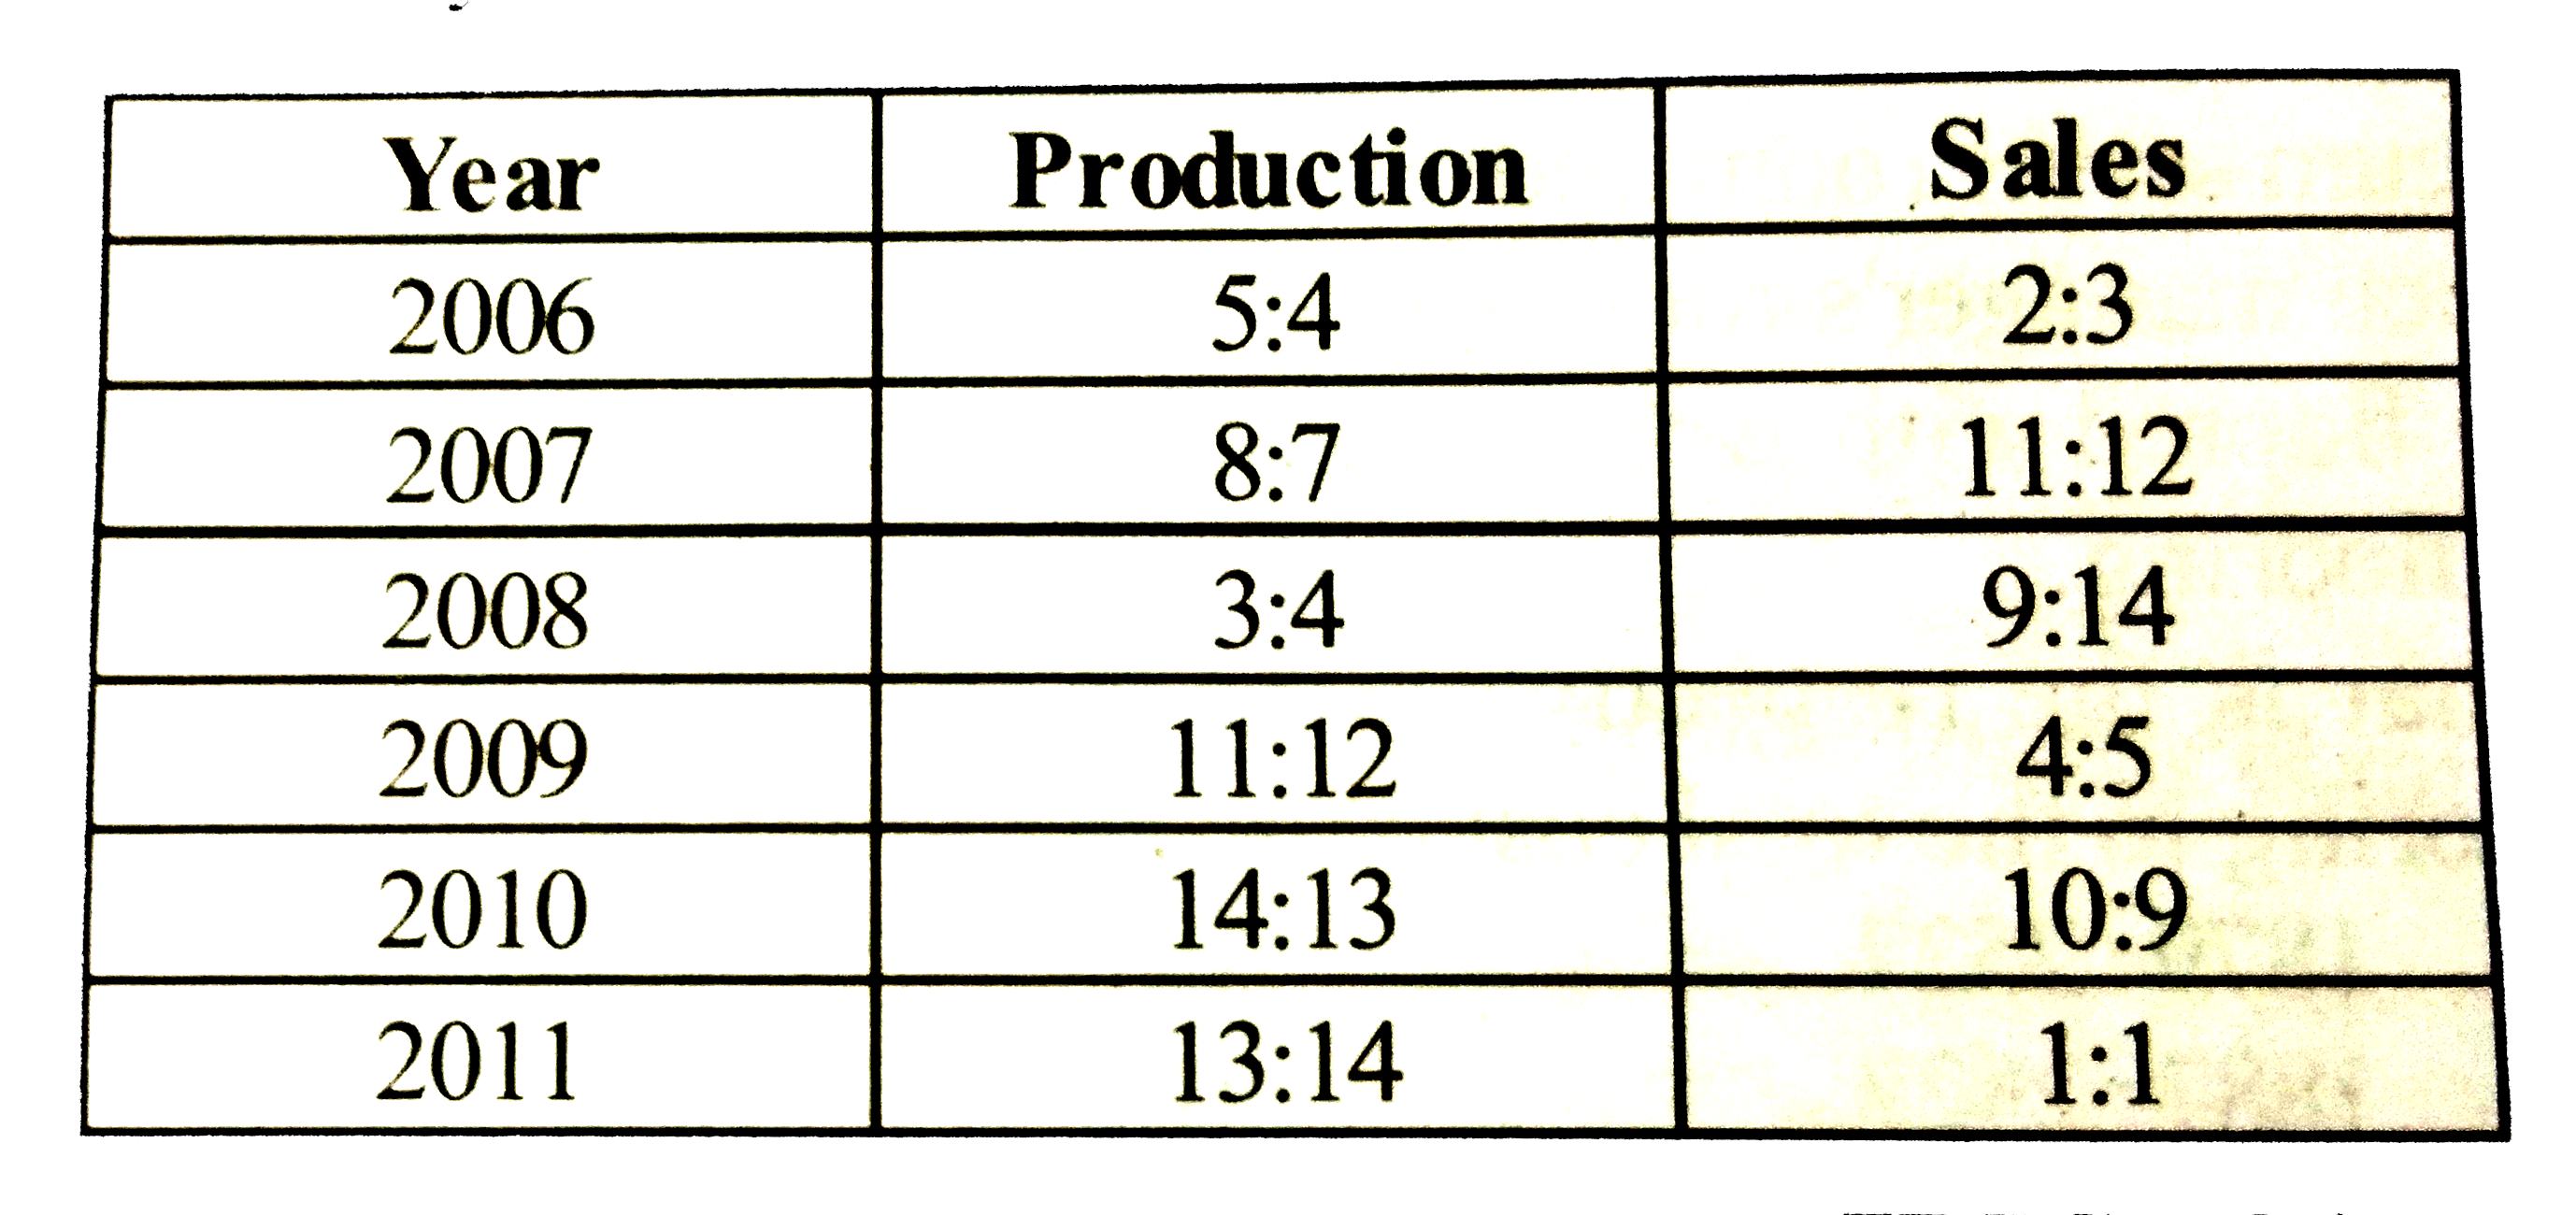
What is the average production of Company B (in tonnes from the year 2006 to the year 2011?
View Solution
Knowledge Check
What is the ratio of average demand to average production of companies B and D?
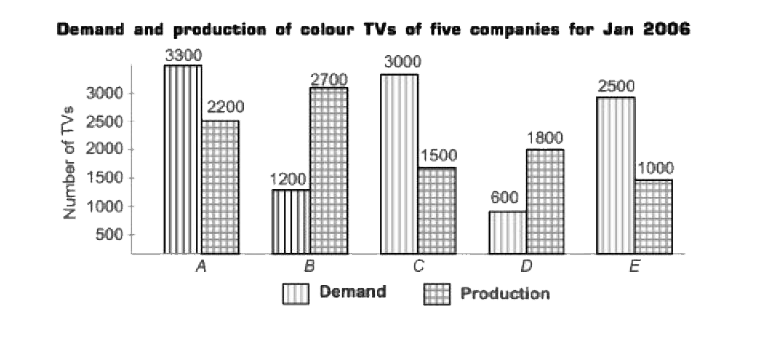 A1:5B2:5C3:5D4:5
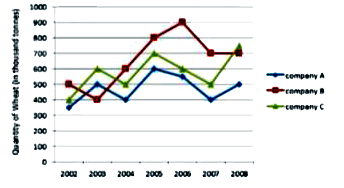
What is the average export of the company B for all the year ?
View Solution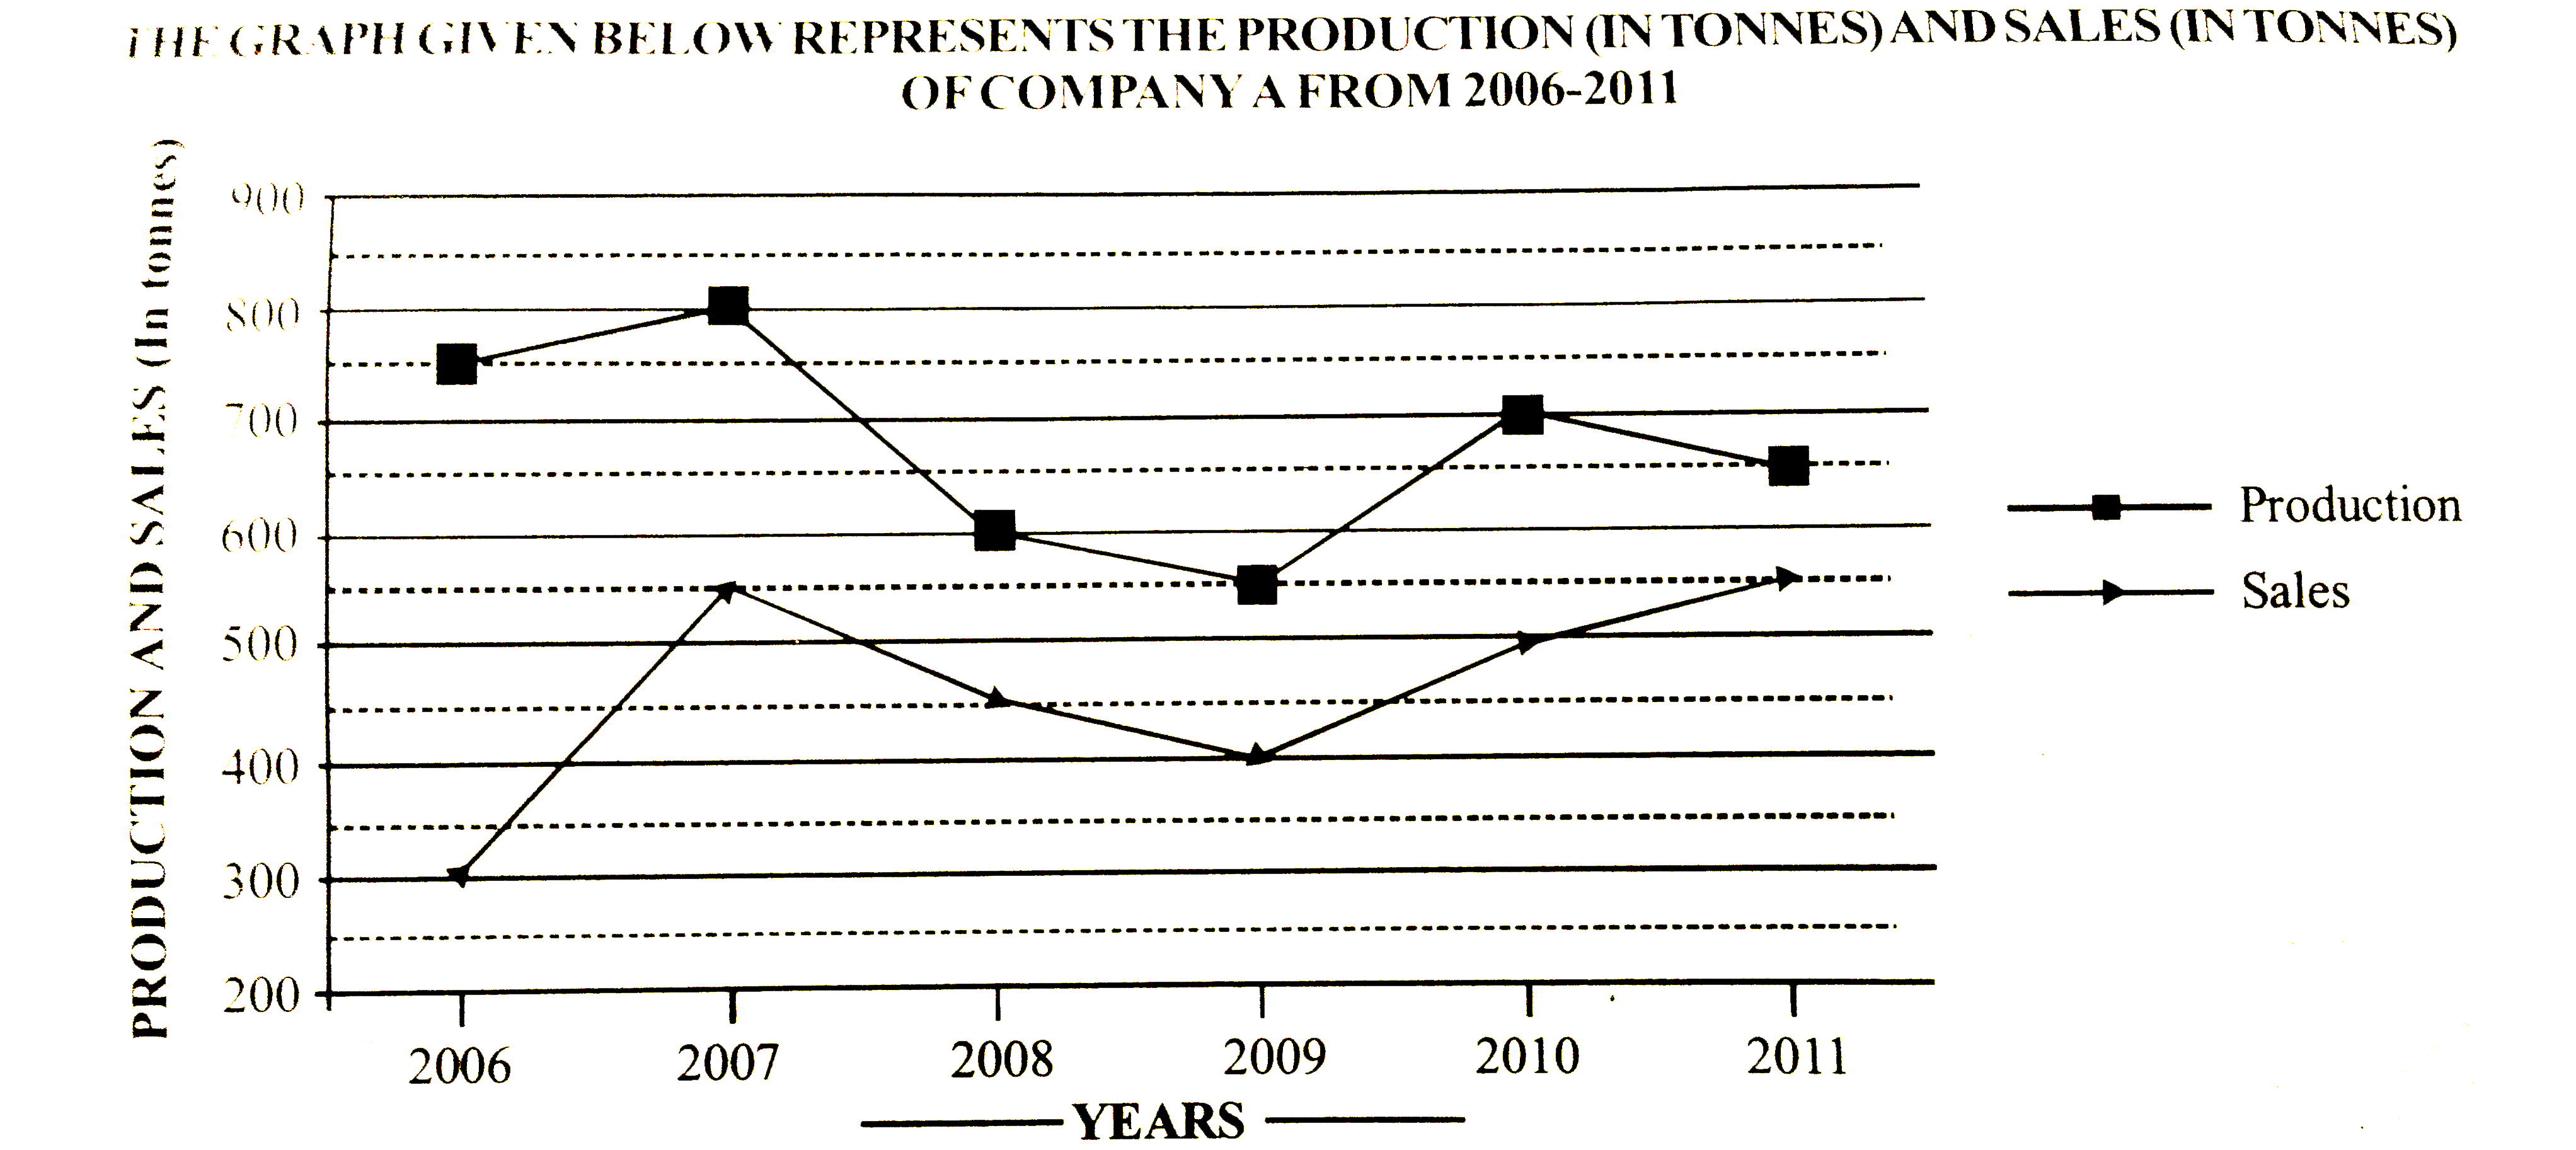
The table given below represents the respective ratio of the production (in tonners) of Company A to the production (in tonnes) of Company B, and the respective ratio of the sales (in tonnes )of Company A to the sales (in tonnes) of Company. B.
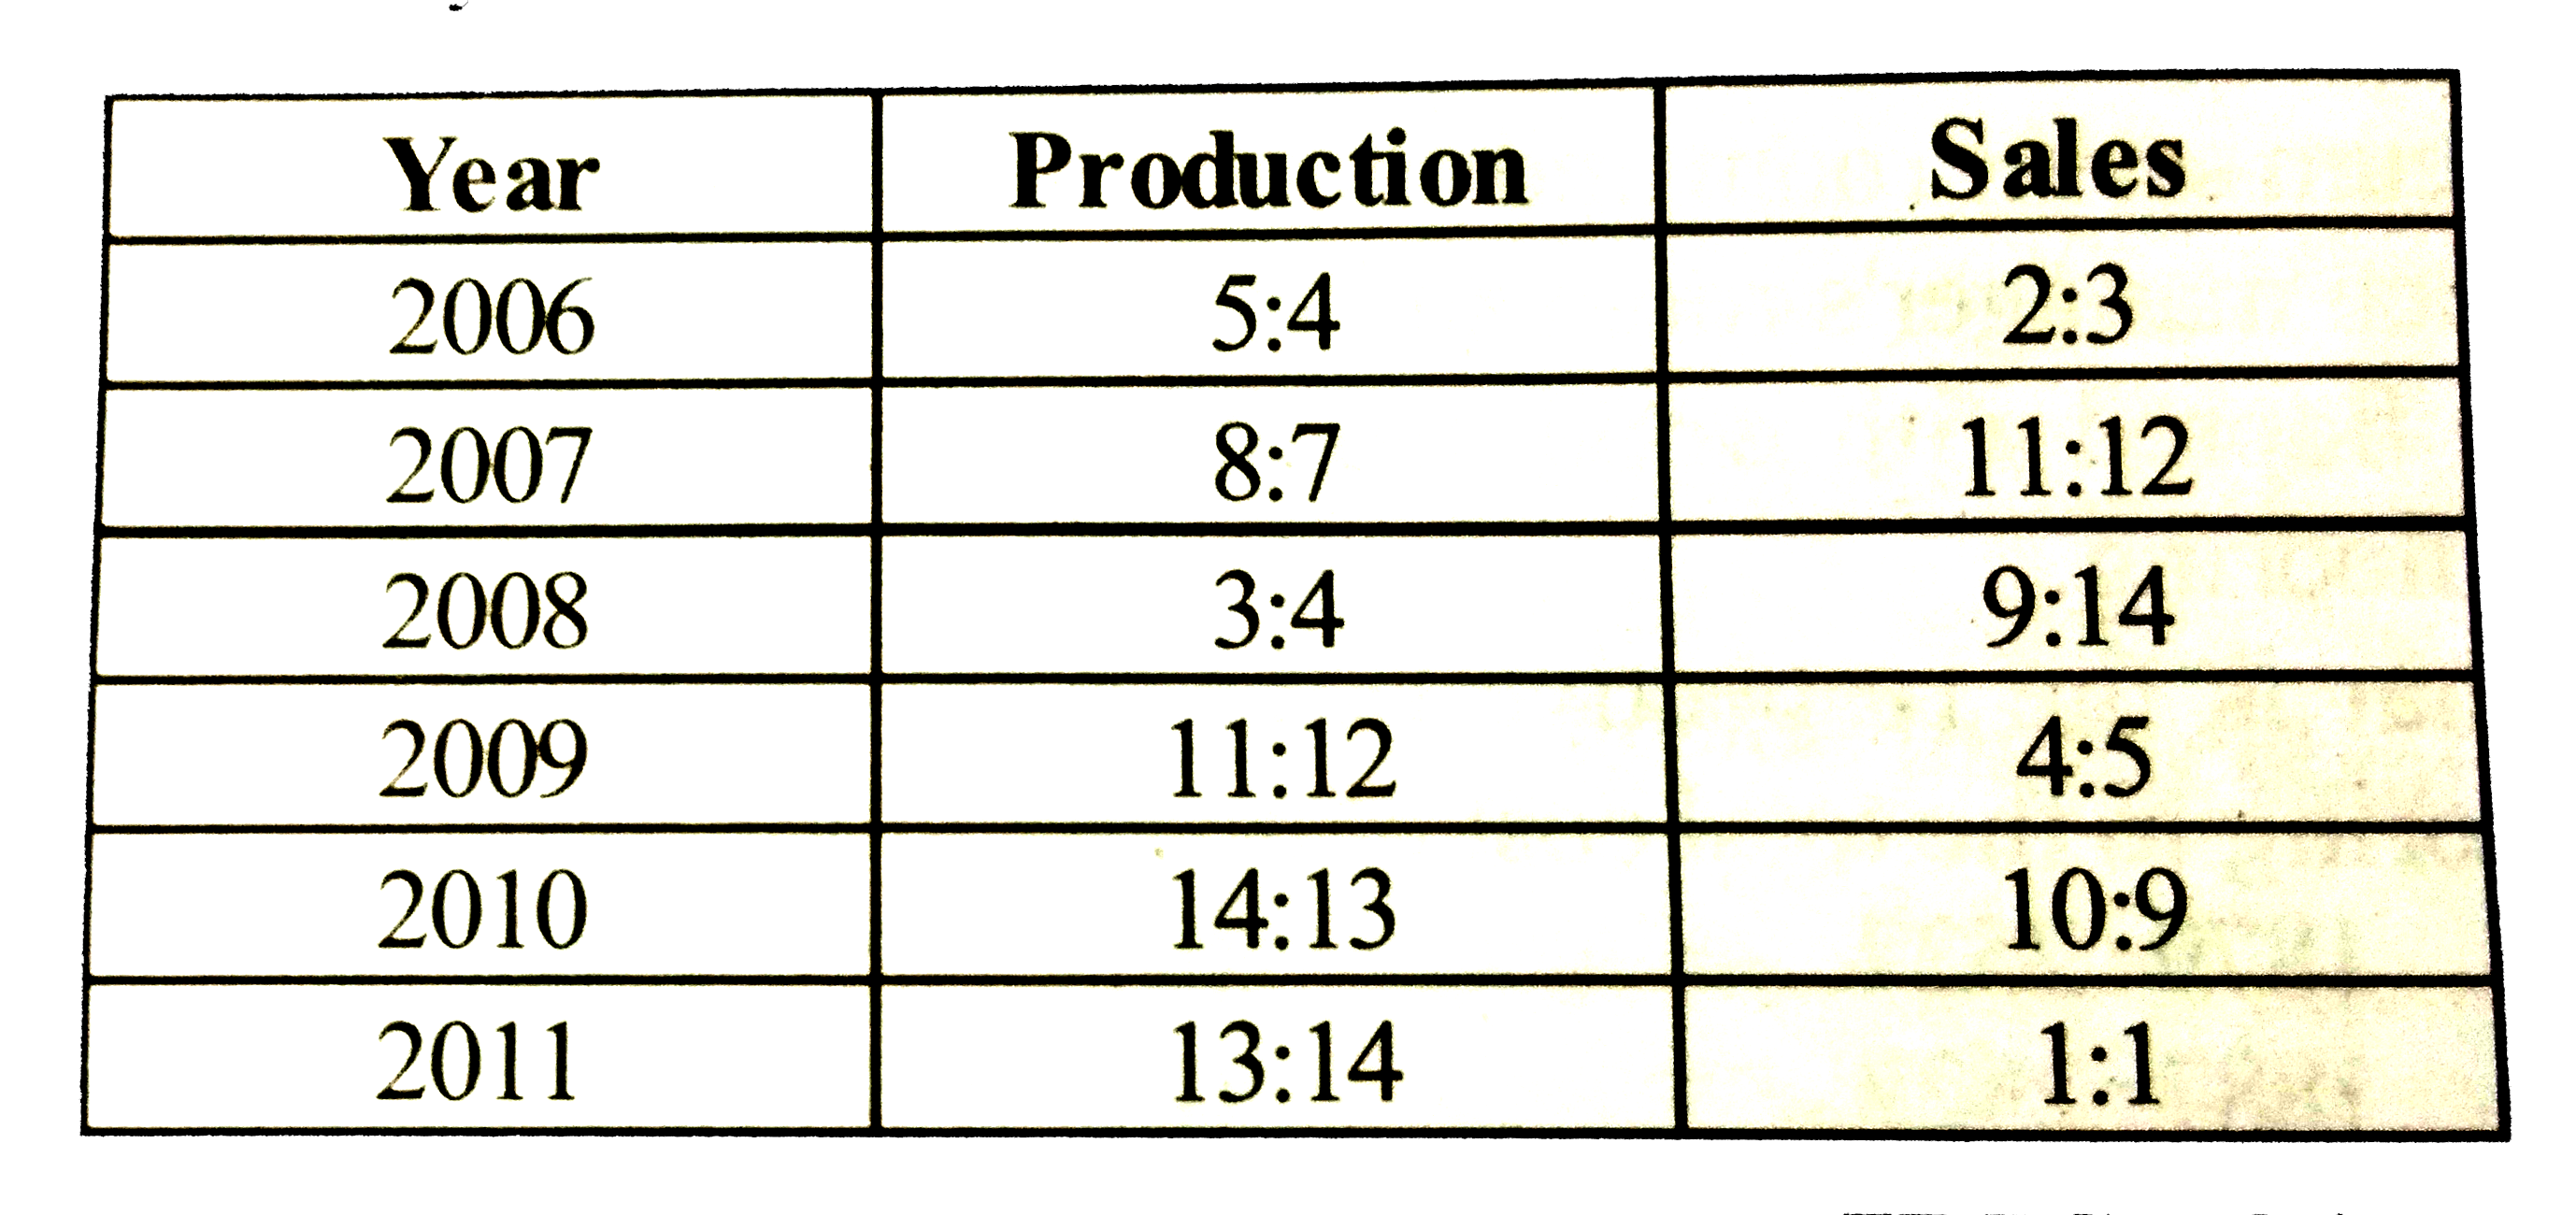
What is the respective ratio of production of Company B (in tonnes) in the year 2006 to production of Company B (in tonnes) in the year 2008?
View Solution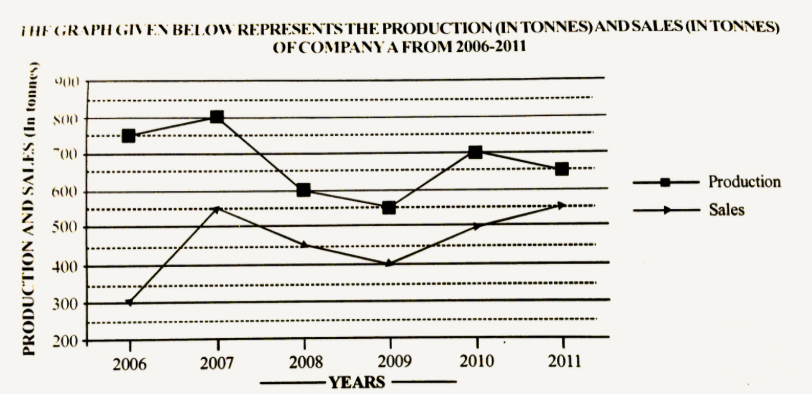
The table given below represents the respective ratio of the production (in tonners) of Company A to the production (in tonnes) of Company B, and the respective ratio of the sales (in tonnes )of Company A to the sales (in tonnes) of Company. B.
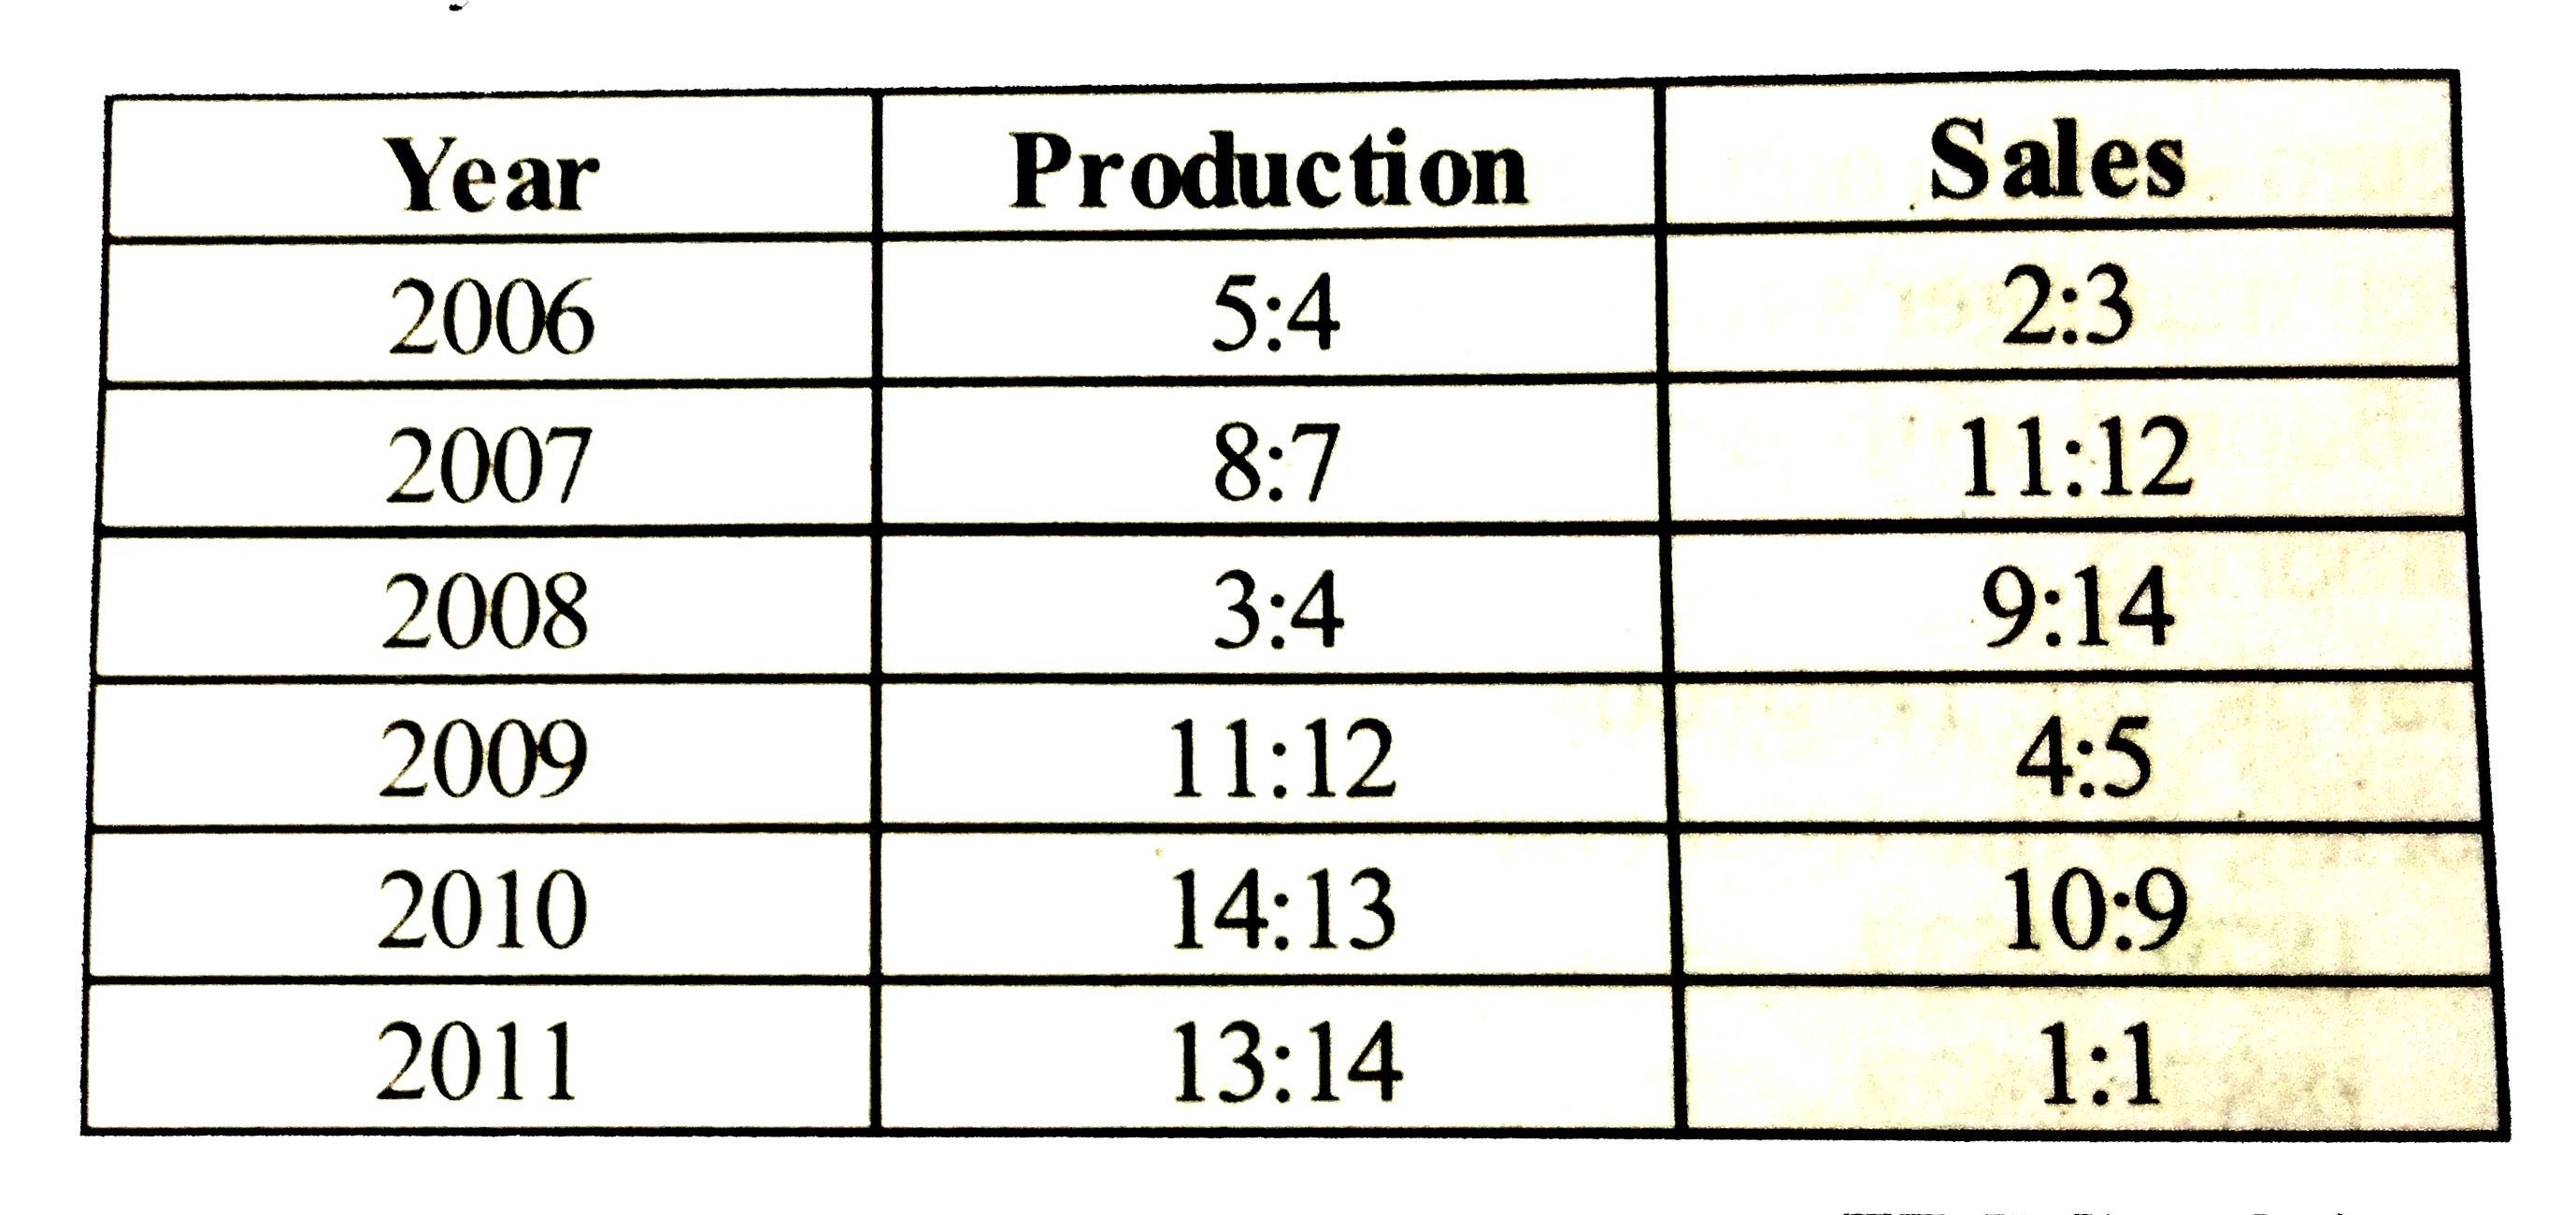
What is teh approximate perentage increases in the production of Company A(in tonnes) from the year 2009 to the production of Company A(in tonnes) in the year 2010?
View SolutionDirections (Questions 6-10): Study the following graph and answer the questions that follow: Production (in tonnes) and Sales (in tonnes) of Company A from 2006 to 2011 (FIGURE) The table given below represents the ratio of the production (in tonnes) of Company A to the production (in tonnes) of Company B and ratio of sales of Company A and Company B Year Production (A:B) Sales (A:B) 2006 5 : 4 2 : 3 2007 8 : 7 11 : 12 2008 3 : 4 9 : 14 2009 11 : 12 4 : 5 2010 14 : 13 10 : 9 2011 13 : 14 1 : 1 What is the approximate percentage increase in the production of Company A from 2009 to 2010? (a) 18% (b) 38% (c) 23% (d) 27% (e) 32%
View SolutionIn which year was the percentage of production of Company Z to the production of Company Y , the maximum? (a) 2006 (b) 2007 (c) 2008 (d) 2009 (e) 2010
View SolutionDirection :- Study the graph and answer the questions.
Demand and Production of Colour TV Sets of Five companies A,B,C,D and E for October 2006
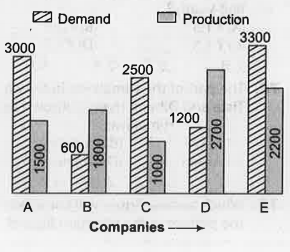
The average production of the companies A,B,C and that of the companies D,E are in the ratio
(A) 85:147 (B) 86:147 (C) 86:149 (D) 87:149
View SolutionFor which of the following years, the percentage rise or fall in production from the previous year is the maximum for Company Y ? (a) 2007 (b) 2008 (c) 2009 (d) 2010 (e) 2007 and 2010
View Solution
