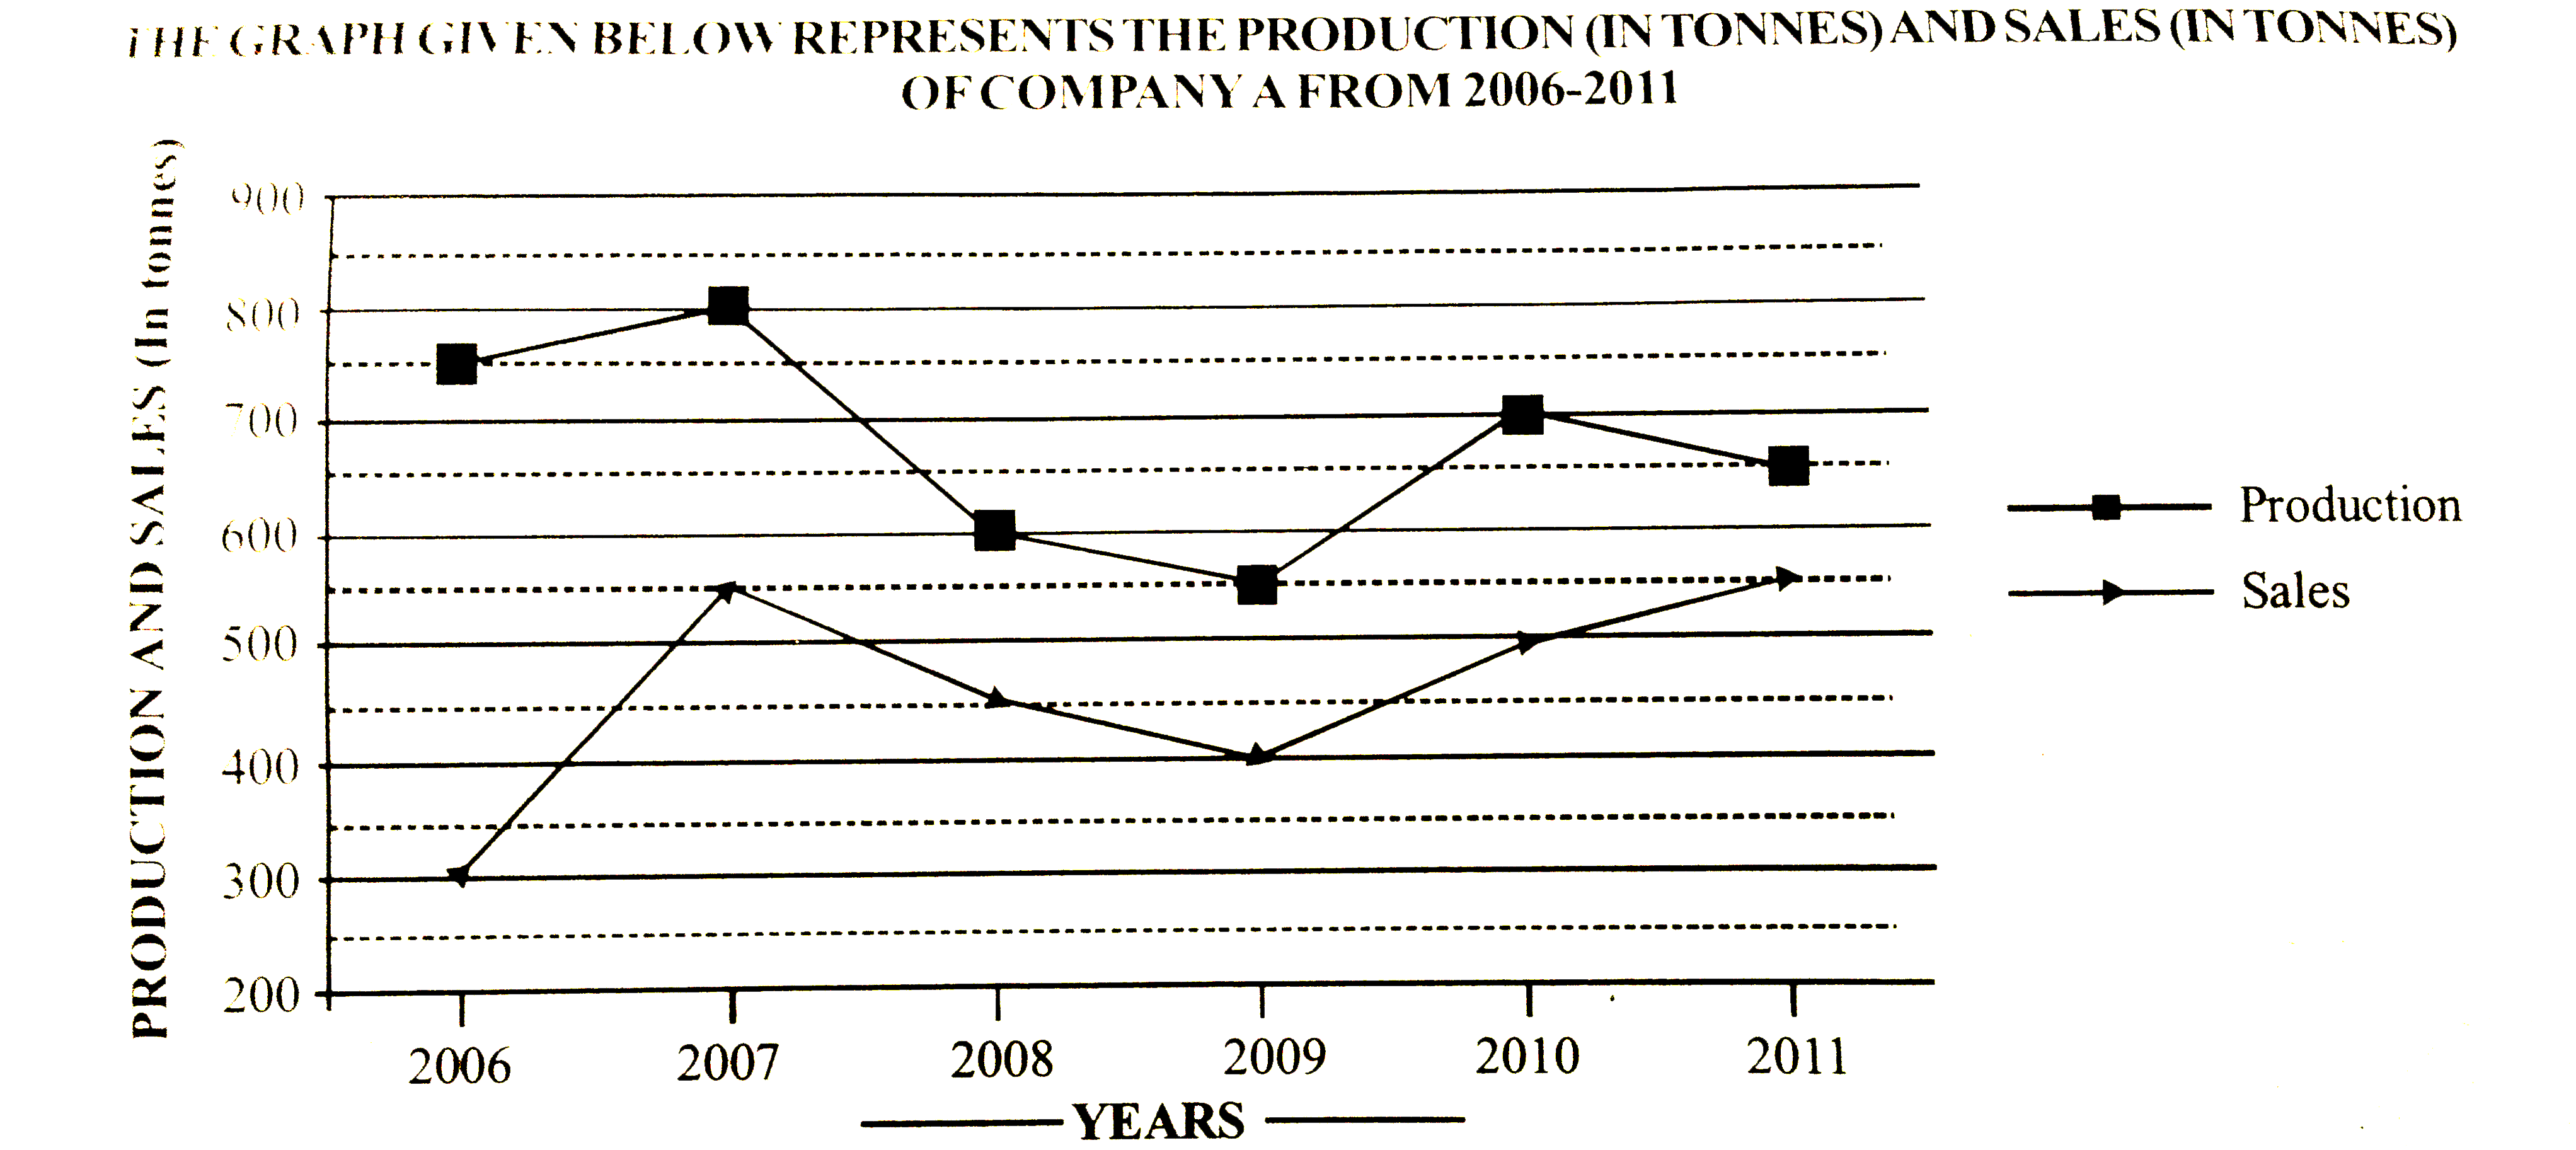
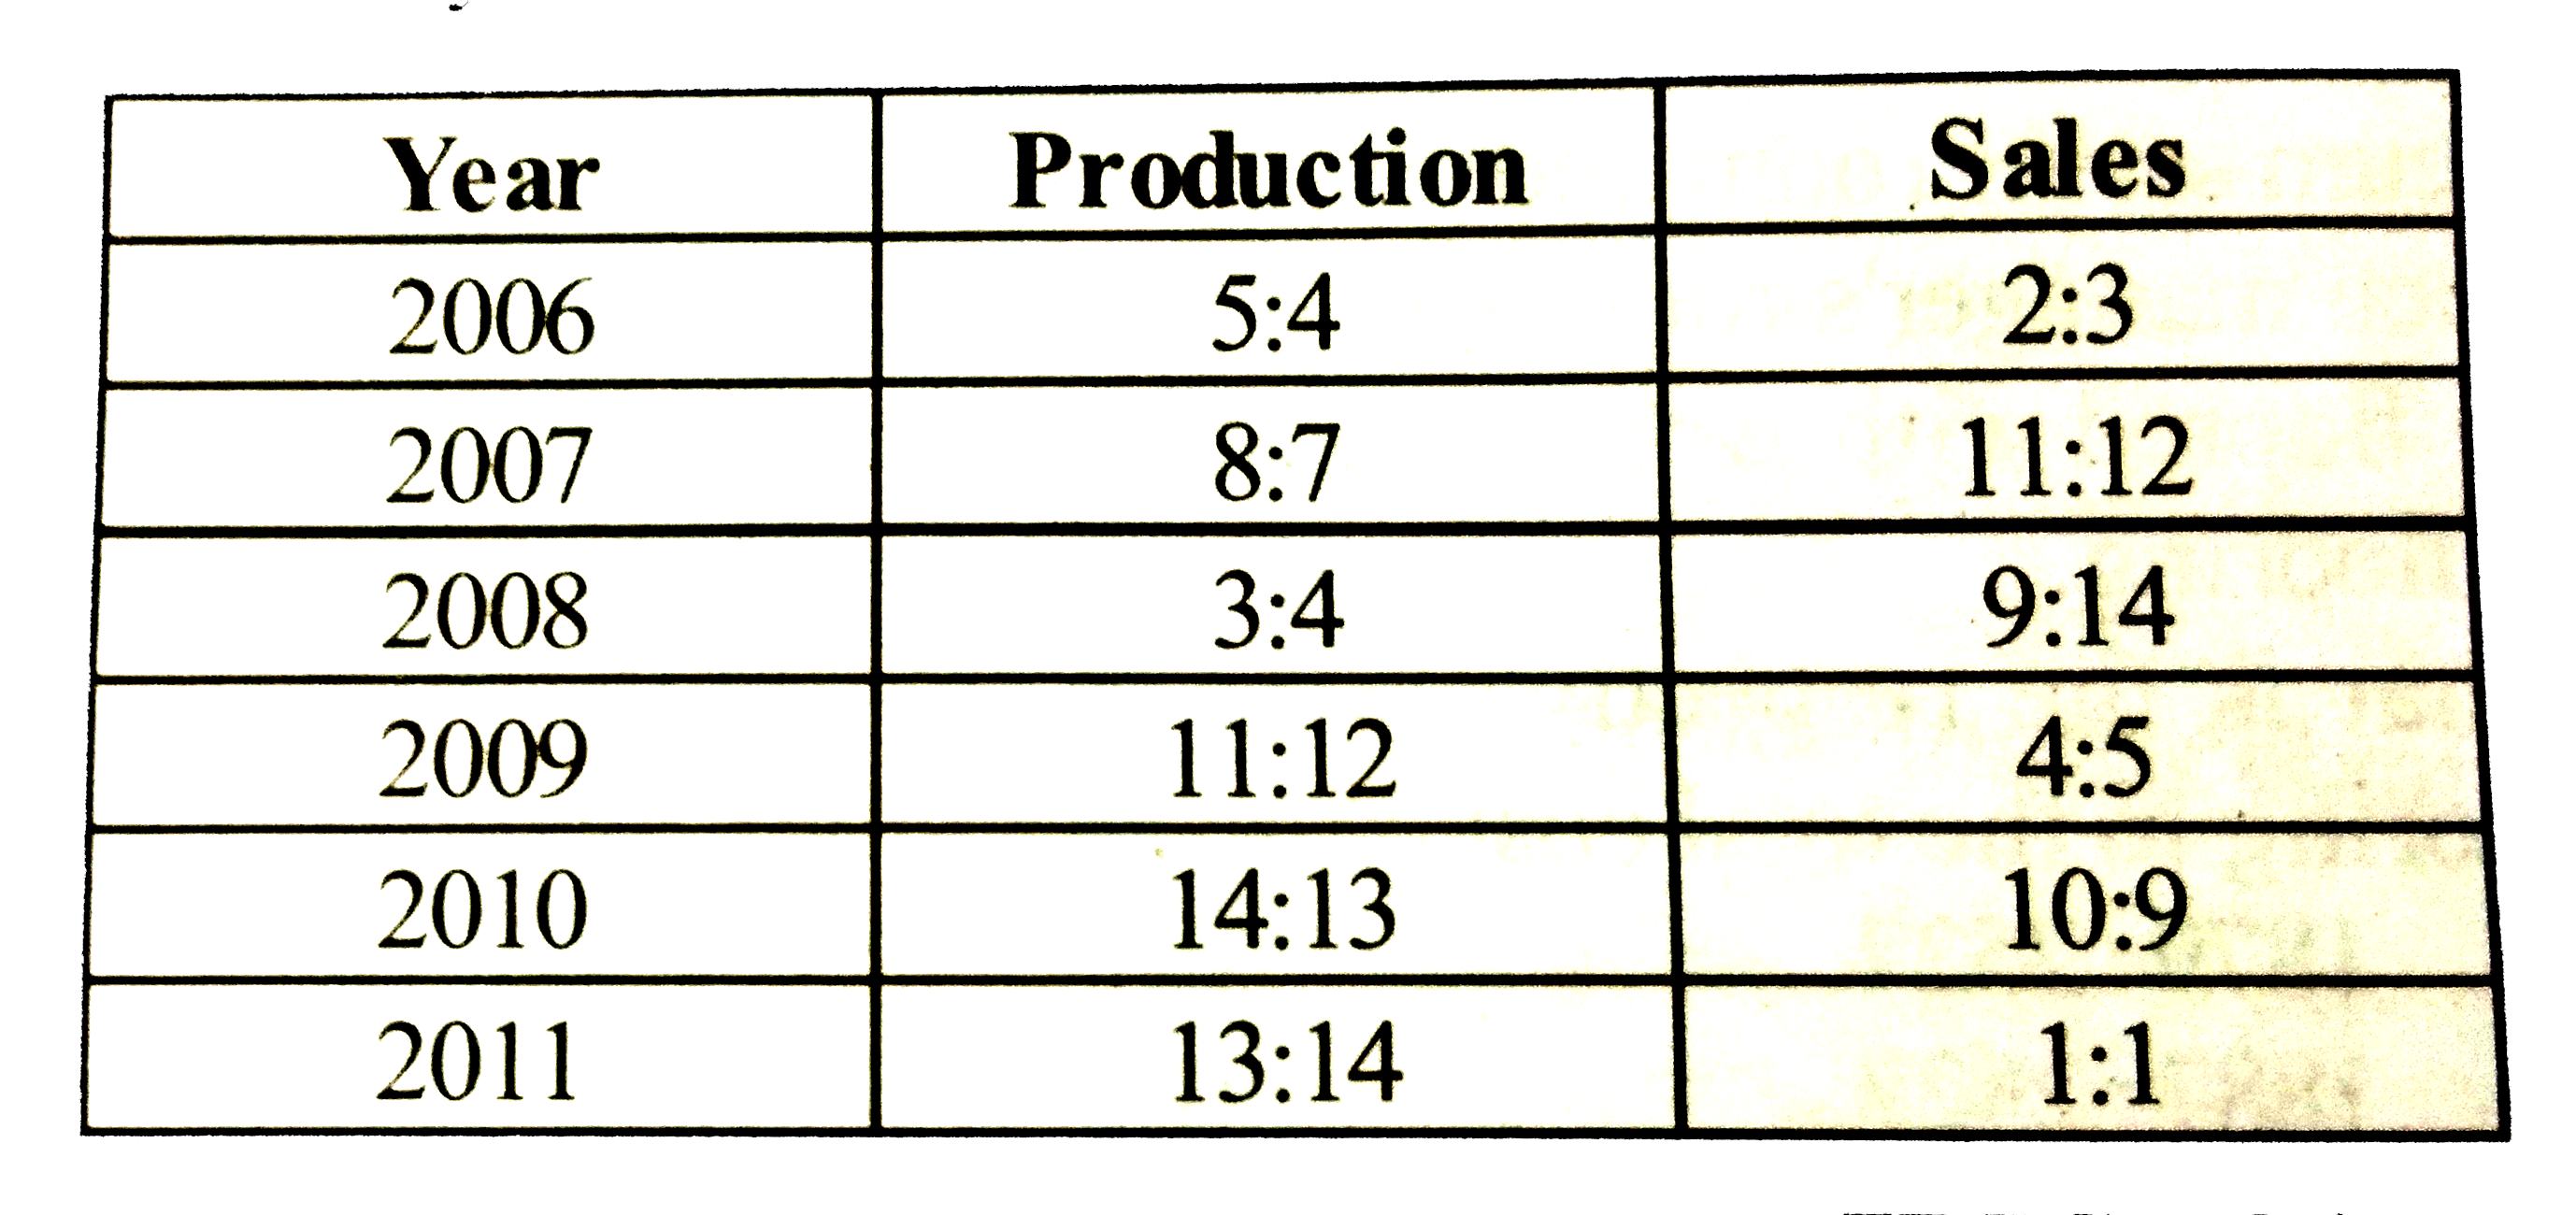
Directions (Questions 6-10): Study the following graph and answer the questions that follow: Production (in tonnes) and Sales (in tonnes) of Company A from 2006 to 2011 (FIGURE) The table given below represents the ratio of the production (in tonnes) of Company A to the production (in tonnes) of Company B and ratio of sales of Company A and Company B Year Production (A:B) Sales (A:B) 2006 5 : 4 2 : 3 2007 8 : 7 11 : 12 2008 3 : 4 9 : 14 2009 11 : 12 4 : 5 2010 14 : 13 10 : 9 2011 13 : 14 1 : 1 What is the approximate percentage increase in the production of Company A from 2009 to 2010? (a) 18% (b) 38% (c) 23% (d) 27% (e) 32%
Step by step video & image solution for Directions (Questions 6-10): Study the following graph and answer the questions that follow: Production (in tonnes) and Sales (in tonnes) of Company A from 2006 to 2011 (FIGURE) The table given below represents the ratio of the production (in tonnes) of Company A to the production (in tonnes) of Company B and ratio of sales of Company A and Company B Year Production (A : B) Sales (A : B) 2006 5 : 4 2 : 3 2007 8 : 7 11 : 12 2008 3 : 4 9 : 14 2009 11 : 12 4 : 5 2010 14 : 13 10 : 9 2011 13 : 14 1 : 1 What is the approximate percentage increase in the production of Company A from 2009 to 2010? (a) 18% (b) 38% (c) 23% (d) 27% (e) 32% by Maths experts to help you in doubts & scoring excellent marks in Class 14 exams.
Updated on:21/07/2023Topper's Solved these Questions
Similar Questions
The table given below represents the respective ratio of the production (in tonners) of Company A to the production (in tonnes) of Company B, and the respective ratio of the sales (in tonnes )of Company A to the sales (in tonnes) of Company. B.
What is the average production of Company B (in tonnes from the year 2006 to the year 2011?
View SolutionRead the following table carefully and answer the question given below-Production (in lakh tonnes)

What is the average production of rice from 2003 to 2006 ? (in lakh tonnes)
View Solution
Knowledge Check
The table given below shows the production (in '000 tonnes) of five companies from 2012 to 2016.
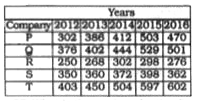
What is the total production (in '000 tonnes) of company R from year 2012 to 2016?A1276B1444C1394D1502Study the table graph carefully to answer the questions that follows
Production of main crops in India (in million tonnes)
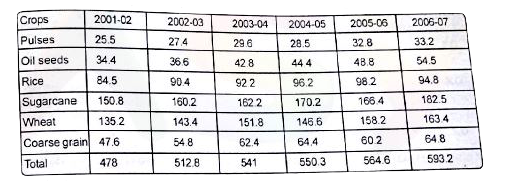
What was the average production of rice in the given years?A98 Million tonnesB95 Million tonnesC92.38 Million tonnesD100 Million tonnesStudy the graph carefully and answer the questions.
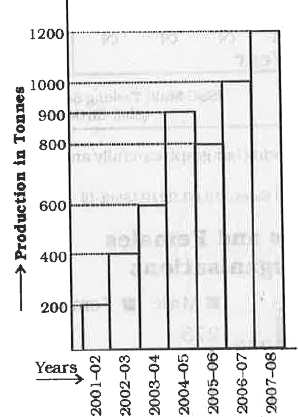
The graph shows production of an item (in tonnes) during certain years
The production from 2003-04 to 2007-08 increased byA125%B50%C75%D100%
Study the following graph carefully and answer the question given below it.
Production and sale of printers of various companies in a month.
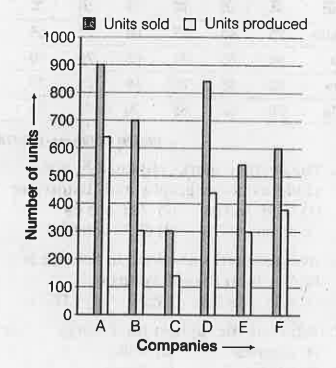
Which company had the highest percentage of sale with respect to its production ?
View Solution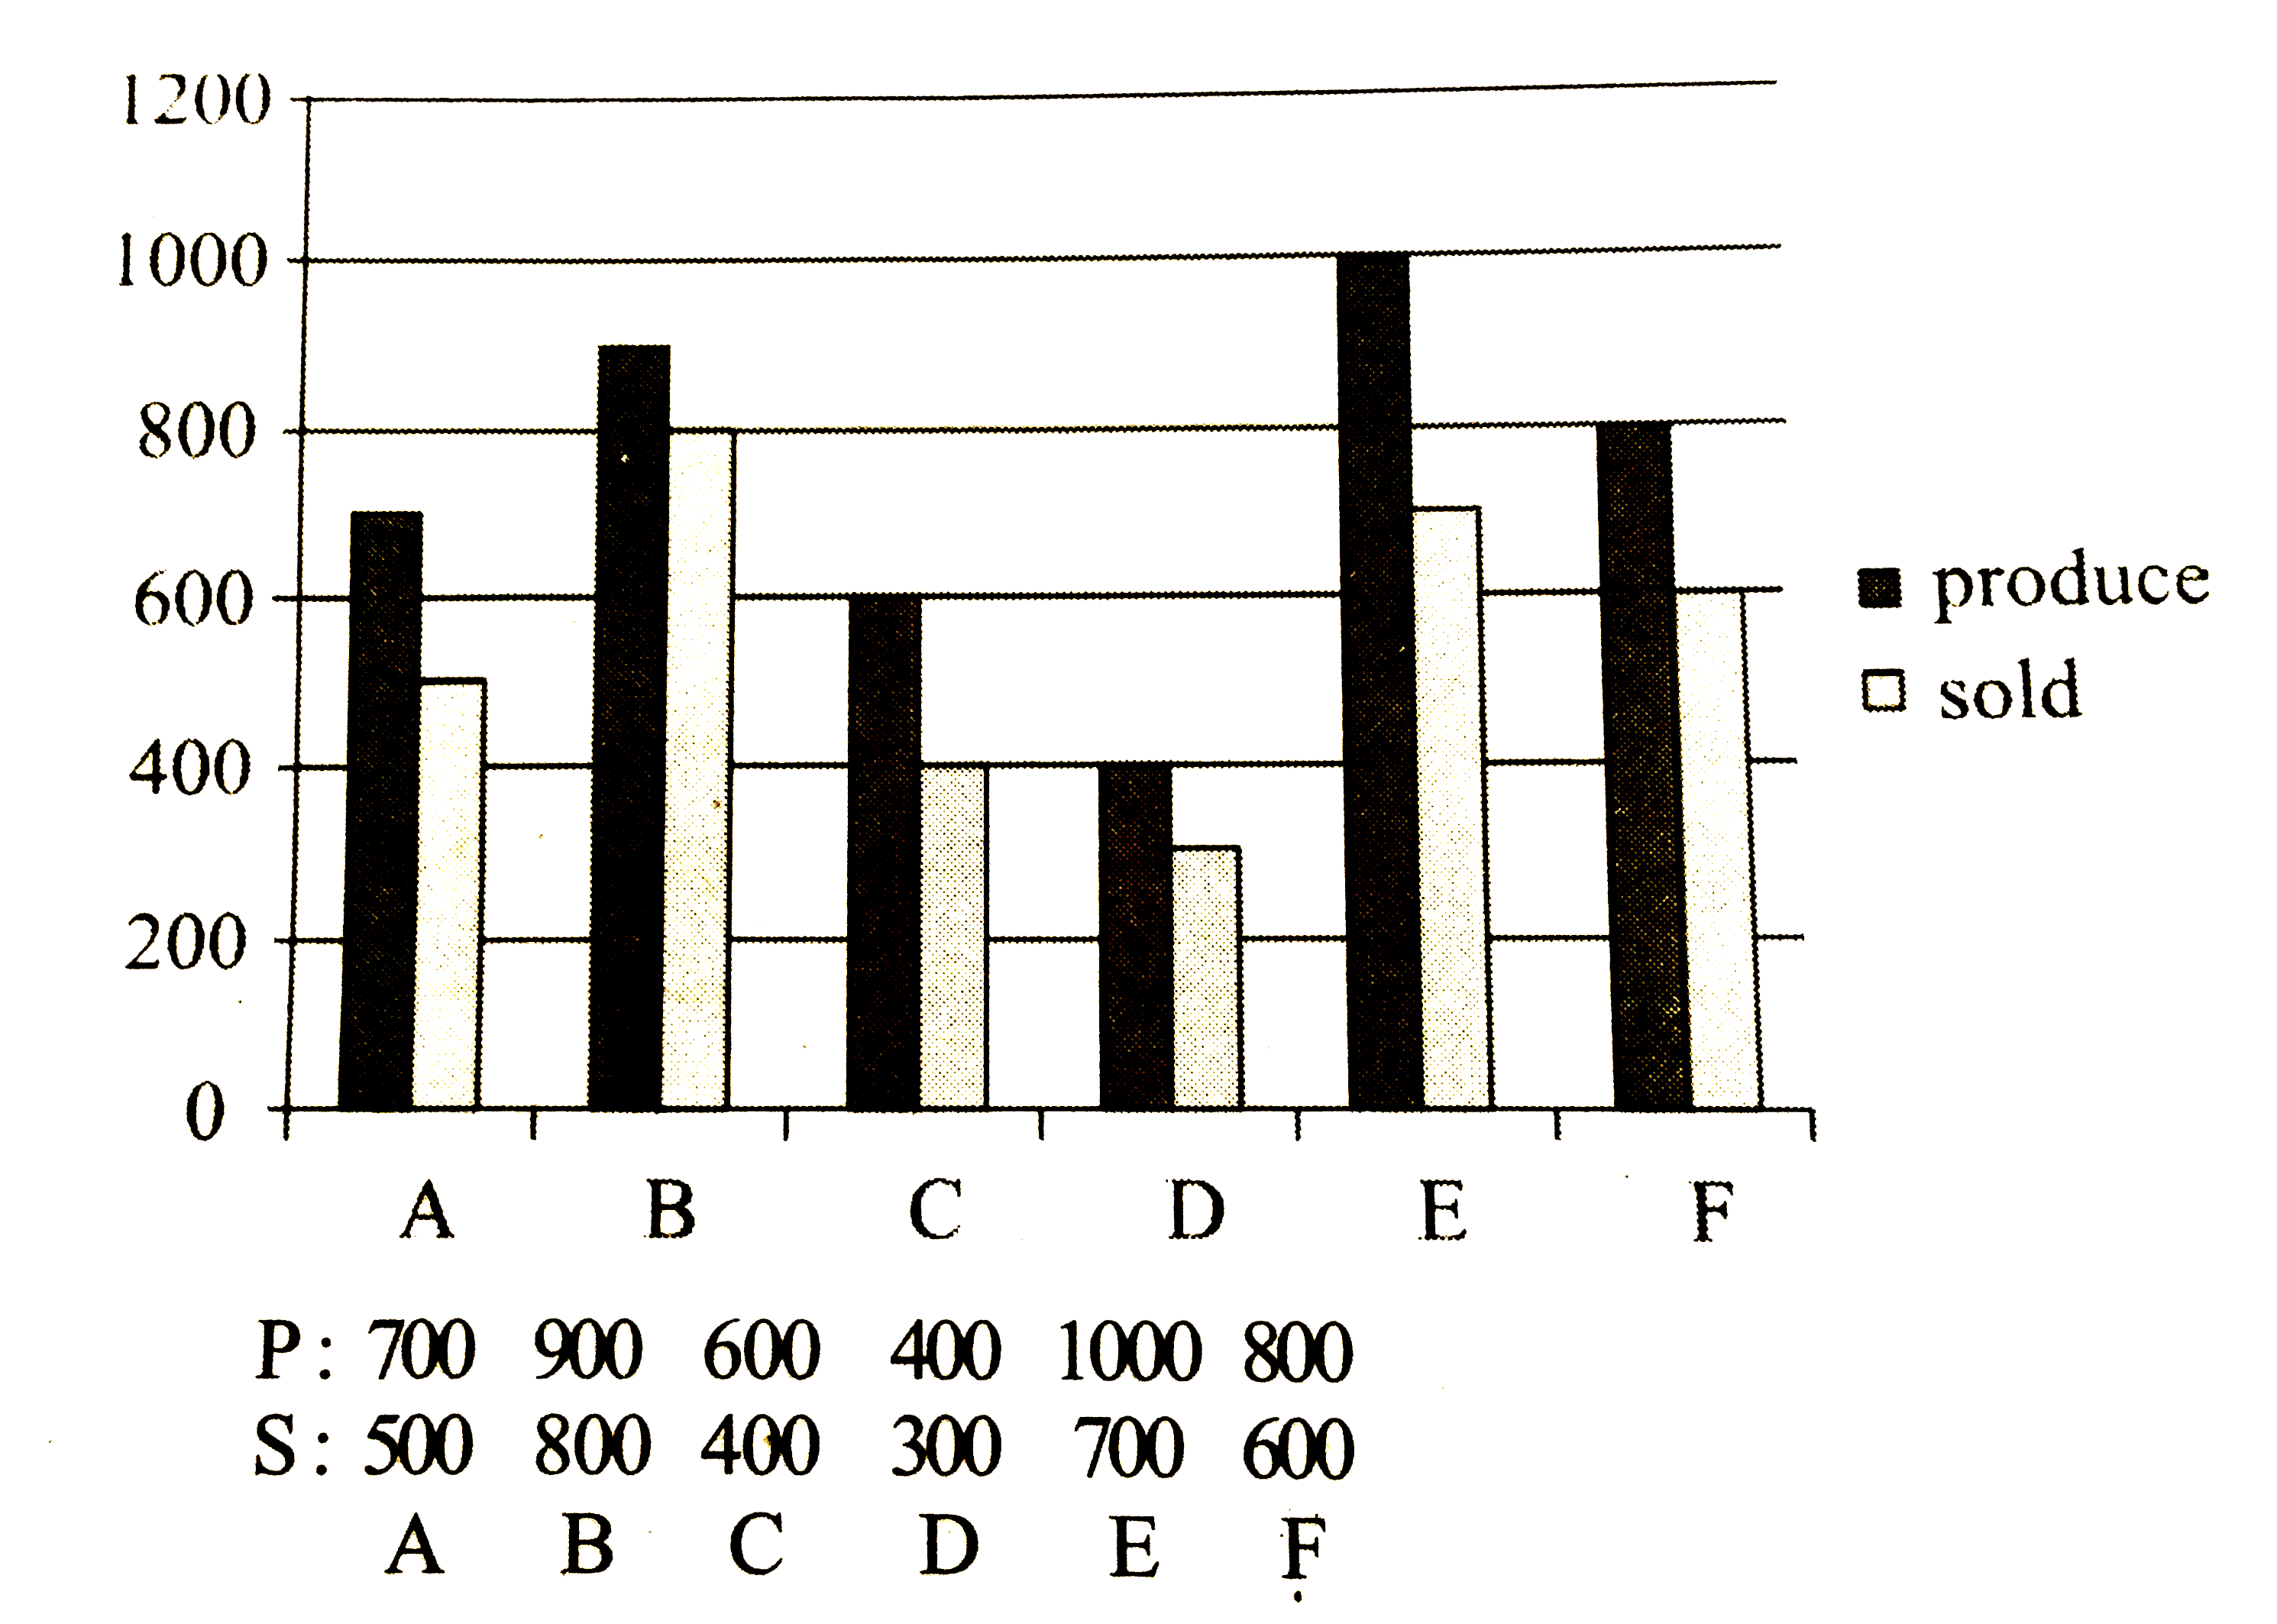
What is the ratio of total production of all the companies to the total sales of all the companies ?
View SolutionStudy the following graph carefully and answer the question given below it.
Production and sale of printers of various companies in a month.
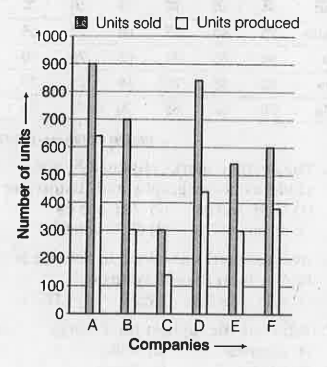
What is the ratio of the total production of companies D and E to the total sale of the same companies?
View SolutionStudy the following graph carefully and answer the question given below it.
Production and sale of printers of various companies in a month.
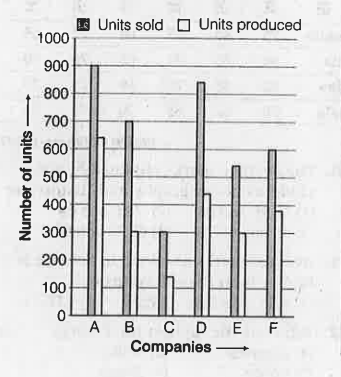
The total produced by the companies A B and C together is
View Solution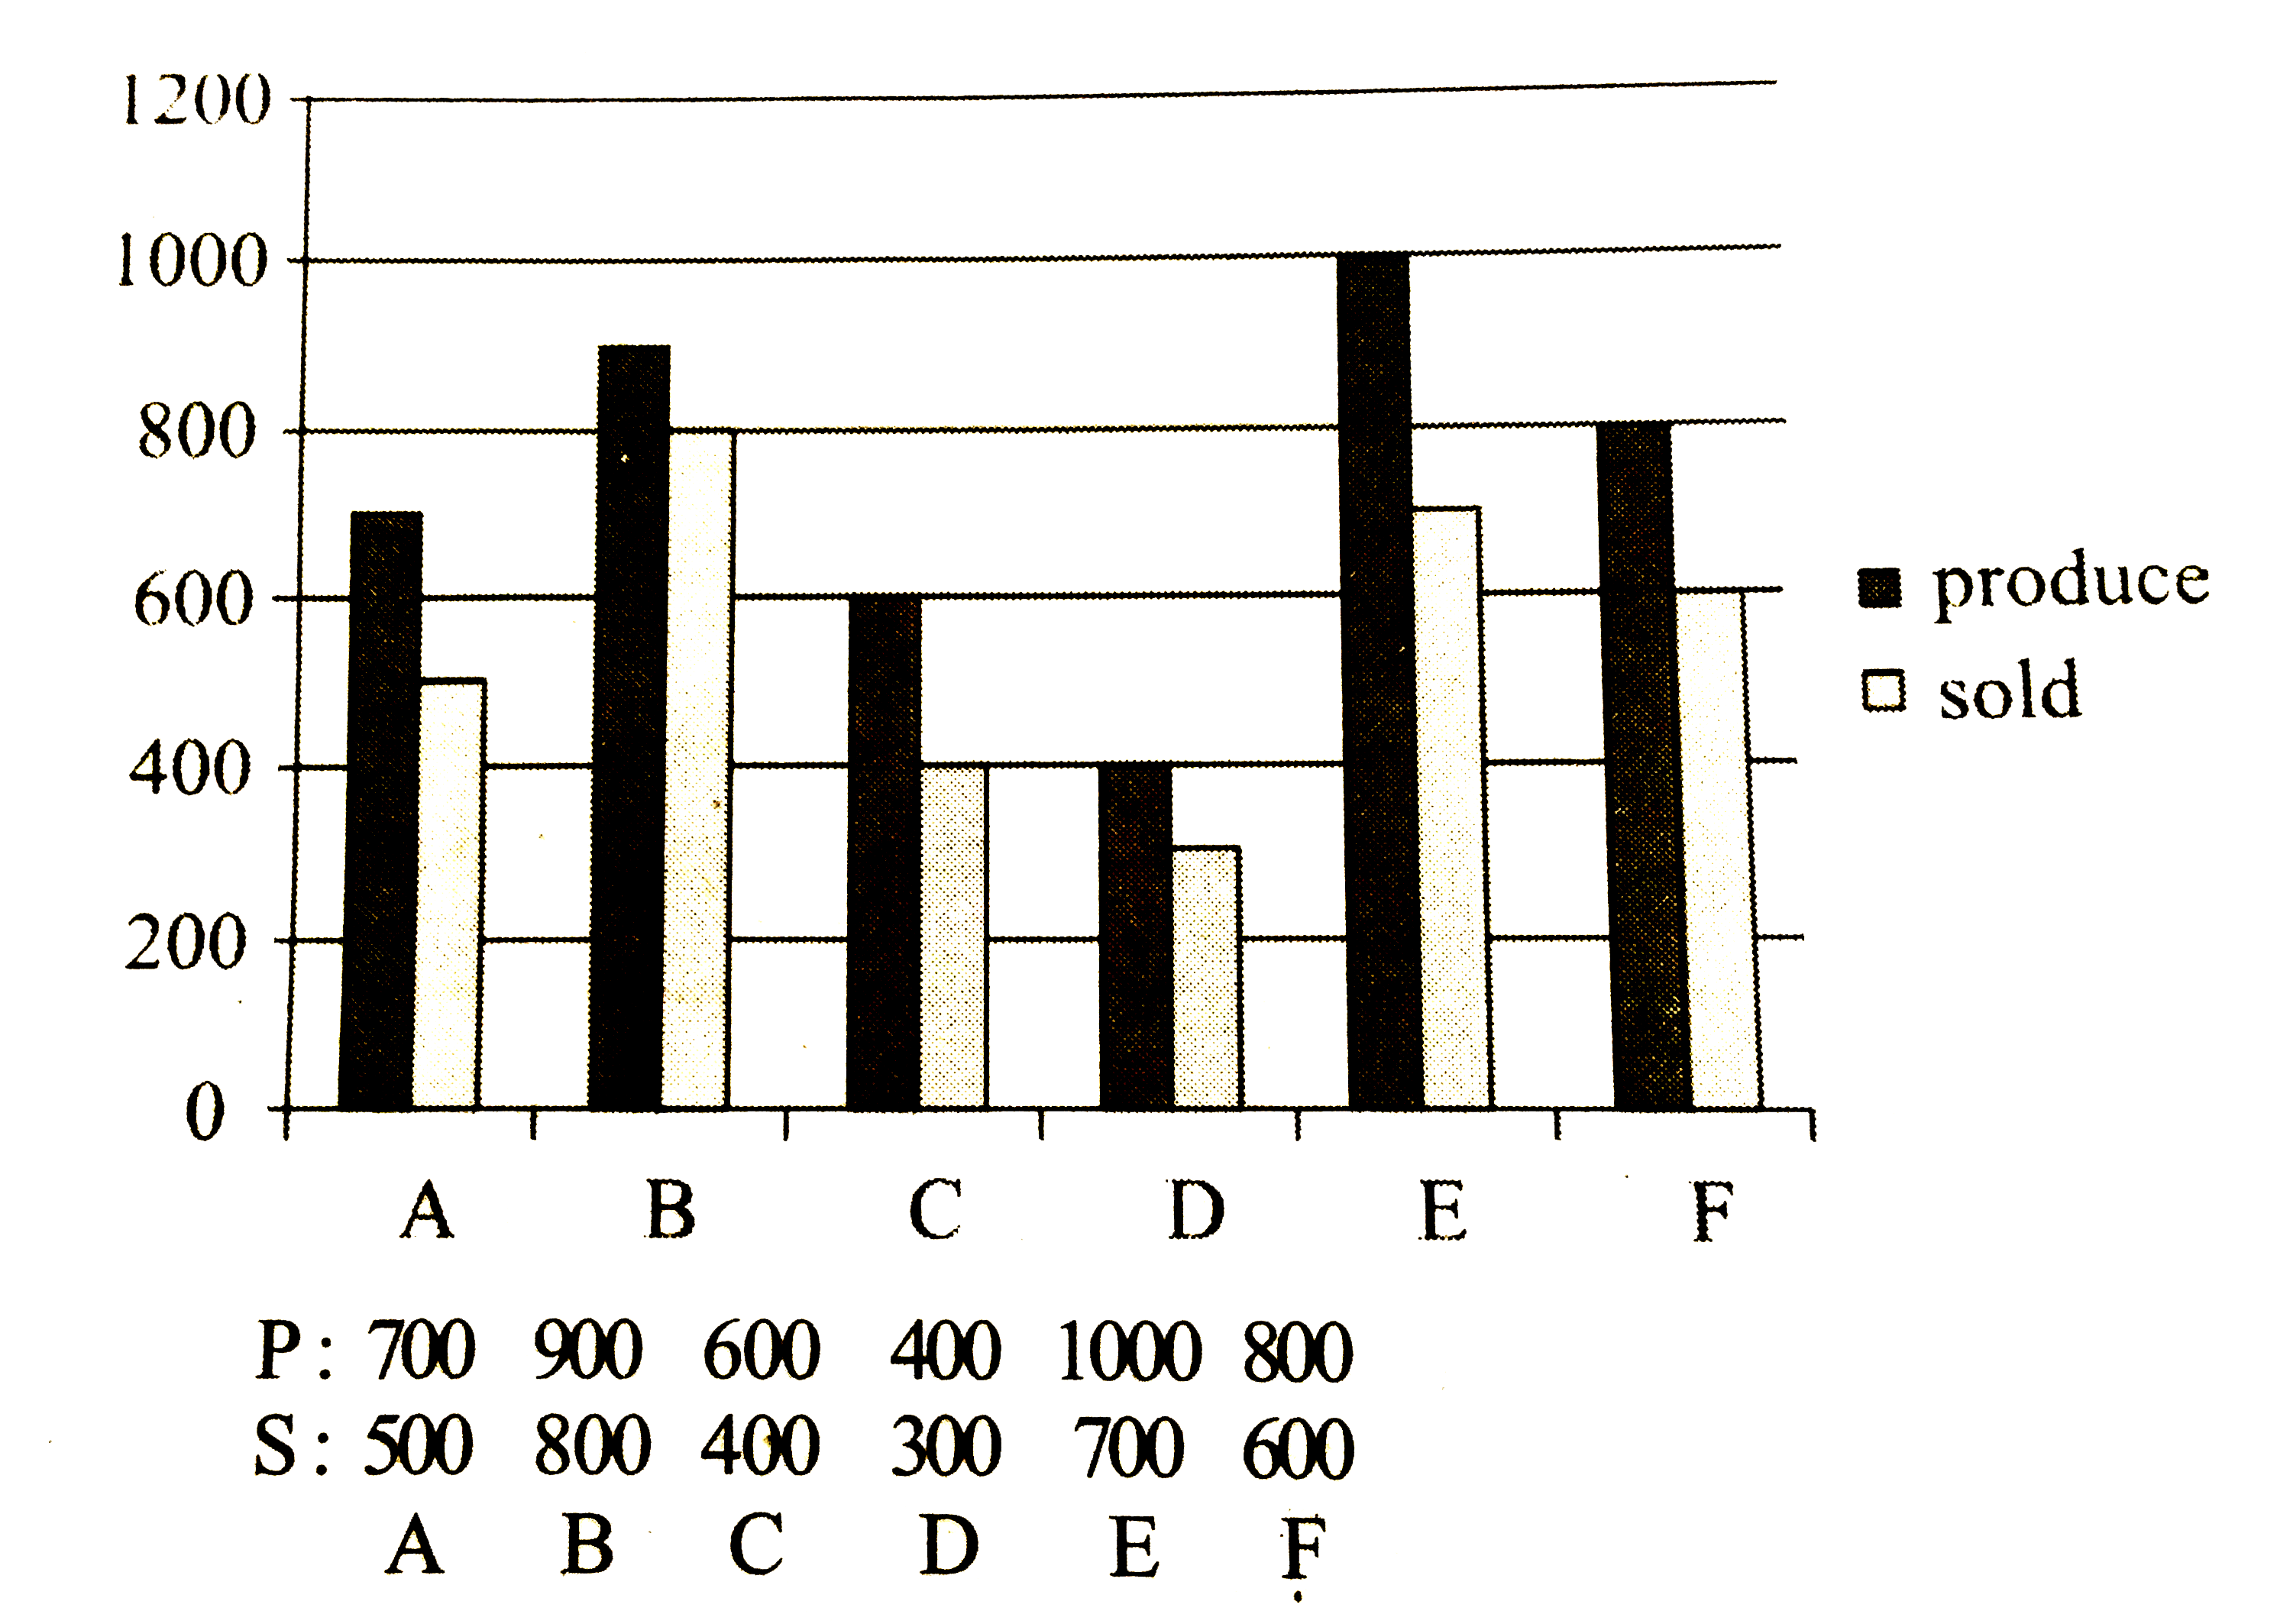
What is the ratio of the total production of the company B and C together to the total sales of the same companies ?
View Solution
