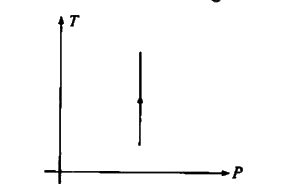
Pressure versus temperature graphs of an ideal gas are as shown in figure. Choose the wrong statement

Density of gas is increasing in graph
Density of gas is decreasing in graph (ii)
Density of gas is constant in graph (iii)
None of these
( c) ρ=PMRT
Density ρ remains constant when P/T or volume remains constant.
In graph (i) Pressure is increasing at constant temperature hence volume is decreasing so density is increasing . Graph (ii) and (iii) volume is increasing hence, density is decreasing. Note that volume would had been constant in case the straight line in graph (iii) had passed through origin.
Topper's Solved these Questions
Similar Questions
Knowledge Check
Pressure versus temperature graph of an ideal gas is as shown in figure. Density of the gas at point A is ρ0. Density at point B will be :-
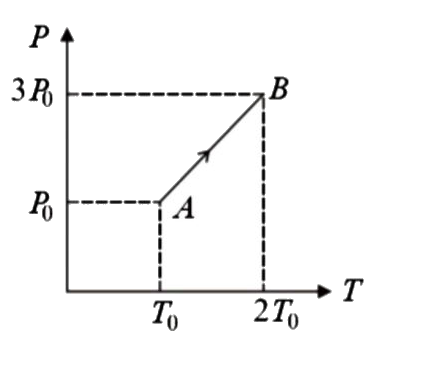 A34ρ0B32ρ0C43ρ0D2ρ0
Pressure versus temperature graph of an ideal gas is shown in figure. Density of the gas at point A is P0. Density at B will be
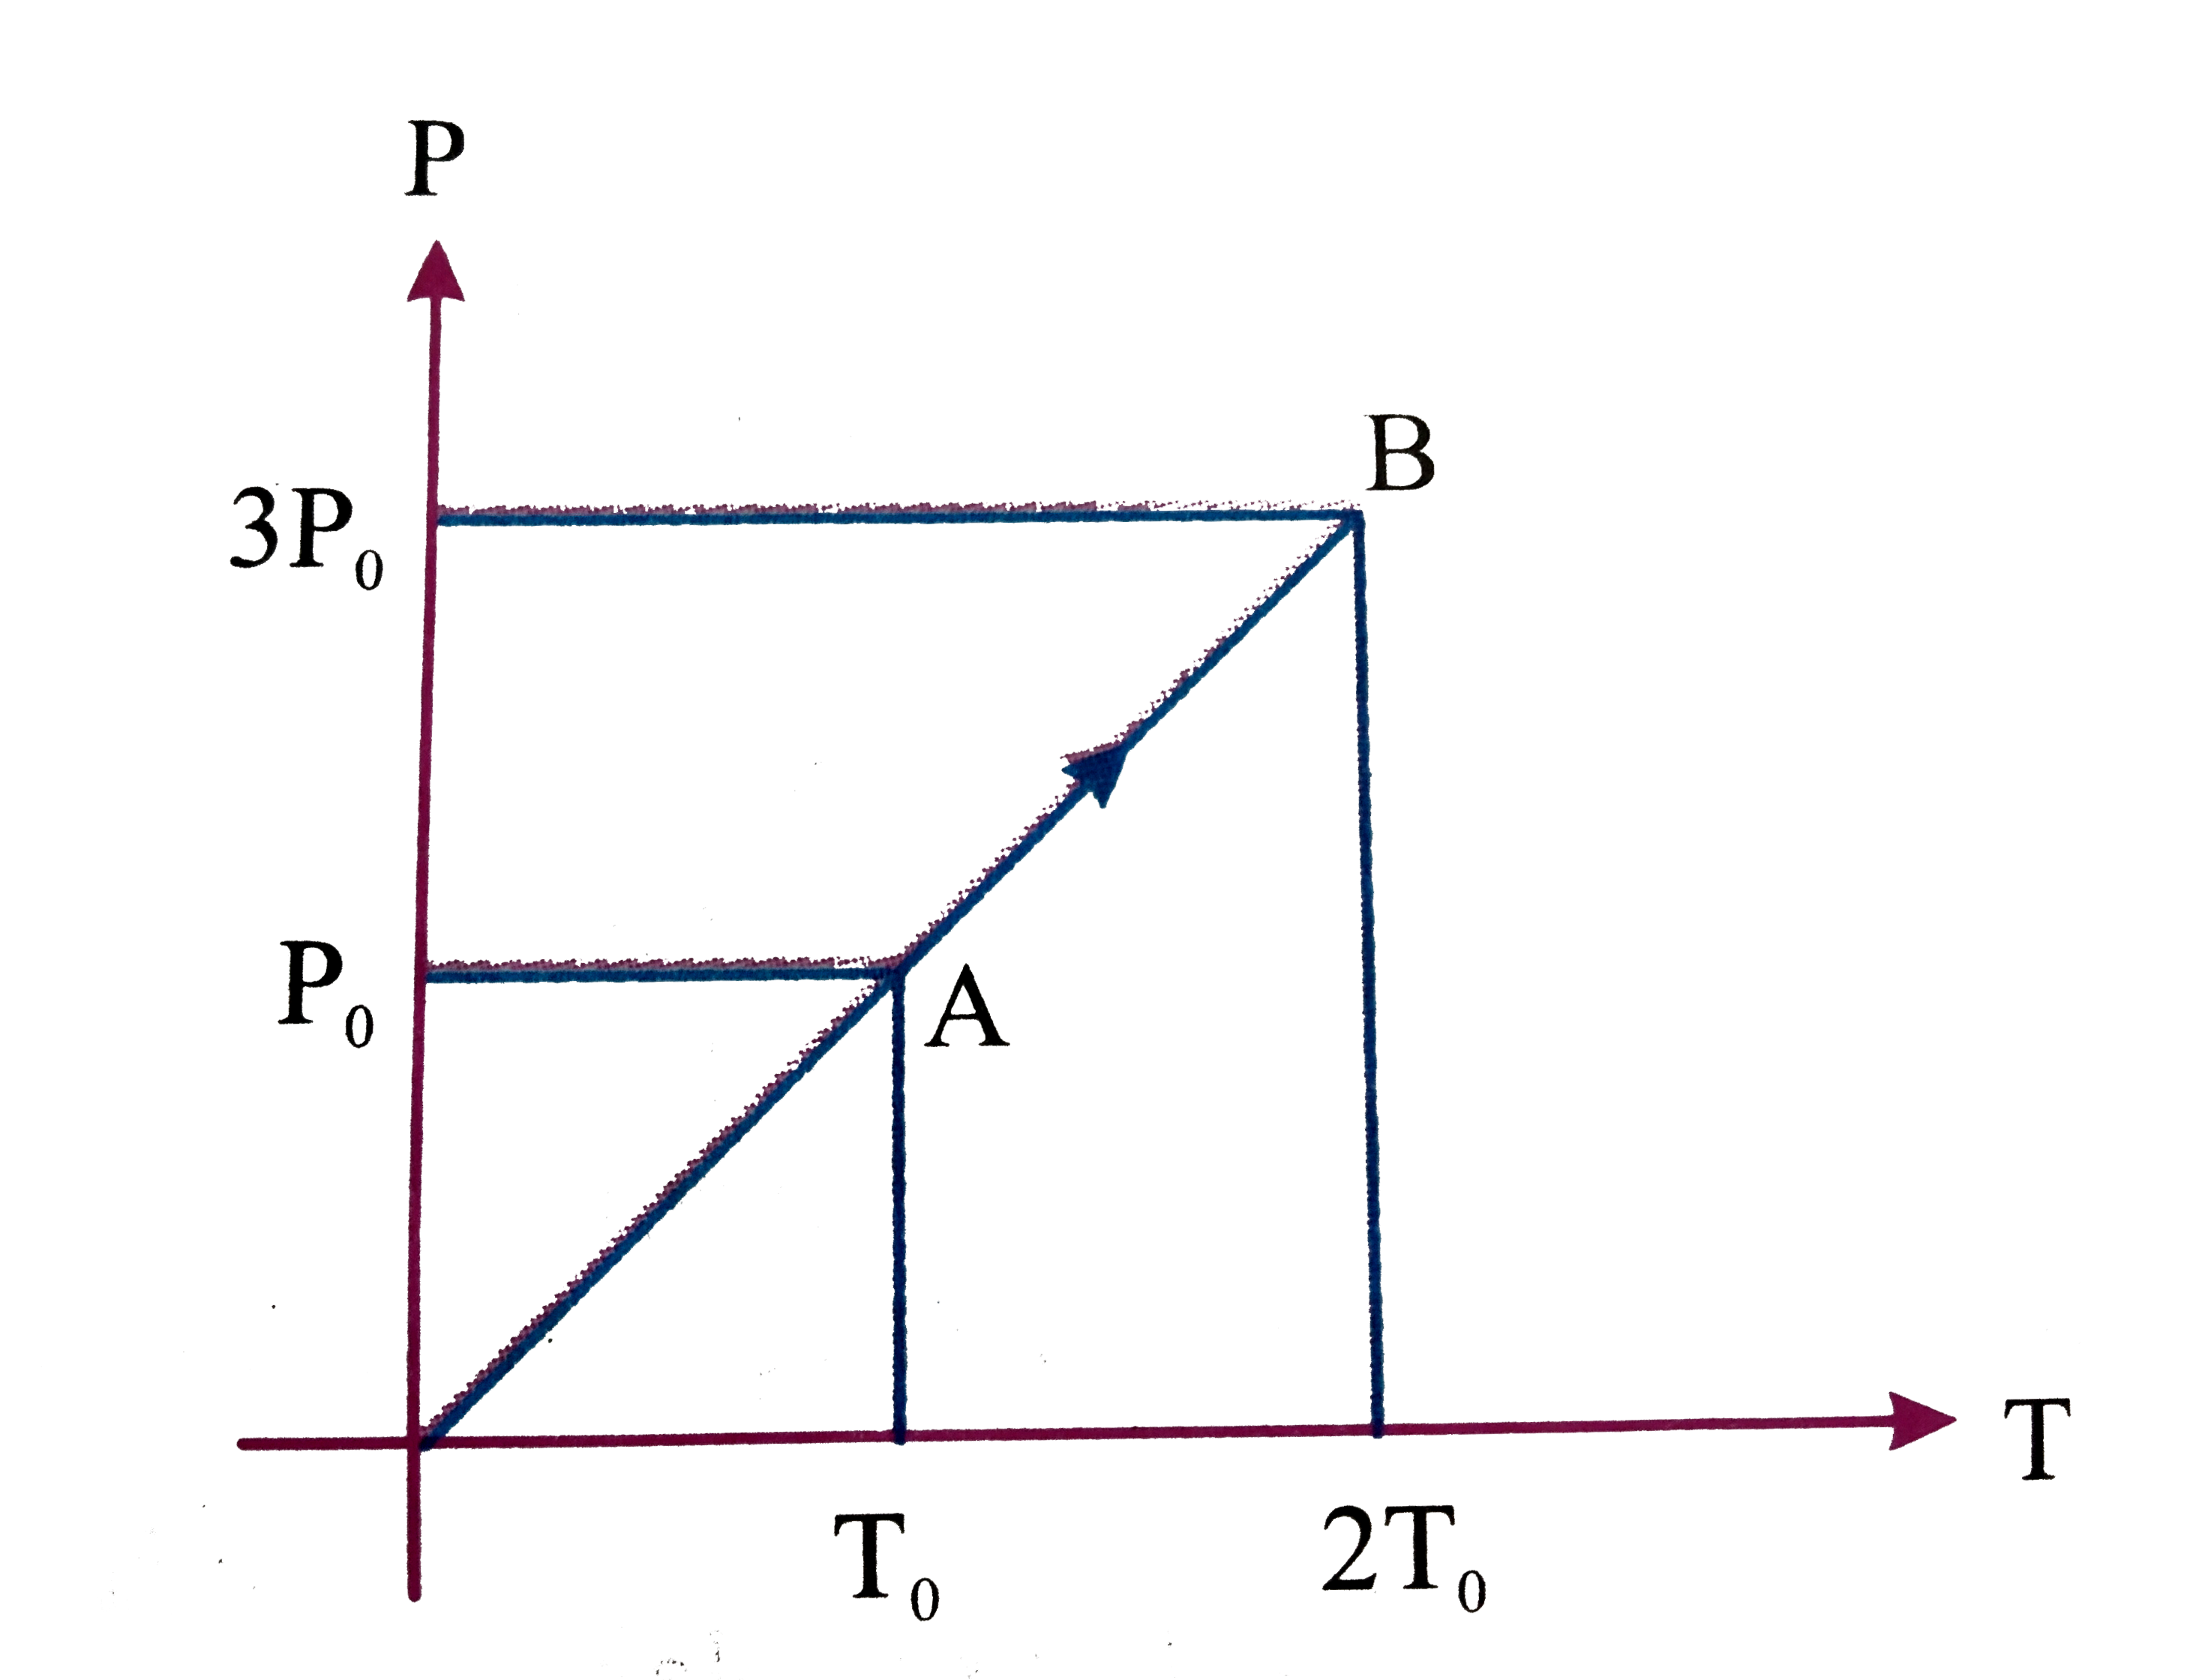 A34ρ0B32ρ0C43ρ0D2ρ0
Pressure versus density graph of an ideal gas is shown in figure
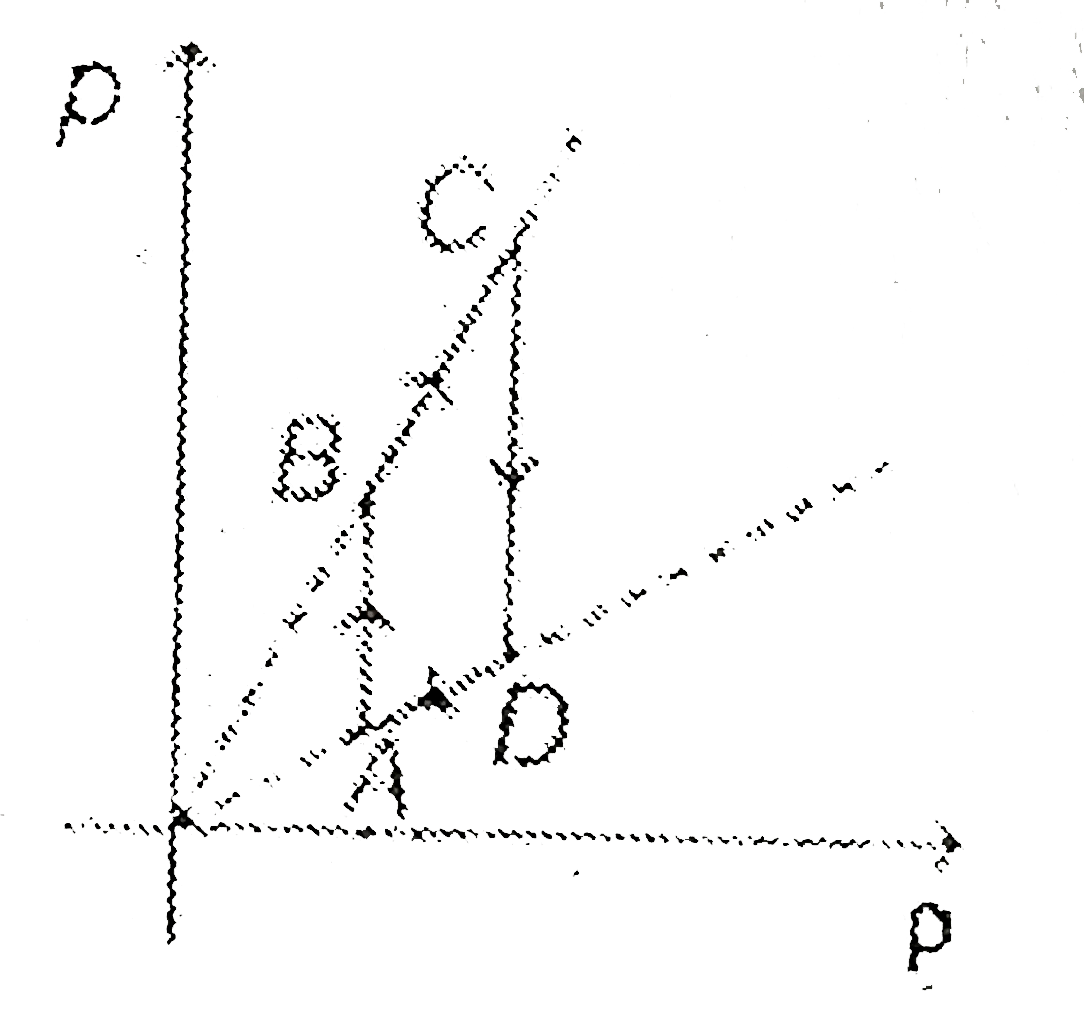 Aduring the process AB work done by the gas is positiveBduring the process AB work done by the gas is negativeCduring the process BC internal energy of the gas is increasingDNone of the above
Pressure versus density graph of an ideal gas is shown in figure

View SolutionPressure (P) versus temperature (T) graph of an ideal gas is shown in the figure. Density of the gas at point A is ρ0 and at B is ρ. Find ρρ0.
'(##CEN_KSR_PHY_JEE_C13_E01_014_Q04##)'
View SolutionPressure versus temperature graph of an ideal gas as shown in Fig.
Corresponding density (ρ) versus volume (V) graph will be
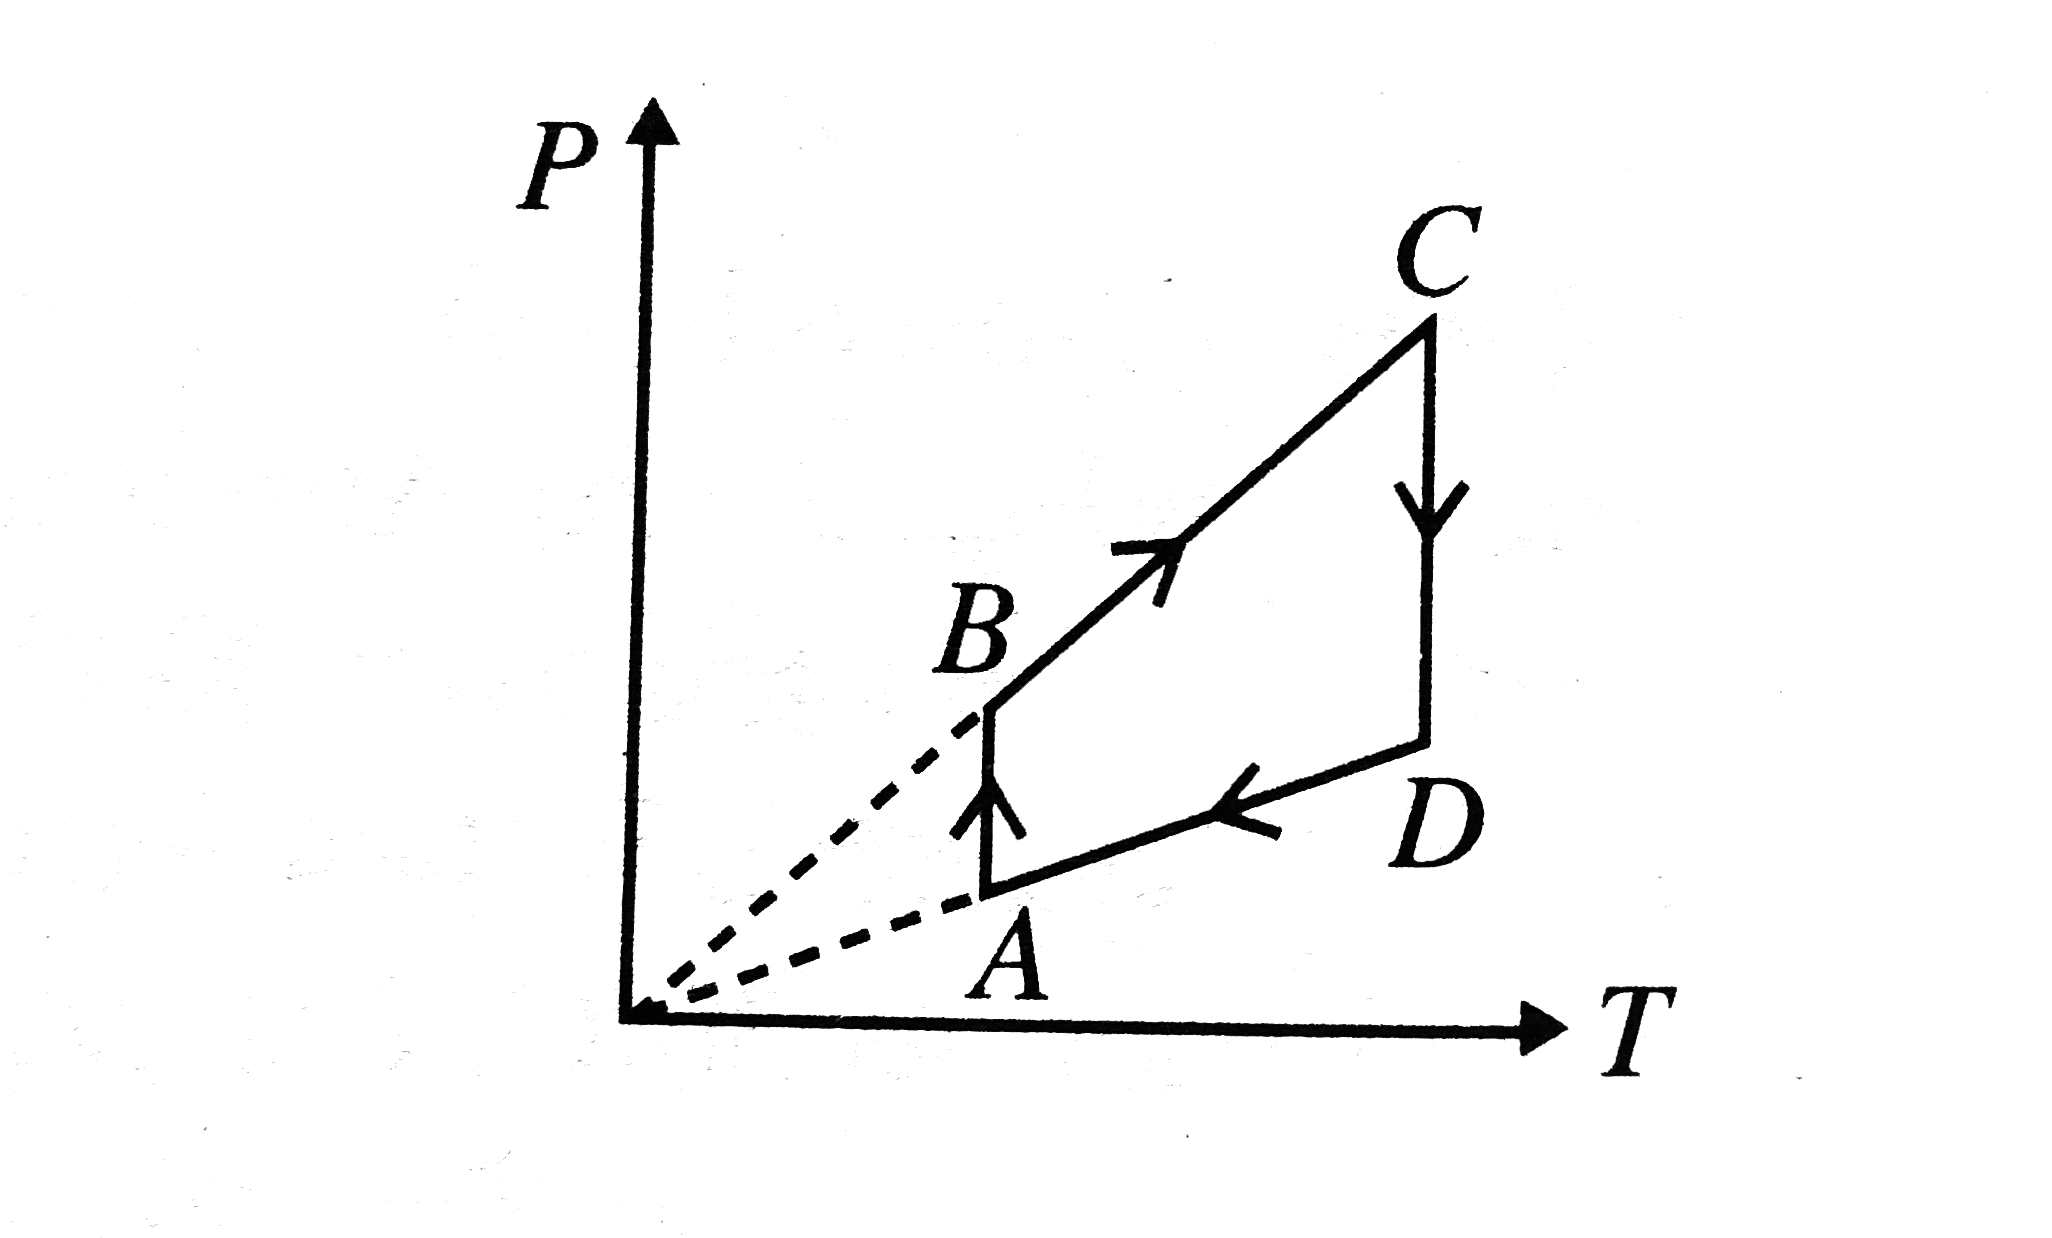
View SolutionPressure versus temperature graph of an ideal gas is shown in figure. Density of the gas at point A is ρ0. Density at B will be

View SolutionPressure versus temperature graph of an ideal gas as shown in Fig.
Corresponding density (ρ) versus volume (V) graph will be

View Solution

