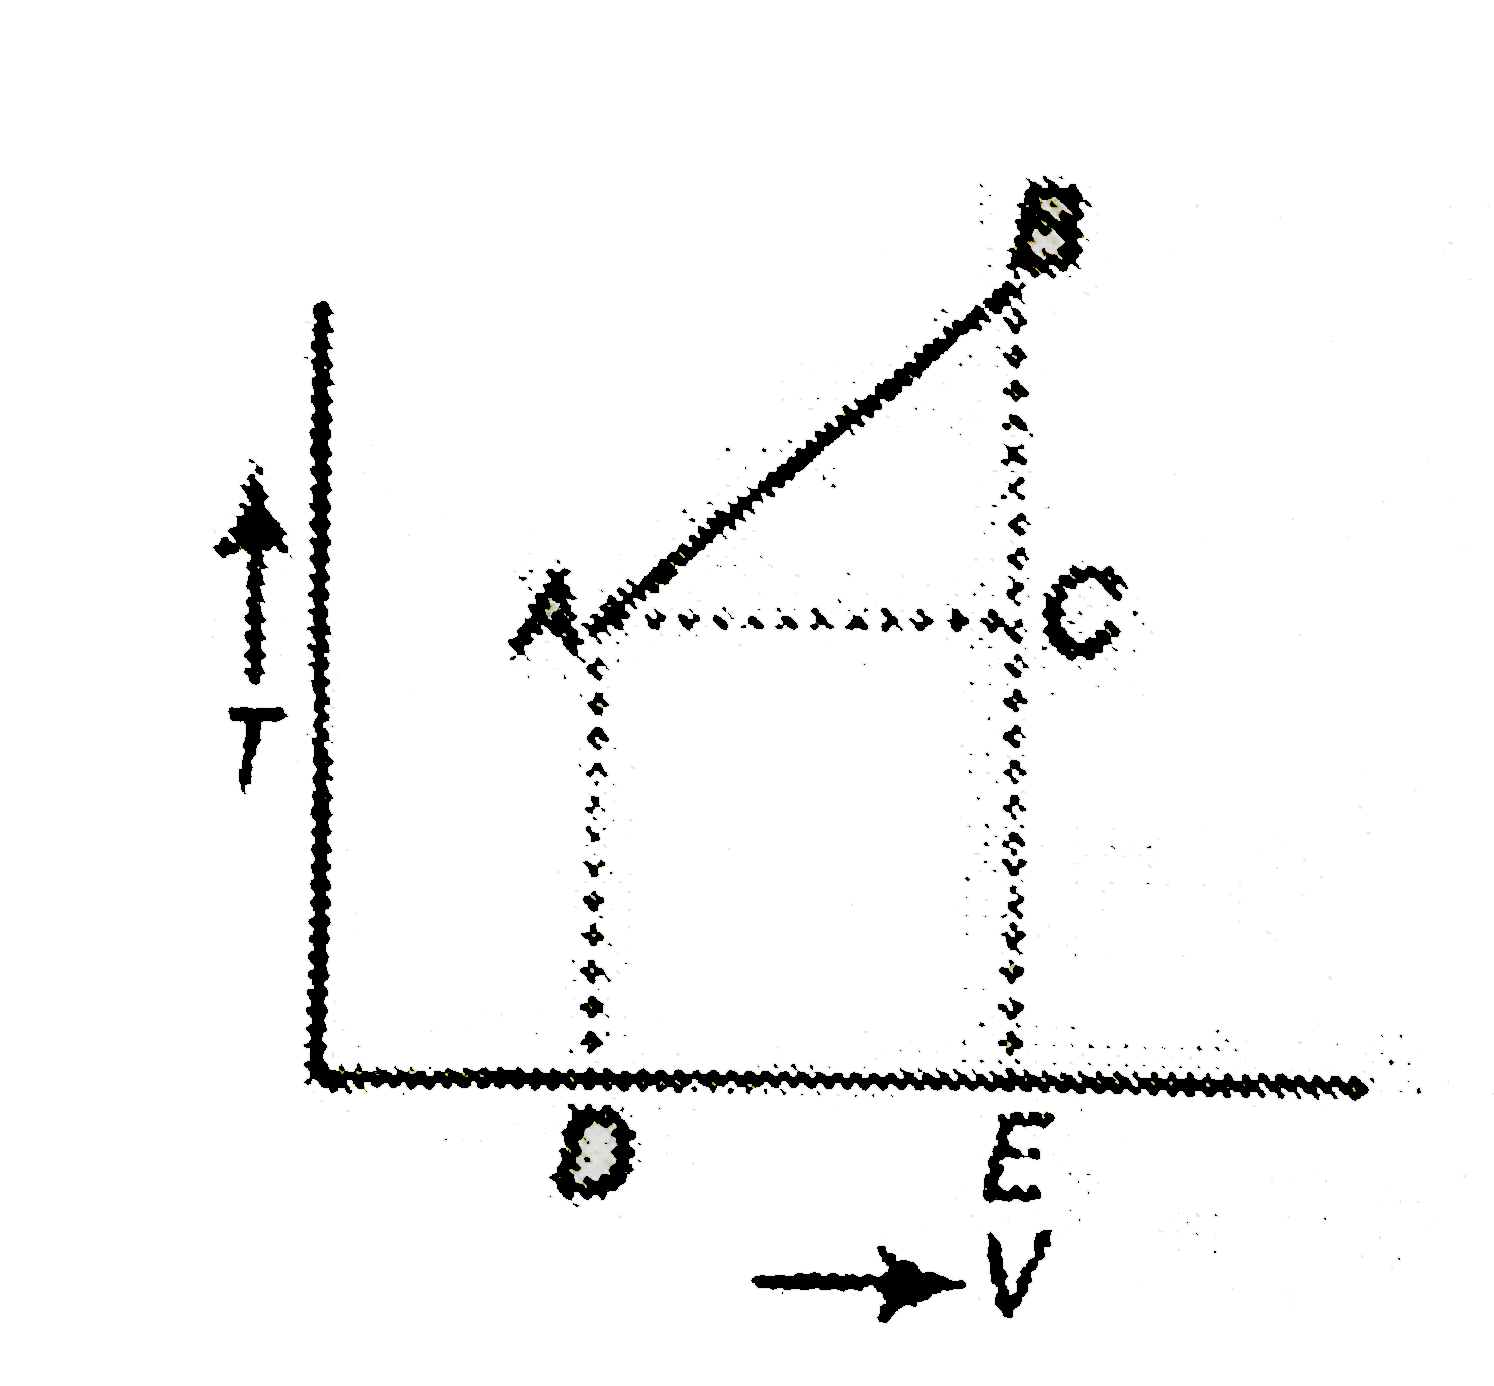
From the followng V-T diagram we can conclude

P=P
P>P
P<P
None of these
In case of given graph V and T are related as V = aT – b , where a and b are constants.
From ideal gas equation, PV = μ RT
We find P=μRTaT−b=μRa−b/T
Since T2>T1, therefore P2<P1
Topper's Solved these Questions
Similar Questions
Knowledge Check
From the following V−T diagram we can conclude:-
_E01_054_Q01.png) AP1=P2BP1>P2CP1<P2Dcan't be say anything
AP1=P2BP1>P2CP1<P2Dcan't be say anythingFrom the following V-T diagram, what is true about pressure?" "[2009]
 AP1<P2BP1>P2CP1=P2DCannot predict
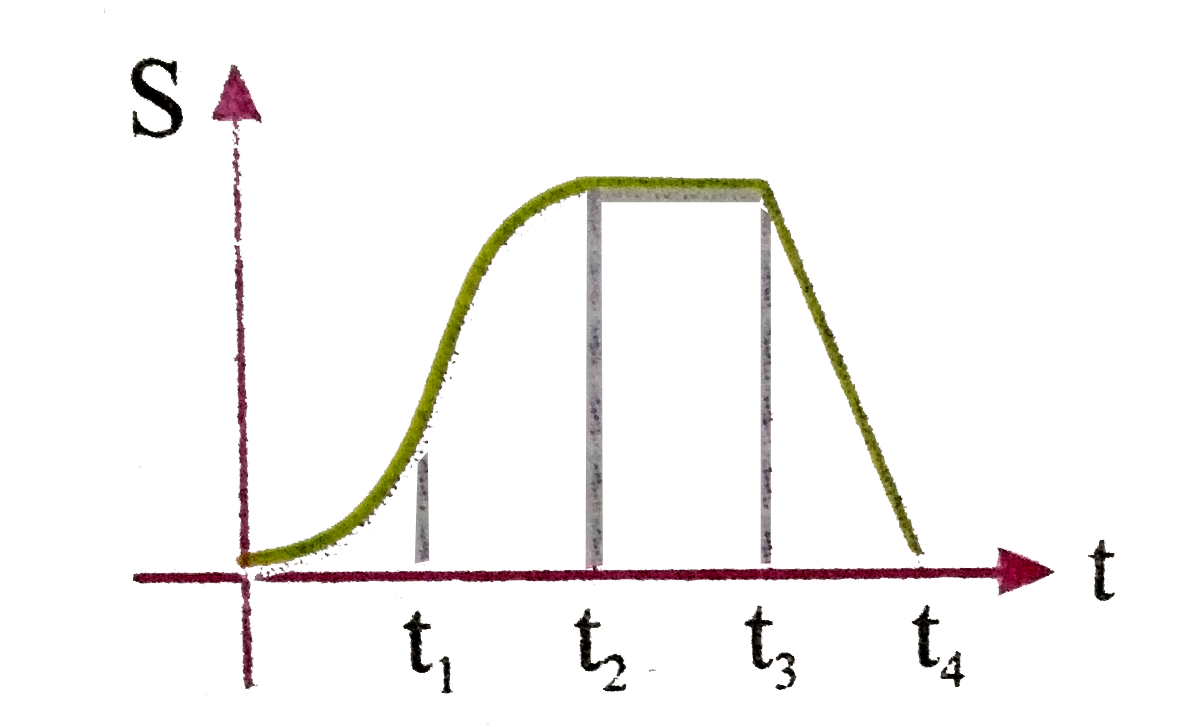
Displacement time graph of a particle moving in a straight line is as shown in figure.
From the graph we can conclude that work done on the block is :
 .Apositive from 0 to t1Bnegative from t1 to t2Czero from t2 to t3Dnegative from t3 to t4.
From the matrix equation AB=AC we can conclude that B=C provide (A) A is singular (B) A is non singular (C) A is symmetric (D) A is square
View SolutionThe graph shows the variation of temperature (T) of one kilogram of a material with the heat (H) supplied to it. At O, the substance is in the solid state. From the graph, we can conclude that

View Solution
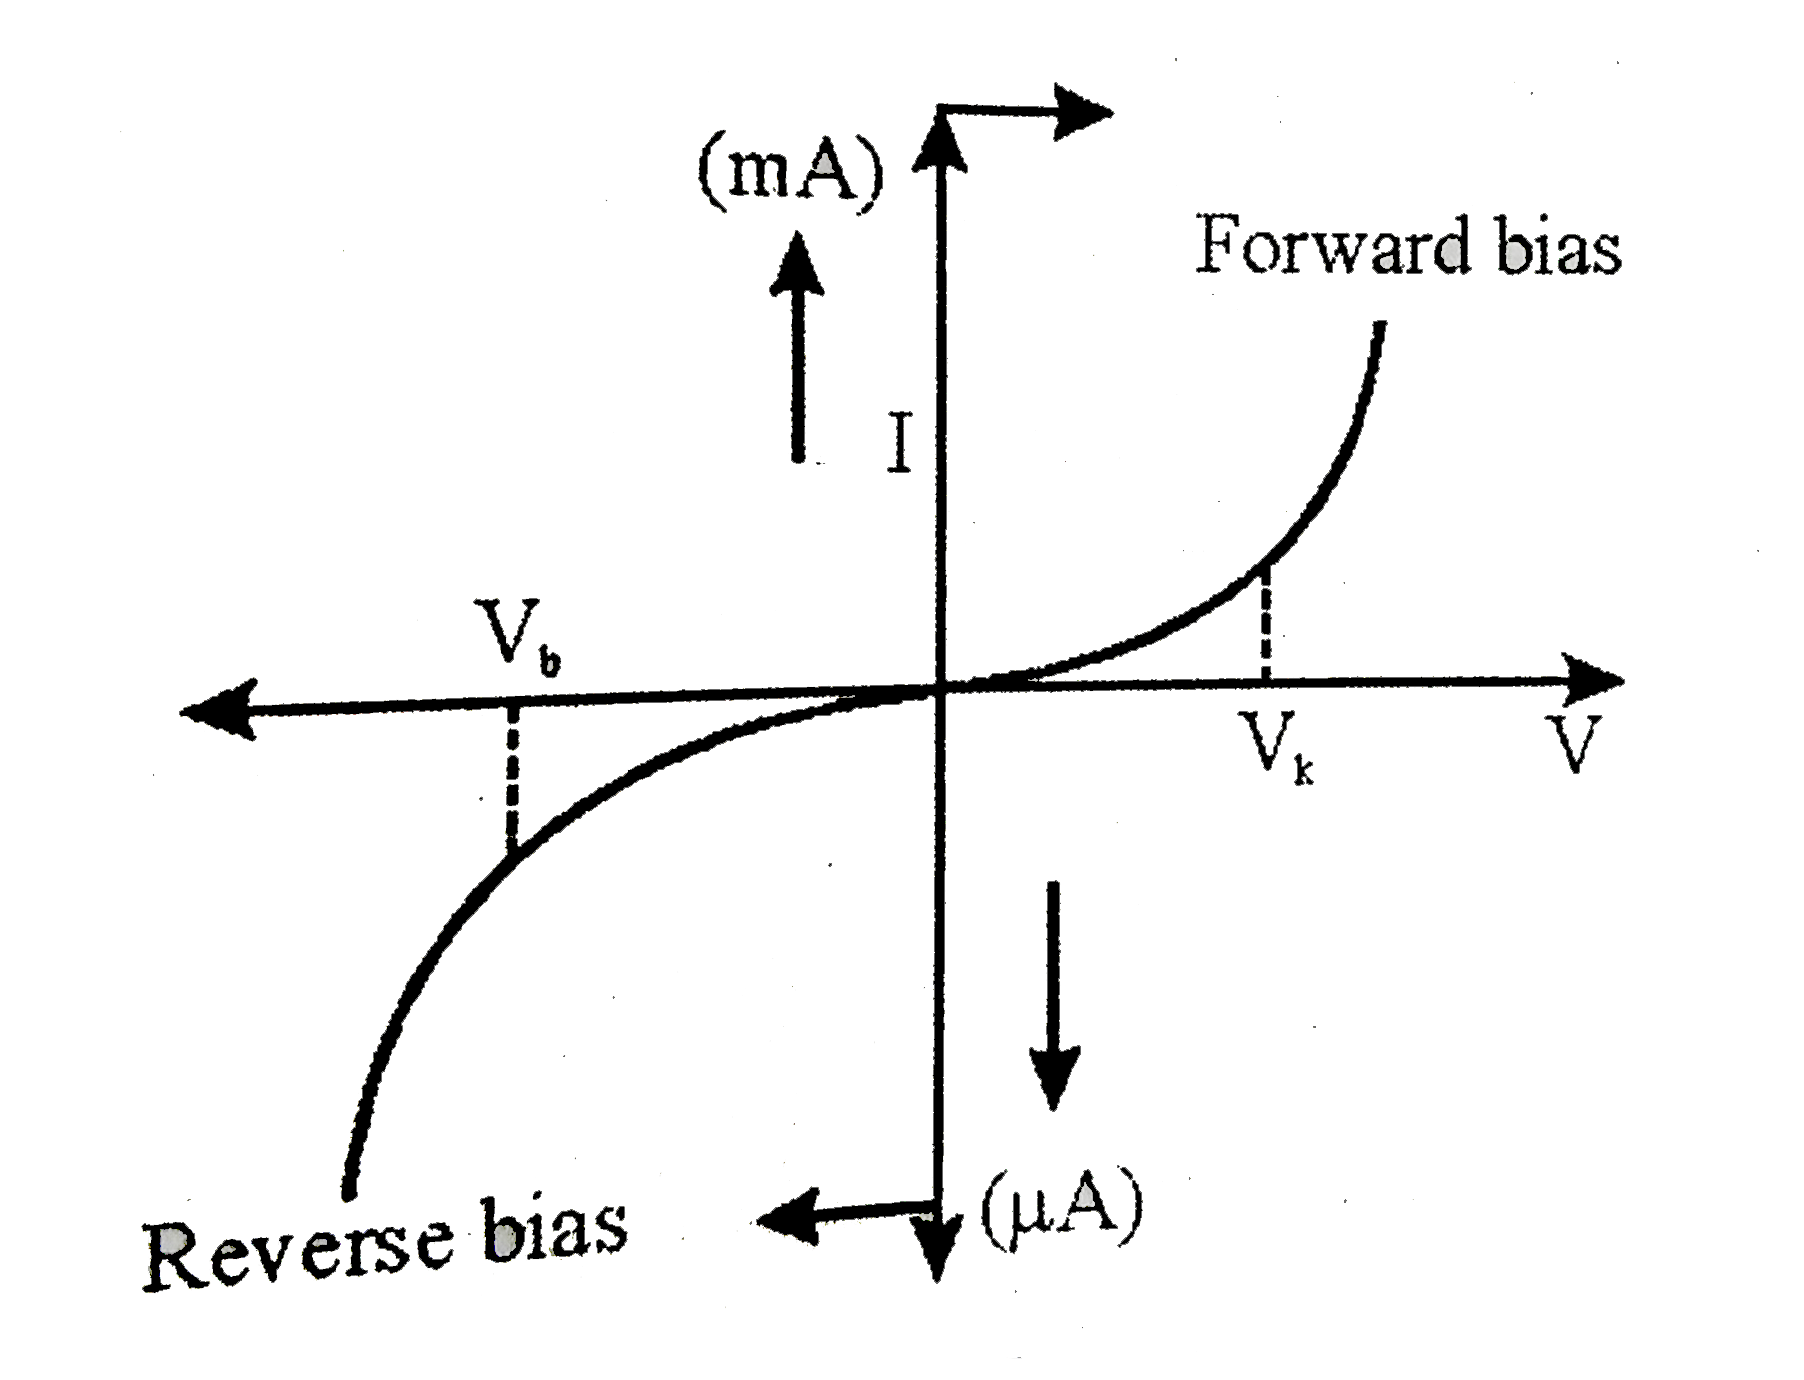
The V-I characterisctic for a p-n junction diode is plotted as shown in the figure. From the plot we can conclude that
[Vb→ breakdown voltage, Vk→ knee voltage]
View SolutionFrom the matrix equation AB=AC we can conclude B=C provided the matrix A is
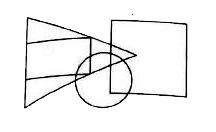
View SolutionThe followng figure represents a group of persons. The triangle represents Educated person, the the ractangle represents the Administrative persons the square represents the Businessman and circle income tax payers.

From the above figure it can be concluded that
View Solution
