The following data shows the number of students opting different subject in a college: Subjects, English, Maths, Physics, Chemistry, Eco., Commerce No. of Students, 45, 60, 20, 30, 10, 15 Construct a pie-diagram to represent the above data.
Step by step video & image solution for The following data shows the number of students opting different subject in a college: Subjects, English, Maths, Physics, Chemistry, Eco., Commerce No. of Students, 45, 60, 20, 30, 10, 15 Construct a pie-diagram to represent the above data. by Maths experts to help you in doubts & scoring excellent marks in Class 8 exams.
Updated on:21/07/2023Topper's Solved these Questions
Similar Questions
The number of students admitted in different faculties of a college are given below: Faculty, Science, Art, Commerce, Law, Edu., Total No. of Student, 1000, 1200, 650, 450, 300, 3600 Draw a pie-chart to represent the above information.
View SolutionThe following table shows the interest of students of a school in different games :

Represent the data by using a simple bar diagram.
View Solution
Knowledge Check
In a class of 175 students the following data shows the number of students opting one or more subjects Mathematics 100, physics 70, chemistry 28, physics and Chemistry 23, mathematics physics and chemistry 18. how many students have offered mathematics alone ?
A35B48C60D22A class has 172 students. The following data shows the number of students opting one or more subjects: Mathematics 125, Physics 95, Chemistry 65 Mathematics and Physics 55
Mathematics and Chemistry 53
Physics and Chemistry 48 Mathematics, Physics and Chemistry 43
The number of students who opted only Physics isA35B45C29D37In the class of 175 students, the following data shows the number of students opting one or more subjects.
Mathematics 100, Physics 70, Chemistry 40, Mathematics and Physics 30, Mathematics and Chemistry 28, Physics and Chemistry 23, Mathematics, Physics and Chemistry 18.
Than, number of students opted Mathematics alone isA35B48C60D20
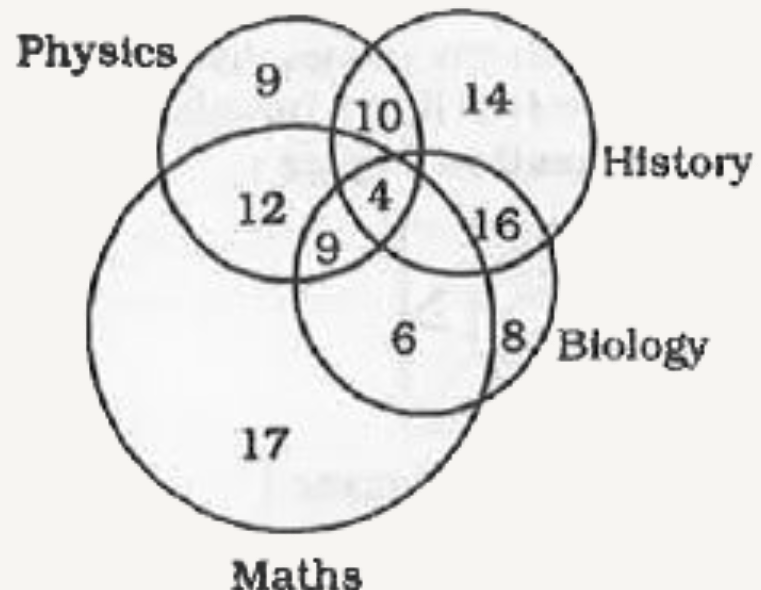
The diagram represents the number of students studying different subjects. What is the number of students who study History and Biology?

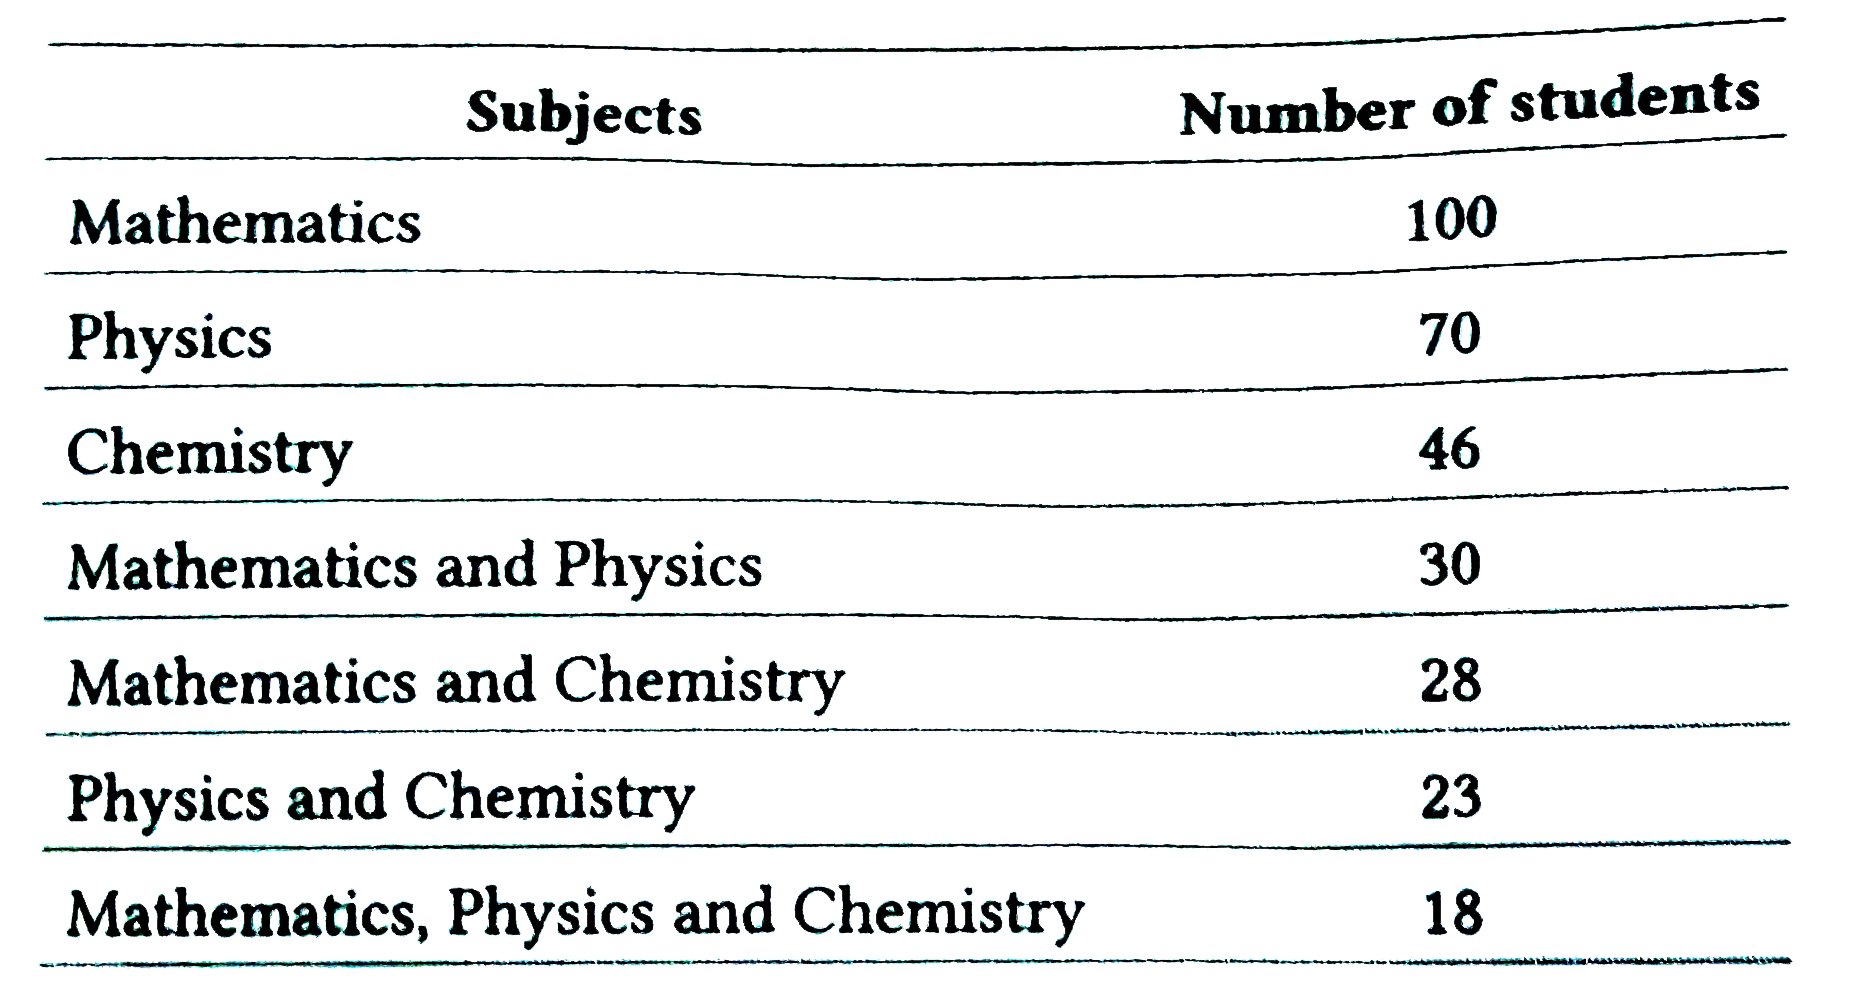
View SolutionA class has 175 students. The following table shows the number of students studying one or more of the following subjects in this case.

How many students are enrolled in Mathematics alone, Physics alone and Chemistry alone? Are there students who have not offered any one of these subjects?
View SolutionA class has 175 students. The following data shows the number of students obtaining one or more subjects : Mathematics 100, Physics 70, Chemistry 40, Mathematics and Physics 30, Mathematics and Chemistry 28, Physics and Chemistry 23, Mathematics & Physics & Chemistry 18. How many students have offered Mathematics alone ?
View SolutionA class has 175 students. The following data shows the number of students obtaining one or more subjects. Mathematics 100, Physics 70, Chemistry 40, Mathematics and Physics 30, Mathematics and Chemistry 28, Physics and Chemistry 23, Mathematics, Physics and Chemistry 18. How many students have offered Mathematics alone (a) 35 (c) 60 (b) 48 (d) 22
View SolutionA class has 175 students. The following data shows the number of students obtaining one or more subjects. Mathematics 100, Physics 70, Chemistry 40, Mathematics and Physics 30, Mathematics and Chemistry 28, Physics and Chemistry 23, Mathematics, Physics and Chemistry 18. How many students have offered Mathematics alone (a) 35 (c) 60 (b) 48 (d) 22
View Solution
