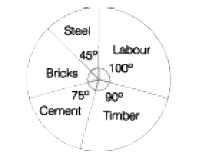
The following data gives the amount spent on the construction of a house. Draw a pie diagram. Items, Cement, Timber, Bricks, Labour, Steel, Misc. Expenditure (in thousand Rs), 60, 30, 45, 75, 45, 45
Step by step video & image solution for The following data gives the amount spent on the construction of a house. Draw a pie diagram. Items, Cement, Timber, Bricks, Labour, Steel, Misc. Expenditure (in thousand Rs), 60, 30, 45, 75, 45, 45 by Maths experts to help you in doubts & scoring excellent marks in Class 8 exams.
Updated on:21/07/2023Topper's Solved these Questions
Similar Questions
The following data relates to the cost of construction of a house in Delhi. Items, Cement, Steel, Bricks, Timber, Labour, Misc. Expenditure, 30%, 10%, 10%, 15%, 25%, 10% Draw a pie-diagram to represent the above data.
View SolutionThe following data gives the amount of manure (in thousand tonnes) manufactured by a company during some years: Year, 1992, 1993, 1994, 1995, 1996, 1997 Manure (In thousand tonnes), 15, 35, 45, 30, 40, 20 Represent the above data with the help of a bar graph. Indicate with the help of the bar graph the year in which the amount of manure manufactured by the company was maximum. Choose the correct alternative: The consecutive years during which there was maximum decrease in manure production are: 1994 to 1995 (b) 1992 and 1993 1996-1997 (d) 1995 and 1996
View Solution
Knowledge Check
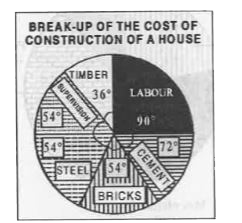
The following pie chart represents a total expenditure of 540000 on different items in constructing a flat in a town. The expenditure on bricks is less than the expenditure on timber (in ?)
 A10000B12500C60000D65000
The following pie chart represents a total expenditure of 540000 on different items in constructing a flat in a town. The percentage of the total expenditure spent on steel and cement is
 A0.3323B0.25C3313%D30%
The pie chart given here shows the breakup of the cost of construction of a house on various heads. Study the chart and answer the questions.

The total expenditure incurred on bricks, steel and cement is what per cent of the total cost of construction ?A50%B54%C72%D75%
Following is the break up of the expenditure of a family on different items of consumption.: Items, Food, Clothing, Rent, Education, Fuel etc., Medicine, Misc. Expenditure (in Rs), 1600, 200, 600, 150, 100, 80, 270 Draw a pie-diagram to represent the above data.
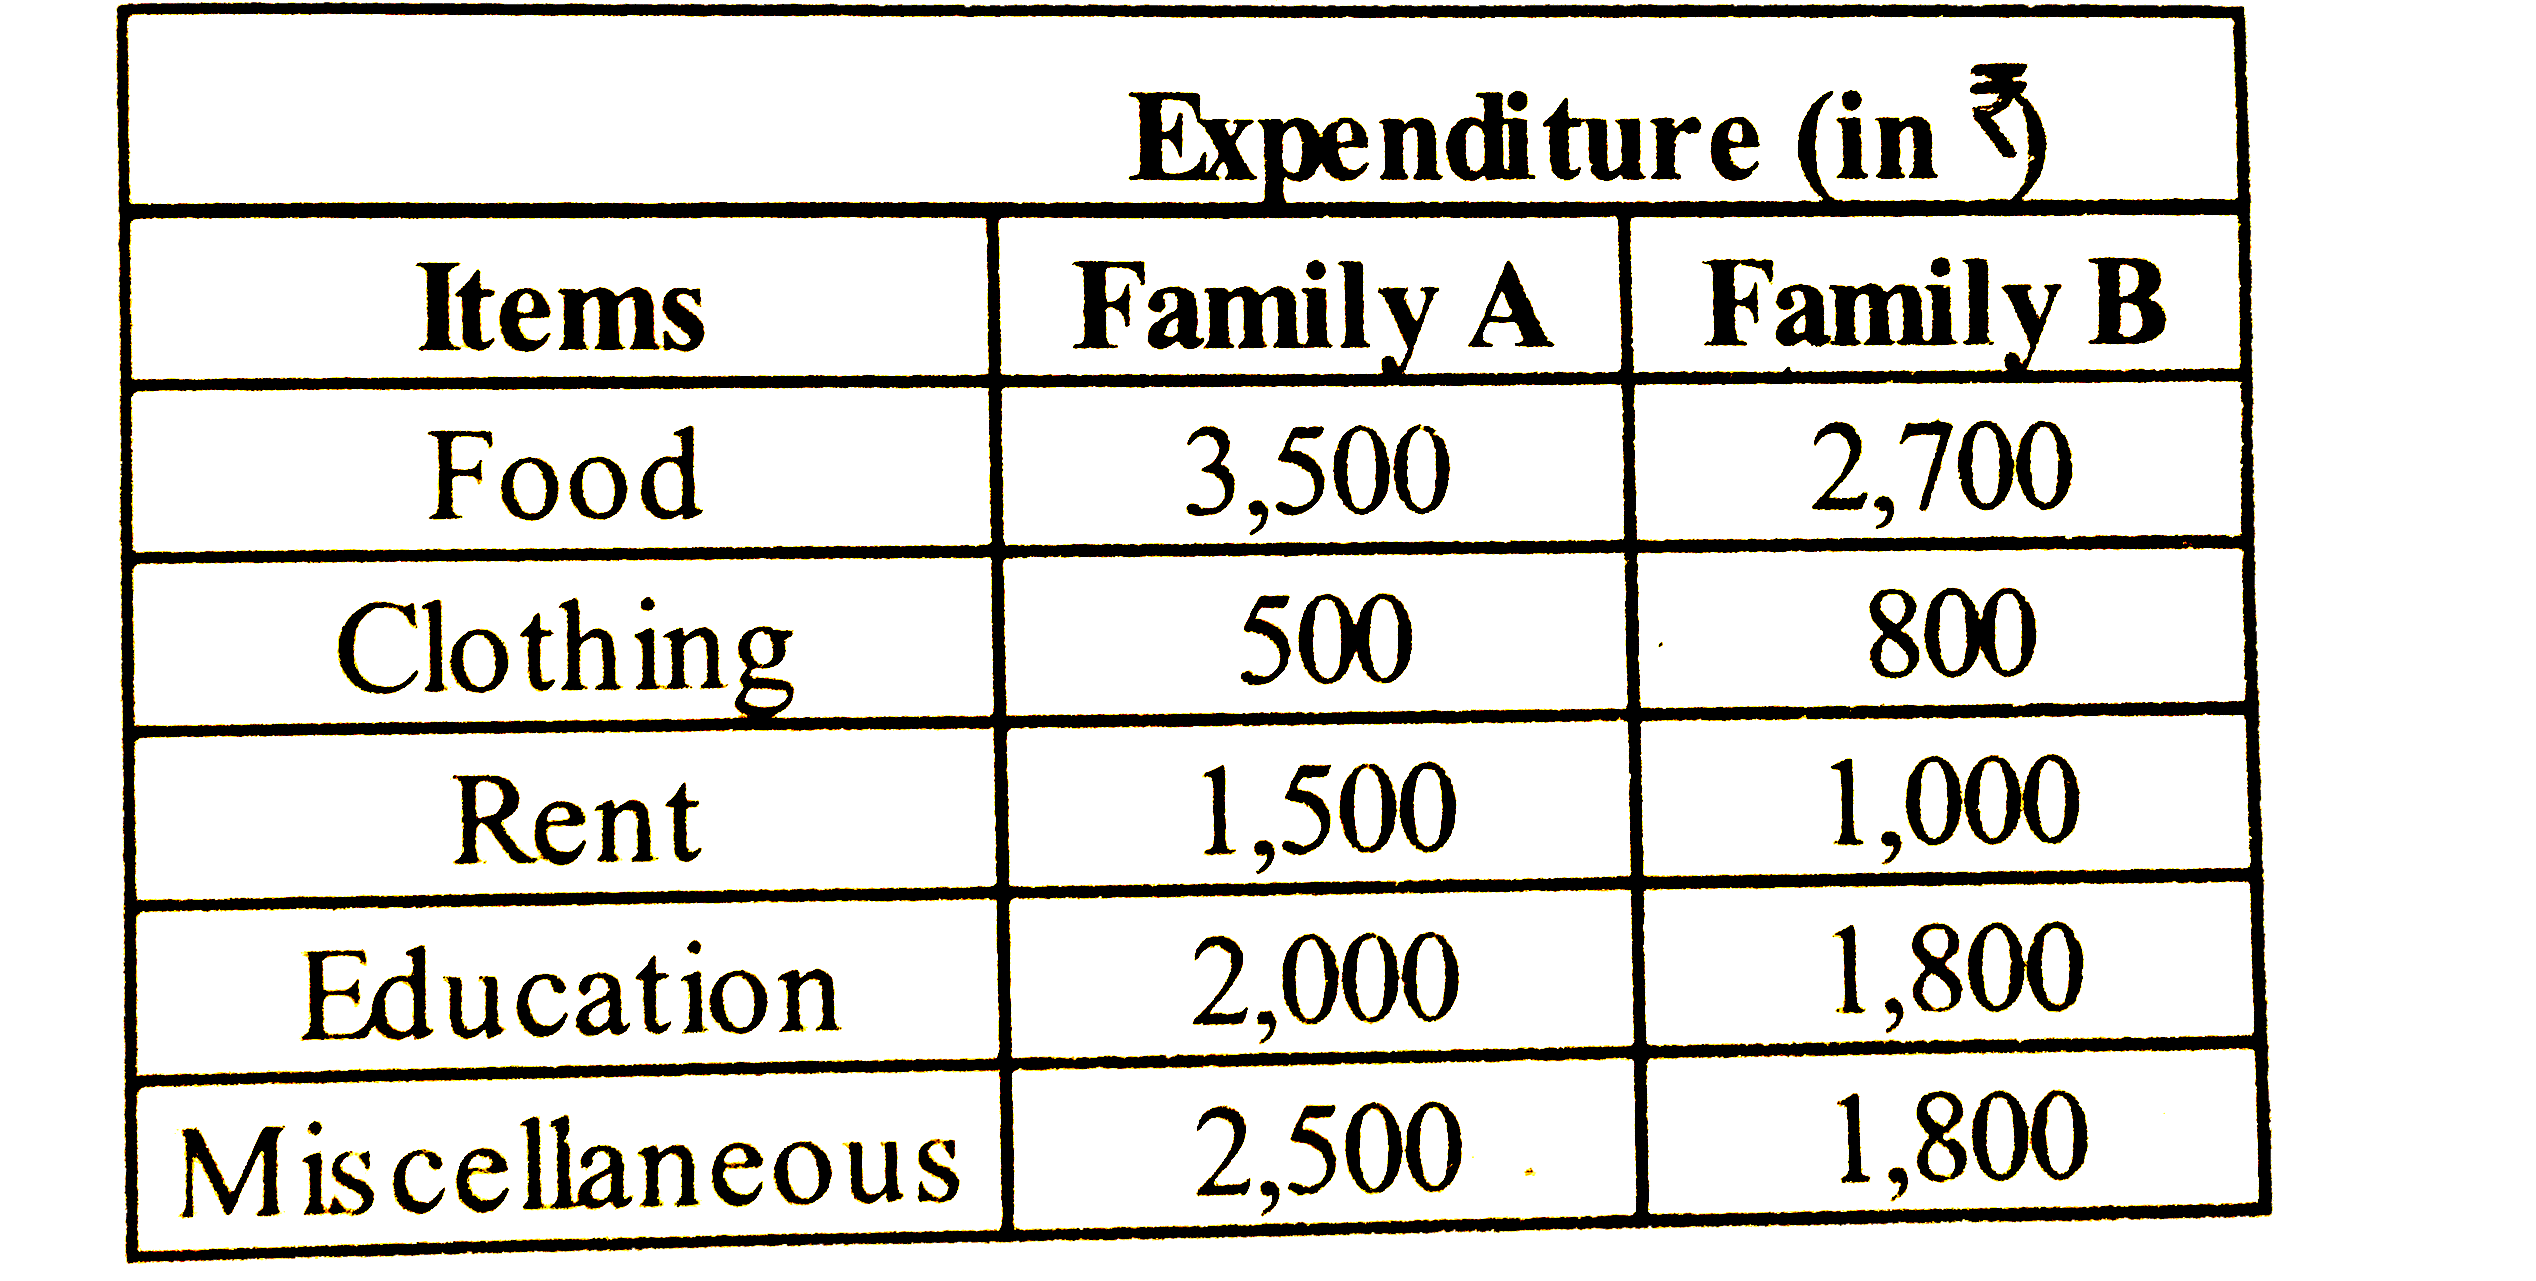
View SolutionThe following table gives the monthly expenditure of two families:

In constructing a pie diagram to the above data, the radii of the circles are to be chosen by which one of the following ratios?
View SolutionThe following table gives the monthly expenditure of two families

In constructing a pie diagram to the above data, the radi of the circles are to be chosen by which one of the following ration?
View SolutionDraw a pie-diagram for the following data of expenditure pattern in a family: Items, Food, Clothing, Rent, Edu, Misc. Expenditure (in Rs) 4000, 2000, 1500, 1500, 1000
View SolutionThe following table shows the expenditure incurred by a publisher in publishing a book: Items, Paper, Printing, Binding, Advertishing, Misc. Expenditure (in %), 35%, 20%, 10%, 5%, 30% Present the above data in the form of a pie-chart.
View Solution
