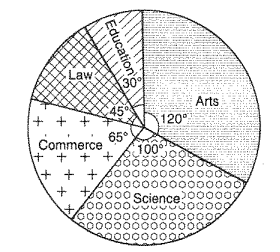
The following pie-chart shows the number of
students admitted in different feculties of a
college. If 1000 students are admitted in Science answer the following:
What is the total number of students?
What is the ratio of students in science and
arts?
Step by step video & image solution for The following pie-chart shows the number of students admitted in different feculties of a college. If 1000 students are admitted in Science answer the following: What is the total number of students? What is the ratio of students in science and arts? by Maths experts to help you in doubts & scoring excellent marks in Class 8 exams.
Updated on:21/07/2023Topper's Solved these Questions
Similar Questions
Direction :- The following pie-chart shows the number of students who failed in different subjects in an examination. Examine the chart and answer the following questions. The total number of students who have failed is 500.
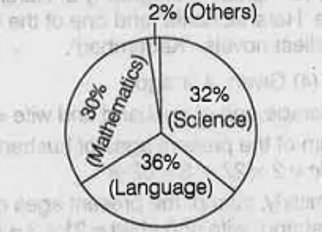
The number of students failed in Science is less than the number of student failed in all other subects by
View SolutionThe following pie-chart shows the number of students who failed in different subjects in an examination. Examine the chart and answer the following questions. The total number of students who have failed is 500.
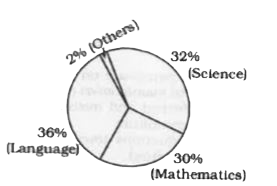
The number of students failed in science is less than the number of students failed in all other subjects by :
View Solution
Knowledge Check
The following table shows the number of students enrolled in different faculties in college.

The percentage of students studying in faculties other than Science is:A75%B80%C60%D20%The pie chart shows the number of students enrolled in the various engineering courses that a certain college offers. Studv the diagram and answer the following questions.
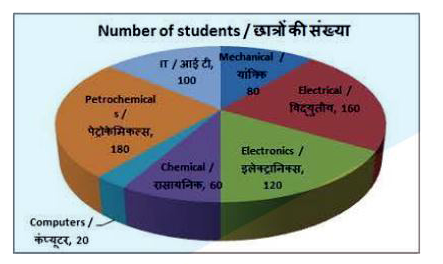
What is the total number of students enrolled in the college?Aa. 600Bb. 780Cc. 720Dd. 640In a college 40% students are graduates. If the number of graduates is 7000, then what are the total number of students in the college?
A19500B18000C17500D21500
The following pie-chart shows the number of students who failed in different subjects in an examination. Examine the chart and answer the following questions. The total number of students who have failed is 500.
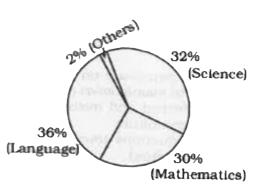
The central angle of the sector for the students who have failed in mathematics is :
View SolutionThe following piechart shows the number of students who failed in different subjects in an examination. Examine the chart and answer the questions 5 to the total number of students who have failed is 500.

Total number of students who did not qualify in Mathematics or Language or Science, is
View SolutionThe pie chart given below shows the number of students in 6 different sections. The total number of students is 1800.
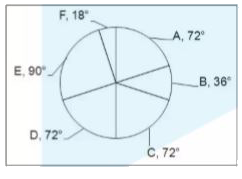
What is the difference between the number of students in section F to the number of students in section C?
View SolutionThe pie chart shows the number of students enrolled in the various engineering courses that a certain college offers. Study the diagram and answer the following questions.
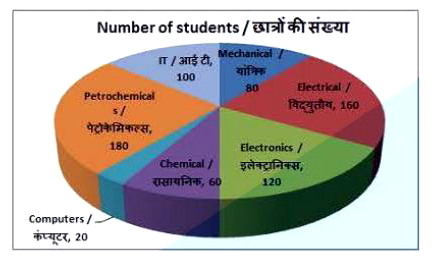
The most number of students are enrolled in which course?
View SolutionThe number of students enrolled in different faculties in a school is as follows

The percentage of students studying in Science and Vocational Subject is:
View Solution
