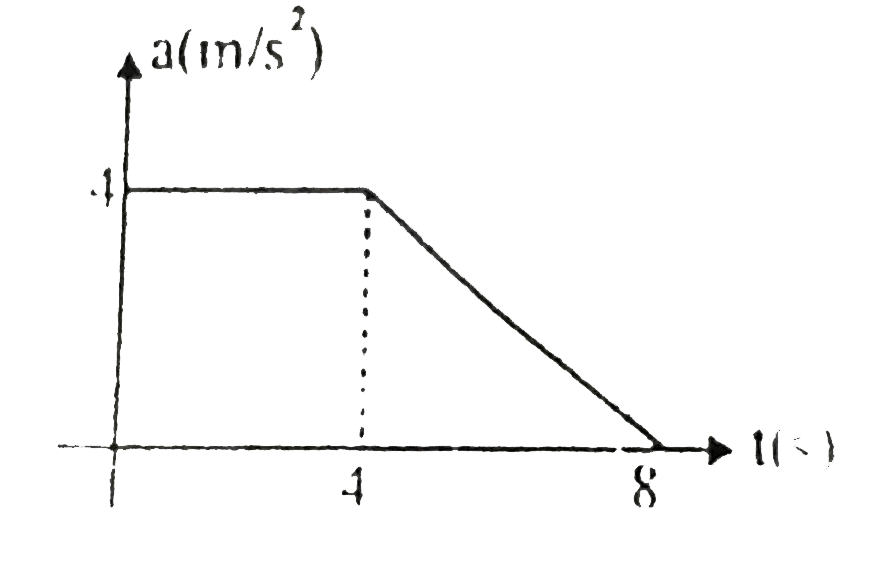
The acceleration - time graph of a particle is as shown in figure Initial velocity of particle is 10m/s Displacement of the particle (in m) at the end of 8 sec is ___ Round off to nearest integer.
The correct Answer is:0197
v=u+at
v1=10+4×4=26m/s
S1=10×4+12×4×16=40+32=72 m
Now a=8−t
drdt=8−t
r∫26dr=t∫4(8−t)=dt
v−26=[8t−t22]t4
v=26+(8t−t22)−(32−162)
v=26+8t−t2224
v=2+8t−t22
dxdt=2+8t−t22
x=[2t+4t2−t36]84=(16+64×4−836)−(8+64−646)=8+64×3−74.6
=200−74.6=125.33
Total distance =72+125.33=197.33≈197]
Topper's Solved these Questions
- BOOK - BANSALCHAPTER - MASTER PRACTICE PROBLEMEXERCISE - Additional topic70videos
MASTER PRACTICE PROBLEM
- BOOK - BANSALCHAPTER - MASTER PRACTICE PROBLEMEXERCISE - Multiple objective131videos
MASTER PRACTICE PROBLEM
- BOOK - BANSALCHAPTER - FLUID MECHANICSEXERCISE - PYQS AIEEE10videos
FLUID MECHANICS
- BOOK - BANSALCHAPTER - SEMICONDUCTORSEXERCISE - CBSE Question32videos
SEMICONDUCTORS
Similar Questions
Knowledge Check
- Question 1 - Select One
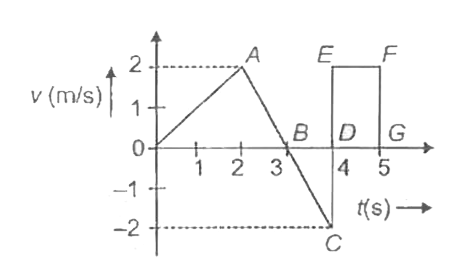
The velocity − time graph of a particle is as shown in figure
 AIt moves with a constant acceleration throughoutBIt moves with an acceleration of constant magnitude but changing direction at the end of every two secondCThe displacement of the particle is zeroDThe velocity becomes zero at t=4 second
 - Question 2 - Select One
velocity time graph of a particle is shown in figure. Find displacement of the particle.
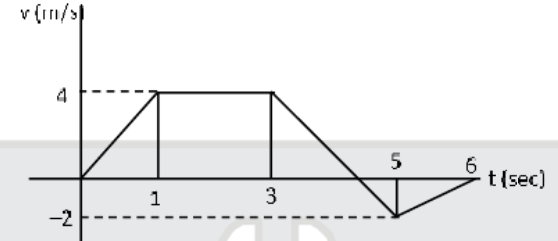 A7B11C5D15
 - Question 3 - Select One
The acceleration - time graph for a particle moving along x - axis is shown in figure, If the initial velocity of particle is −5m/s, the velocity at t = 8 s is
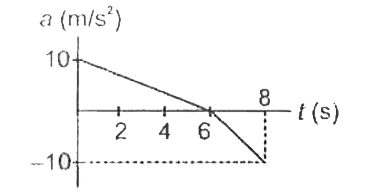 A+15m/sB+20m/sC−15m/sD−20m/s
The displacement - time graph of a particle executing SHM is as shown in the figure. The maximum velocity of the particle is
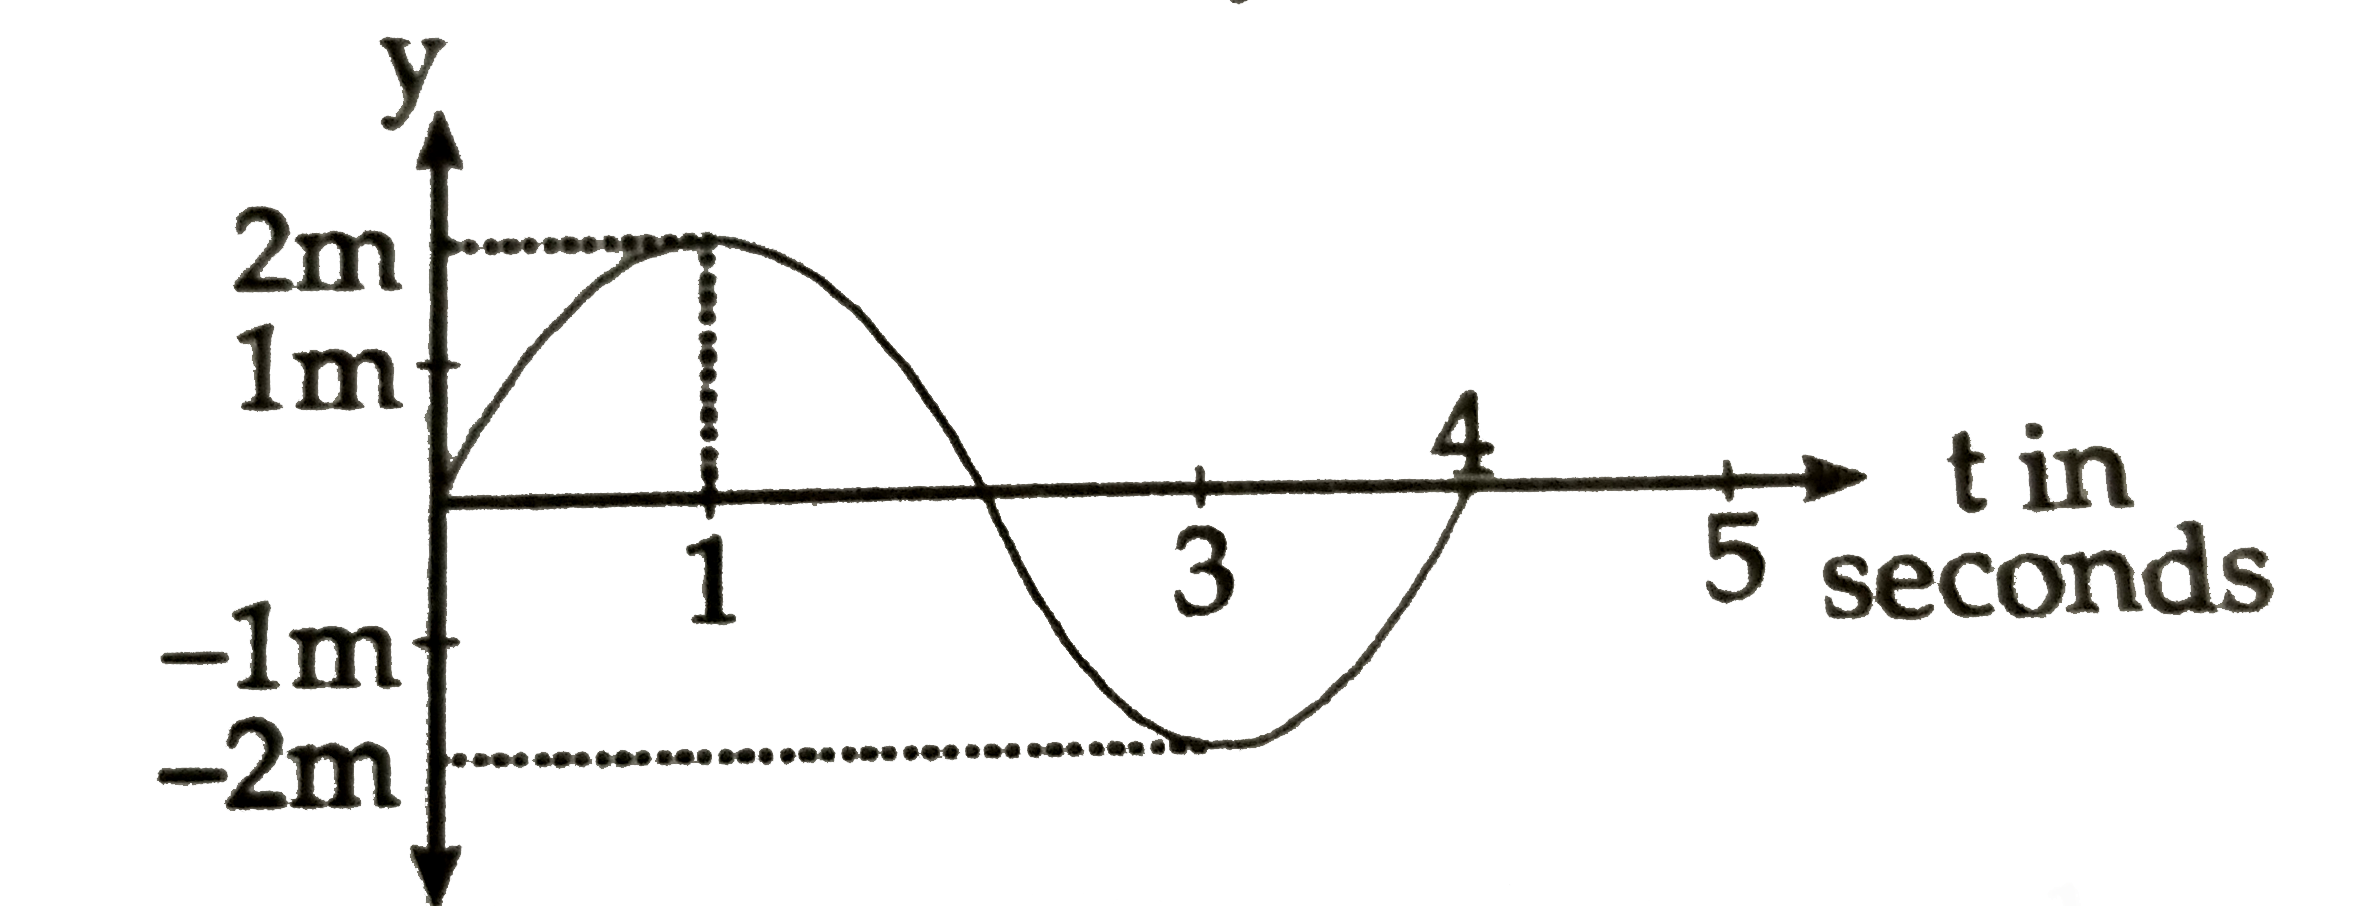 View Solution
The acceleration-displacement graph of a particle moving in a straight line is as shown in figure, initial velocity of particle is zero. Find the velocity of the particle when displacement of the particle is s=12m.
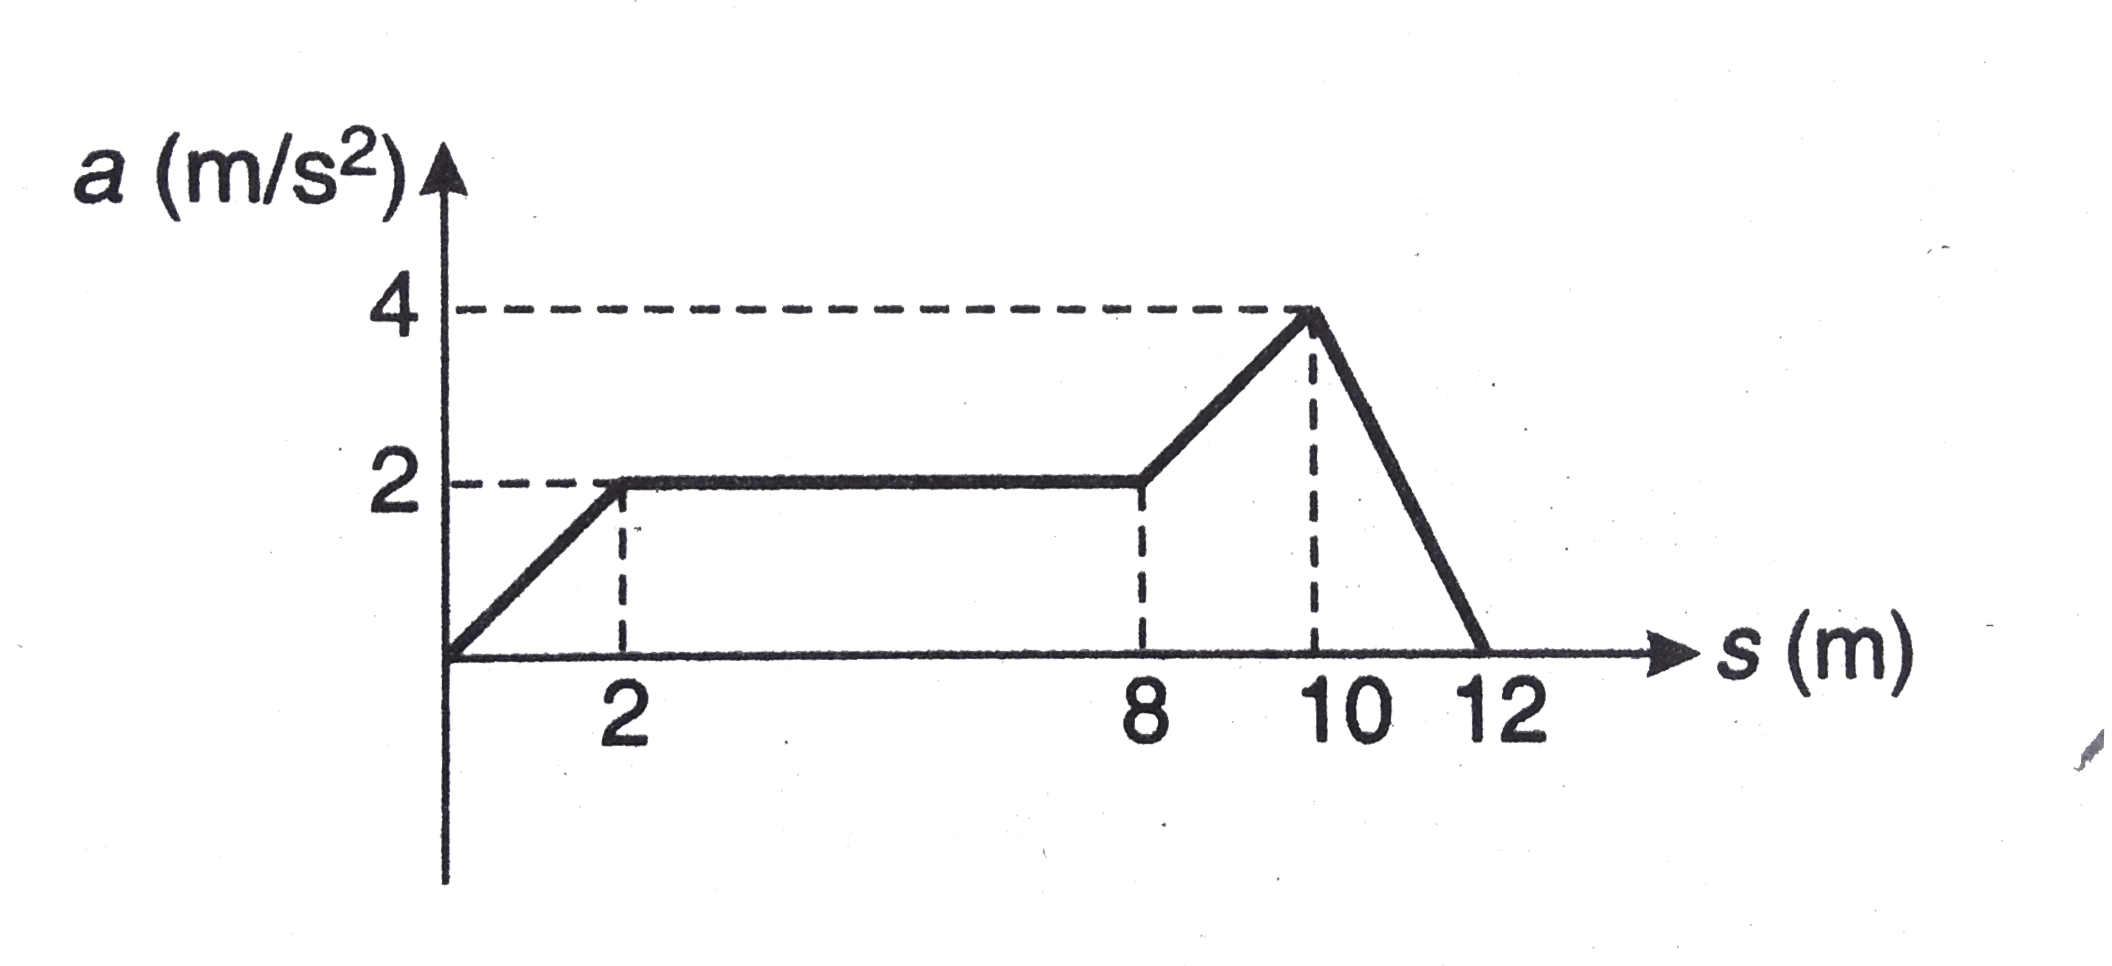 View Solution
The velocity displacement graph of a particle is shown in figure. The acceleration of the particle when x=0 is.
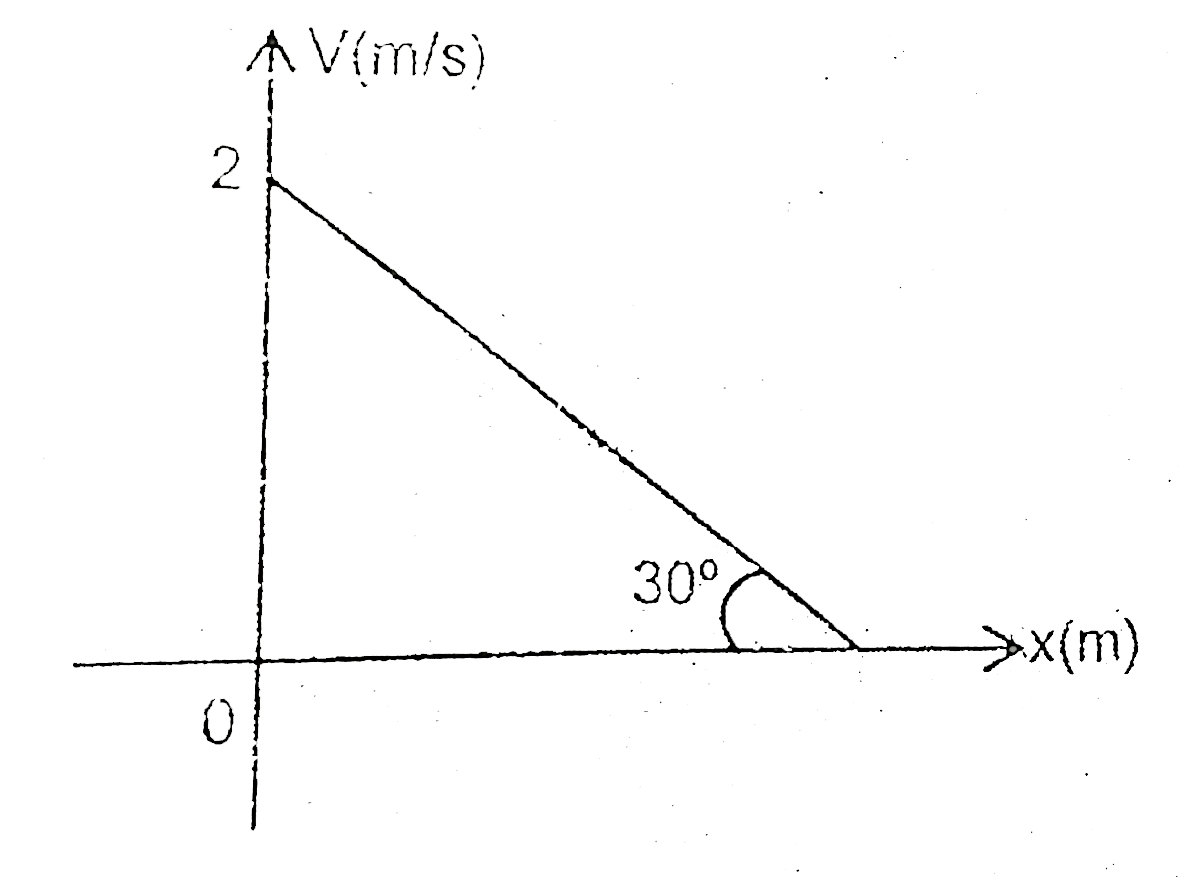 View Solution
The velocity - time graph of a particle moving along a straight line is shown in the figure given below
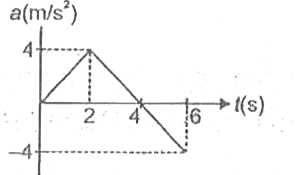
The displacement of the particle in 5 second isView SolutionFor the acceleration - time (a - t) graph shown in figure, the change in velocity of particle from t = 0 to t = 6 s is
 View Solution


