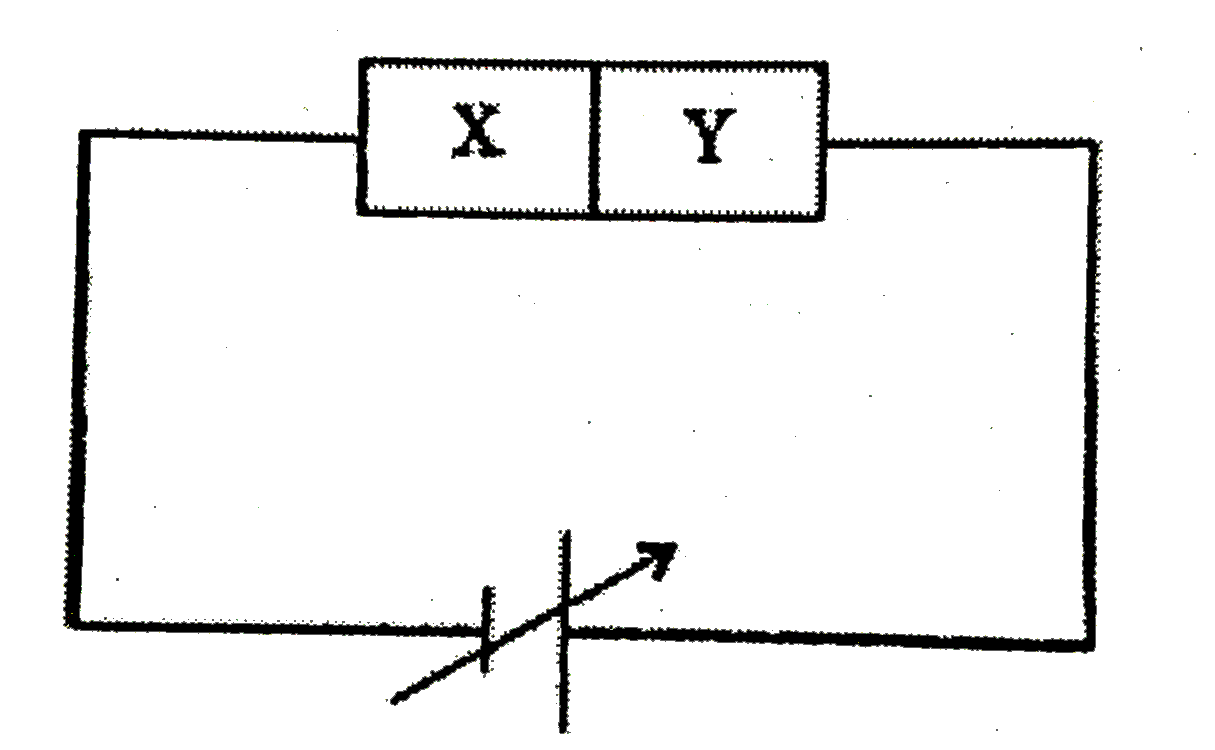
Two semiconductor materials X and Y shown in the given figure, are made by doping germanium crystal with indum and arsenic respectively. The two are joined end to end and connected to a battery as shown.
(i). Will the junction be forward biased or reverse biased.?
(ii). Sketch a V-I graph for this arrangement.
Step by step video & image solution for Two semiconductor materials X and Y shown in the given figure, are made by doping germanium crystal with indum and arsenic respectively. The two are joined end to end and connected to a battery as shown. (i). Will the junction be forward biased or reverse biased.? (ii). Sketch a V-I graph for this arrangement. by Physics experts to help you in doubts & scoring excellent marks in Class 12 exams.
Updated on:21/07/2023Topper's Solved these Questions
Similar Questions
Two semiconductor materials X and Y, shown in the given, are made by doping germanium crystal with indium and arsenic respectively. The two are joined end to end and connected to a battery as shown.
(i) Will the junction be forward biased or reverse biased ?
(i) Sketch a V-I graph for this arrangement.
View SolutionA semiconductor material x is made by doping a germanium crystal with indium another semiconductor material y is made by doping a x nad y ar then joined together and connected to a battery
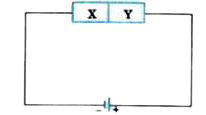
will the jucntion be forward or reverse biased also draw the V-I characteristics for the circuit
View Solution
Knowledge Check
A semiconductor X is made by dopping a germanium crystal with arsenic (Z=33). A scond semiconductor Y is made by dopping germanium with indium (Z=49). The two are joined end to end and connected to a battery as shown. Which of the following statements is correct?
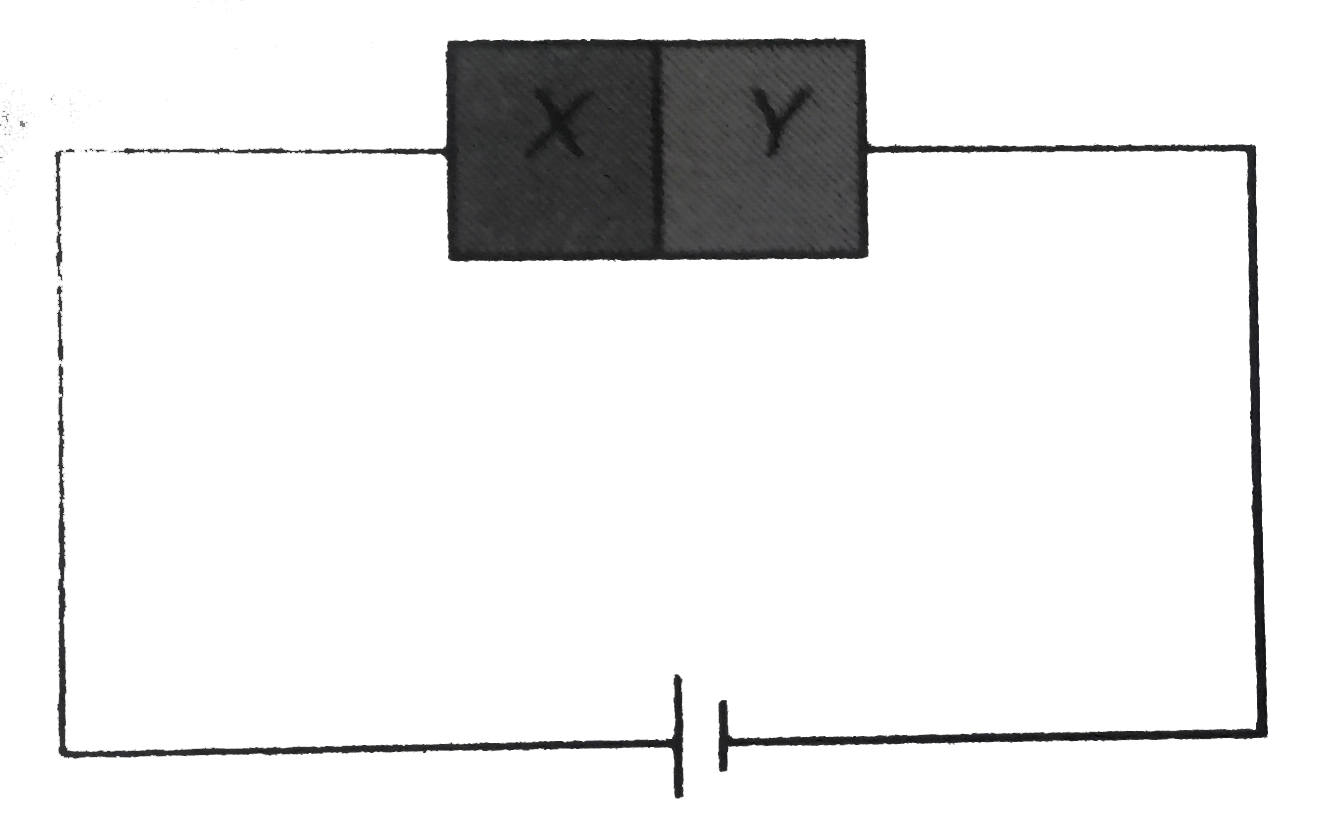 AX is P-type and the junction is forward biasedBX is N-type, Y is P-type and the junction is forwards biasedCX is P-type, Y is N-type and the junction is reverse biasedDX is N-type, Y is P-type and the junction is reverse biase
Two sides of a semiconductor germanium crystal A and B are doped with arsenic and indium respectively. They are connected to a battery as shown in figure.
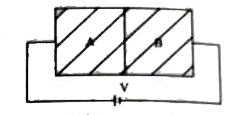
The correct graph between current and voltage for the arrangement is:A B
B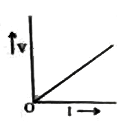 C
C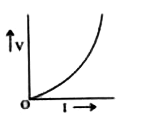 D
D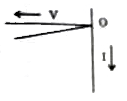
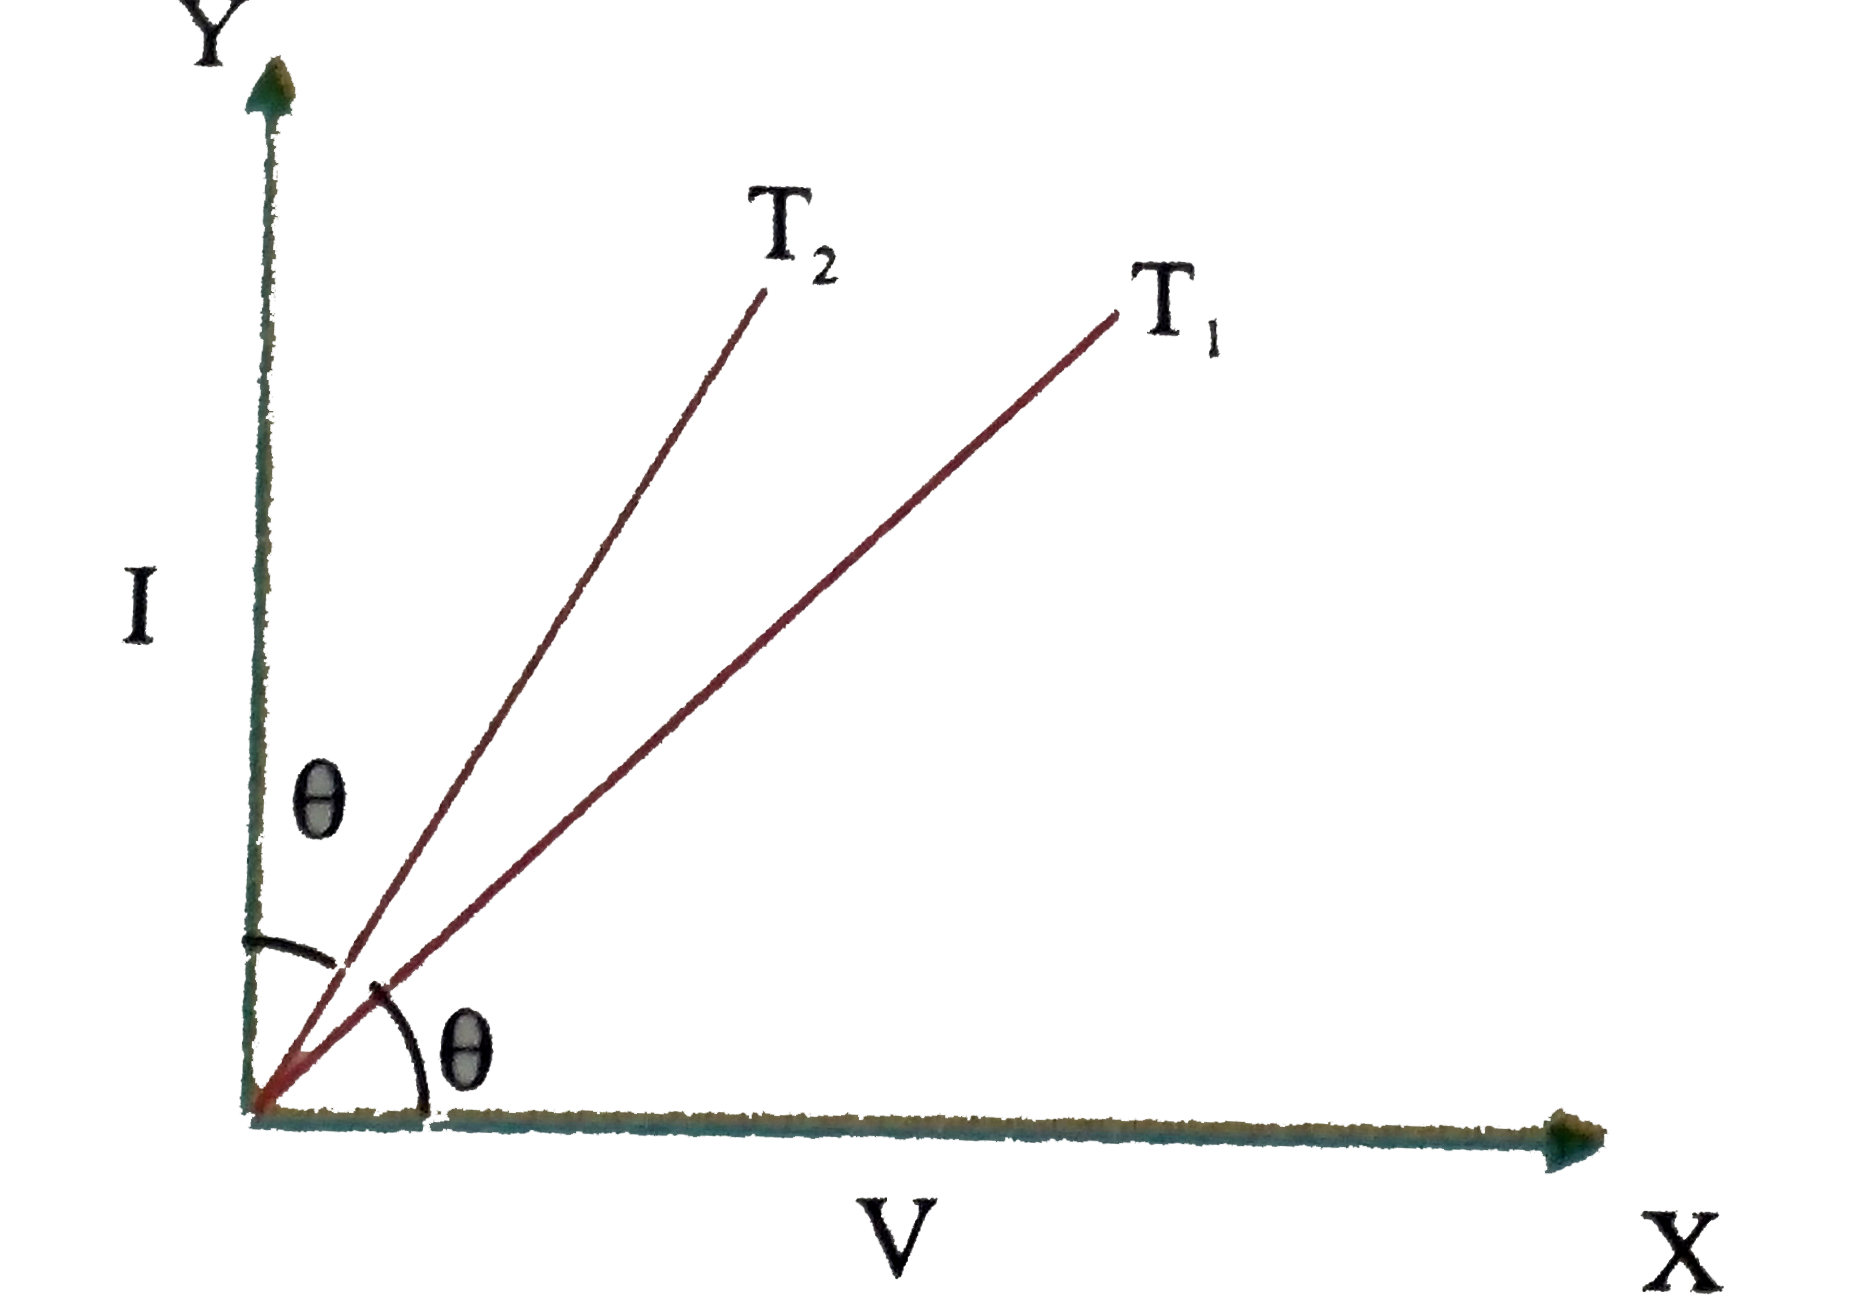
V−I graphs for a material is shown in the figure. The graphs are drawn at two different temperatures.AT1−T2∝cot2θBT1−T2∝sin2θCT1−T2∝tan2θDT1−T2∝cos2θ
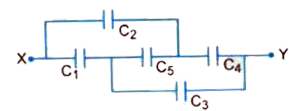
Find the equivalent capacitance of the network shown in the fig , when each capacitor is of 1 μF . When the ends X and Y are connected to a 6 V battery , find out (i) the charge and (ii) the energy stored in the network
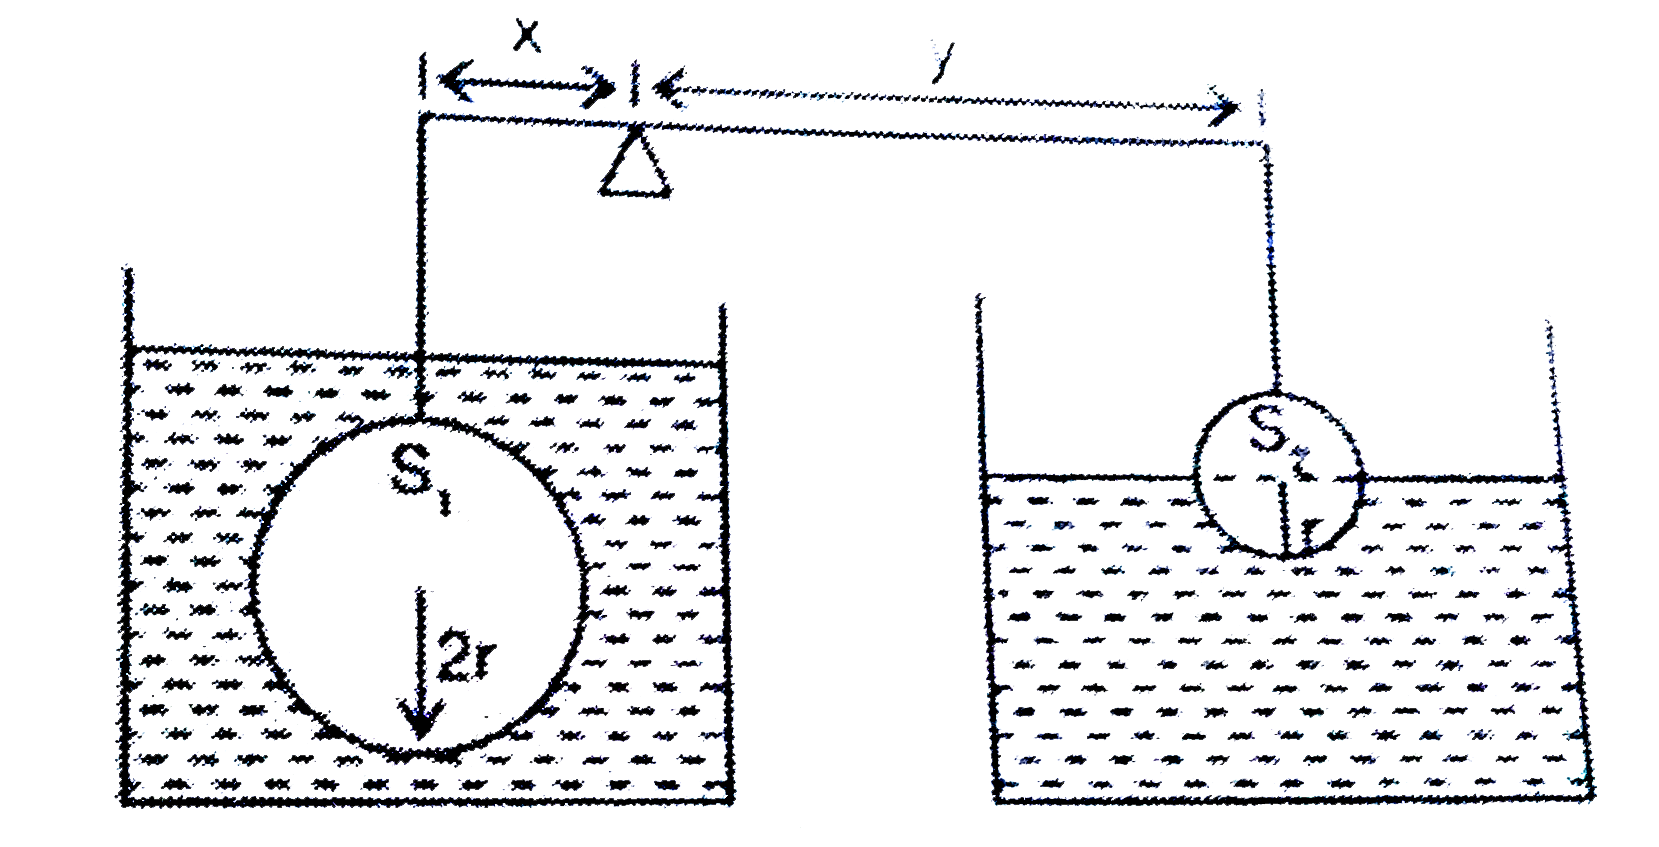
View SolutionTwo sphere S1andS2 made of the same material and having radii 2r and r, respectively, are immersed in water and suspended from either end of a beam as shown in figure.
The beam is in equilibrium when x:y=1:3 Determine the density of the object.
View SolutionTwo rods of material, x and two of y are connected as shown in the figure. All the rods are indentical in length and cross-sectional area. If the end A is maintained at 80∘C and the end D is maintained at 10∘C, calculate the temperature of the junctions B and C in the steady state. Thermal conductivity of x is double that of y.

View SolutionTwo rods of same material and thickness are joined as shown below. The ends X and Y are maintained at X∘C and Y∘C respectively. The ratio of the heat flow in the two rods is –

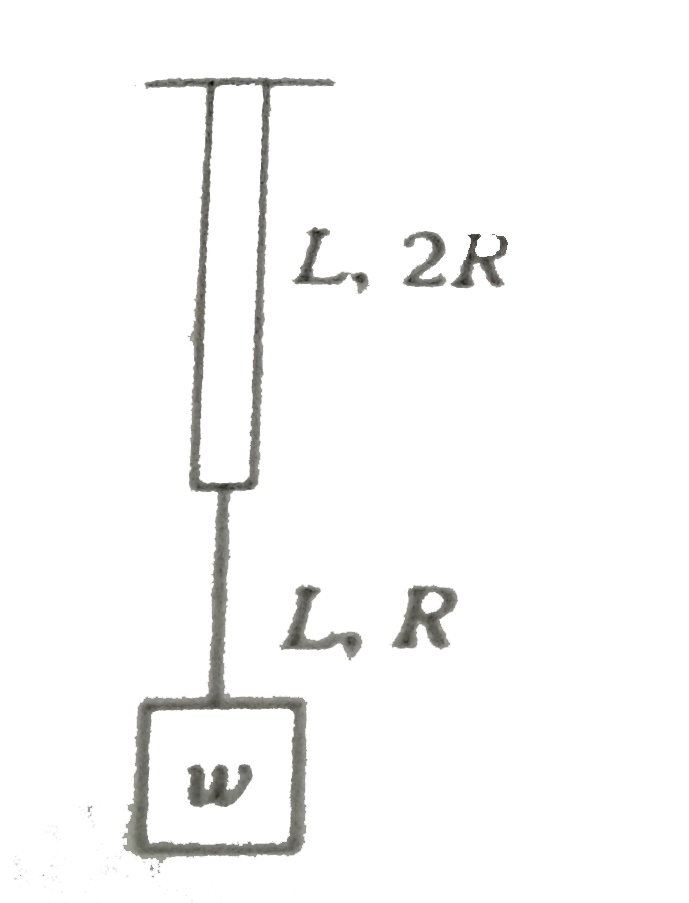
View SolutionTwo wires of the same material (Young's modulus=Y) and same length L but radii R and 2R respectively are joined end to end and a weight w is suspended from the combination as shown in the figure. The elastic potential energy in the system is
View Solution