The graph shows the behaviout of a length of wire in the region for which the substance obeys Hook's law. D and Q represent
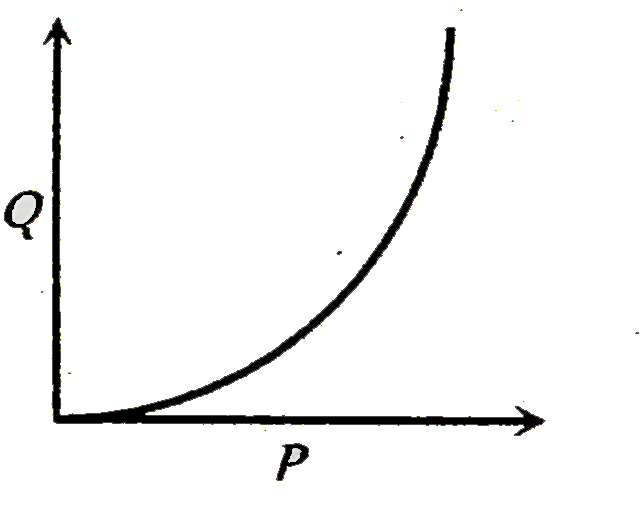
P = applied force, Q = extension
P = extension, Q = applied force
P = extension, Q= stored elastic energy
P = stored elastic energy, Q = extension
The correct Answer is:C
Step by step video, text & image solution for The graph shows the behaviout of a length of wire in the region for which the substance obeys Hook's law. D and Q represent by Physics experts to help you in doubts & scoring excellent marks in Class 11 exams.
Updated on:21/07/2023Topper's Solved these Questions
- ELASTICITYBOOK - ERRORLESS CHAPTER - ELASTICITYEXERCISE - Assertion and Reason
12 Videos
- ELASTICITYBOOK - ERRORLESS CHAPTER - ELASTICITYEXERCISE - Self Evaluation Test
11 Videos
- ELASTICITYBOOK - ERRORLESS CHAPTER - ELASTICITYEXERCISE - Critical Thinking
8 Videos
- FLUID MECHANICSBOOK - ERRORLESS CHAPTER - FLUID MECHANICSEXERCISE - Fluid Mechanics
19 Videos
Similar Questions
The graph in Fig. 11.8 shows the variation of elongation with tensile force for two wires P and Q.
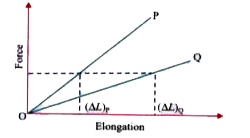
If P and Q are of the same material and have the same length, which one has a greater area of cross section ?
View SolutionThe given graph shows the heating curve for a pure substance. The temperature rises with time as the substance is heated :
(a) What is the physical state of the substance at the points A, B, C and D ?
What is the melting point of the substance ?
(c ) What is its boiling point ?
(d) What happens to the temperature while the substance is changing state ?
(e ) The substance is not water. How can you judge from the graph ?
View Solution
Knowledge Check
The graph show the behaviour of a length of wire in the region for which the substances obeys Hooke's law. P and Q represent
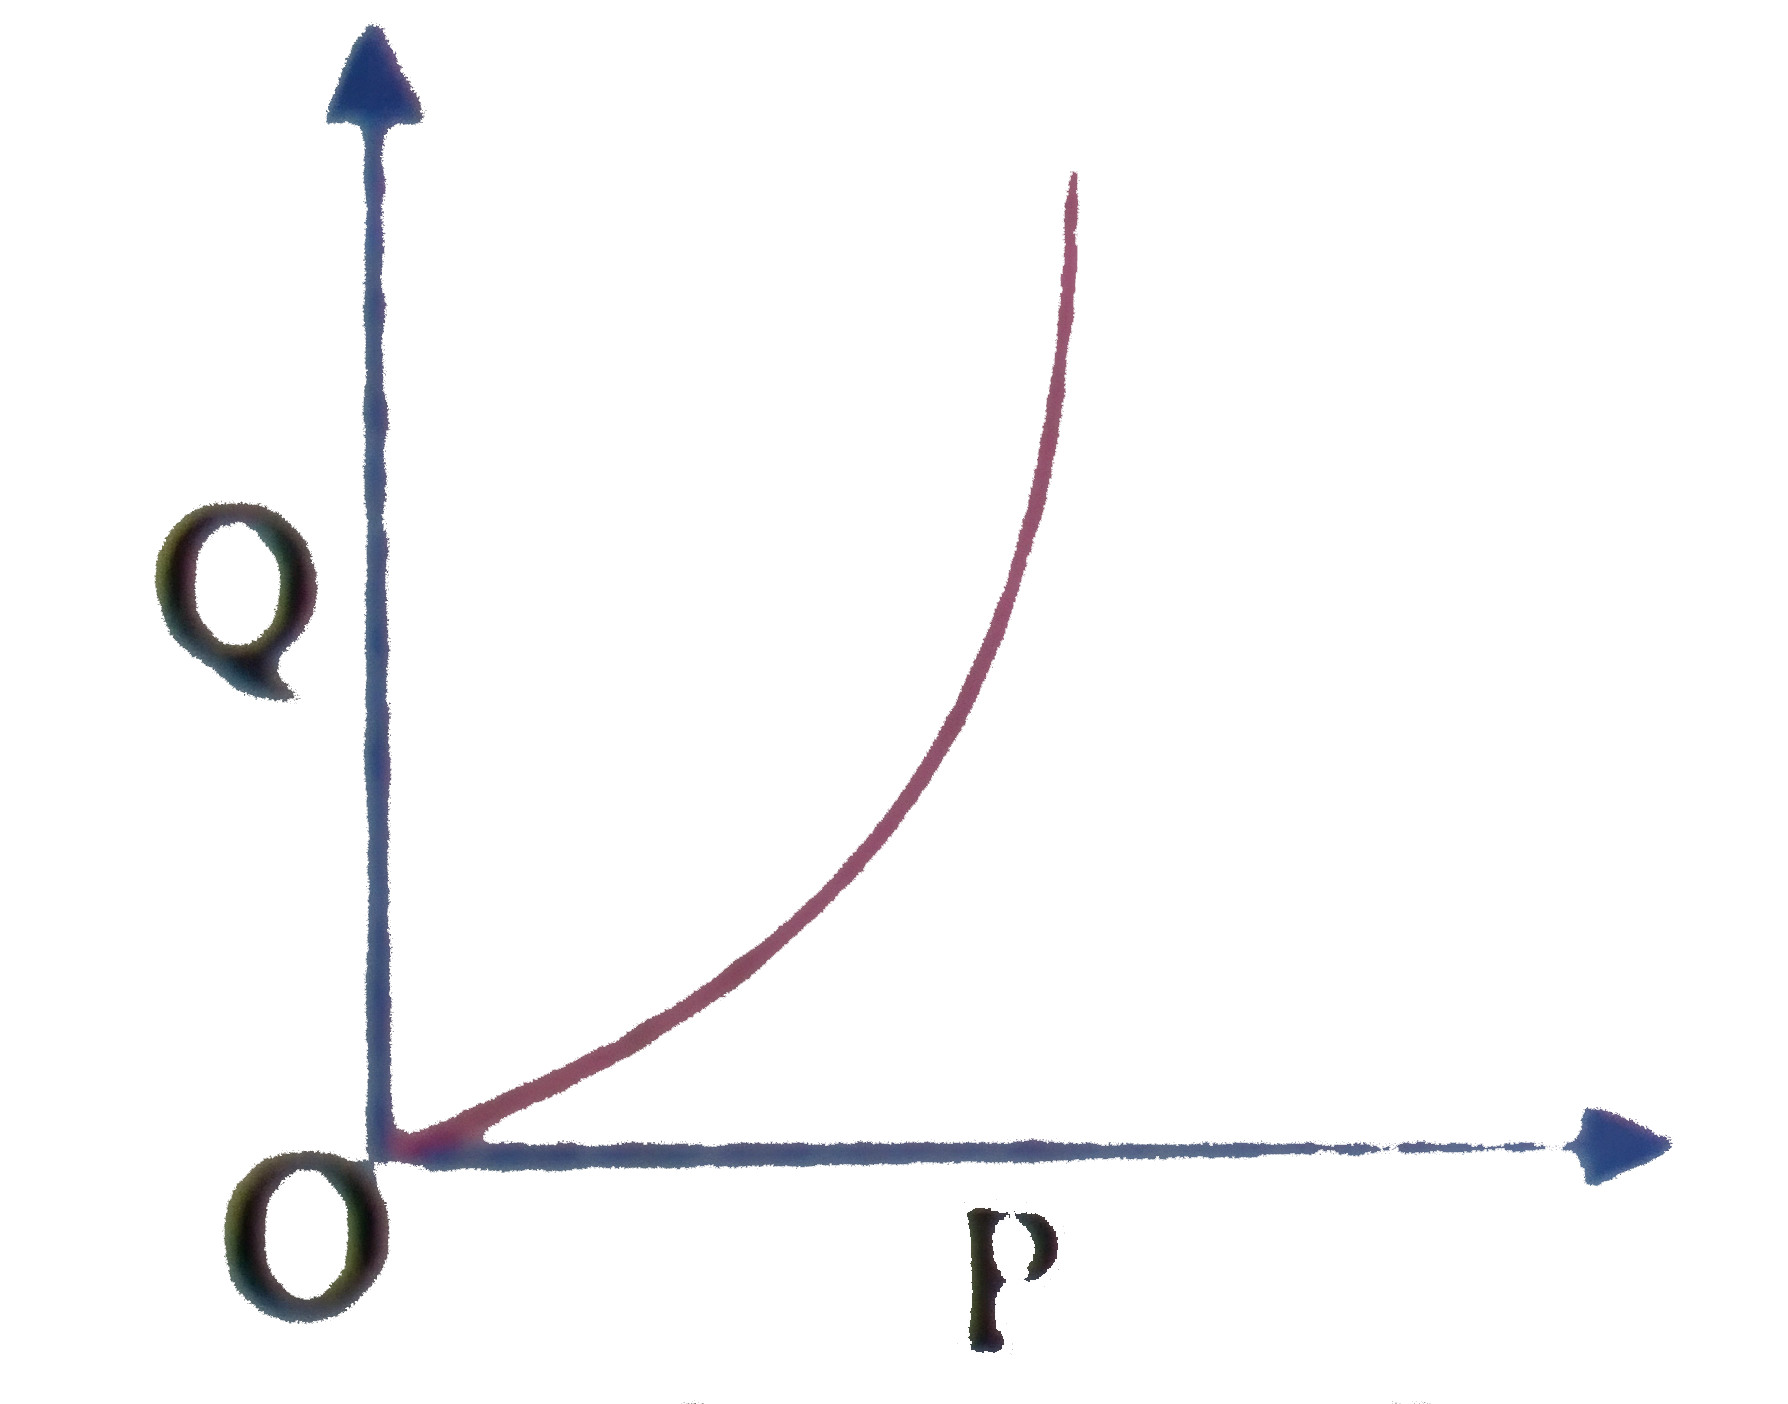 AP = applied force, Q = extensionBextension, applied forceCextension, stored elastic energyDstored elastic energy, extension
The graph shows the behaviour of a steel wire in the region for whoch the wire obeys Hooke's law. The graph is a parabola. The variables X and Y -axes, respectively can be [ stress (σ),strain (ε) and elastic potential energy(U) ]
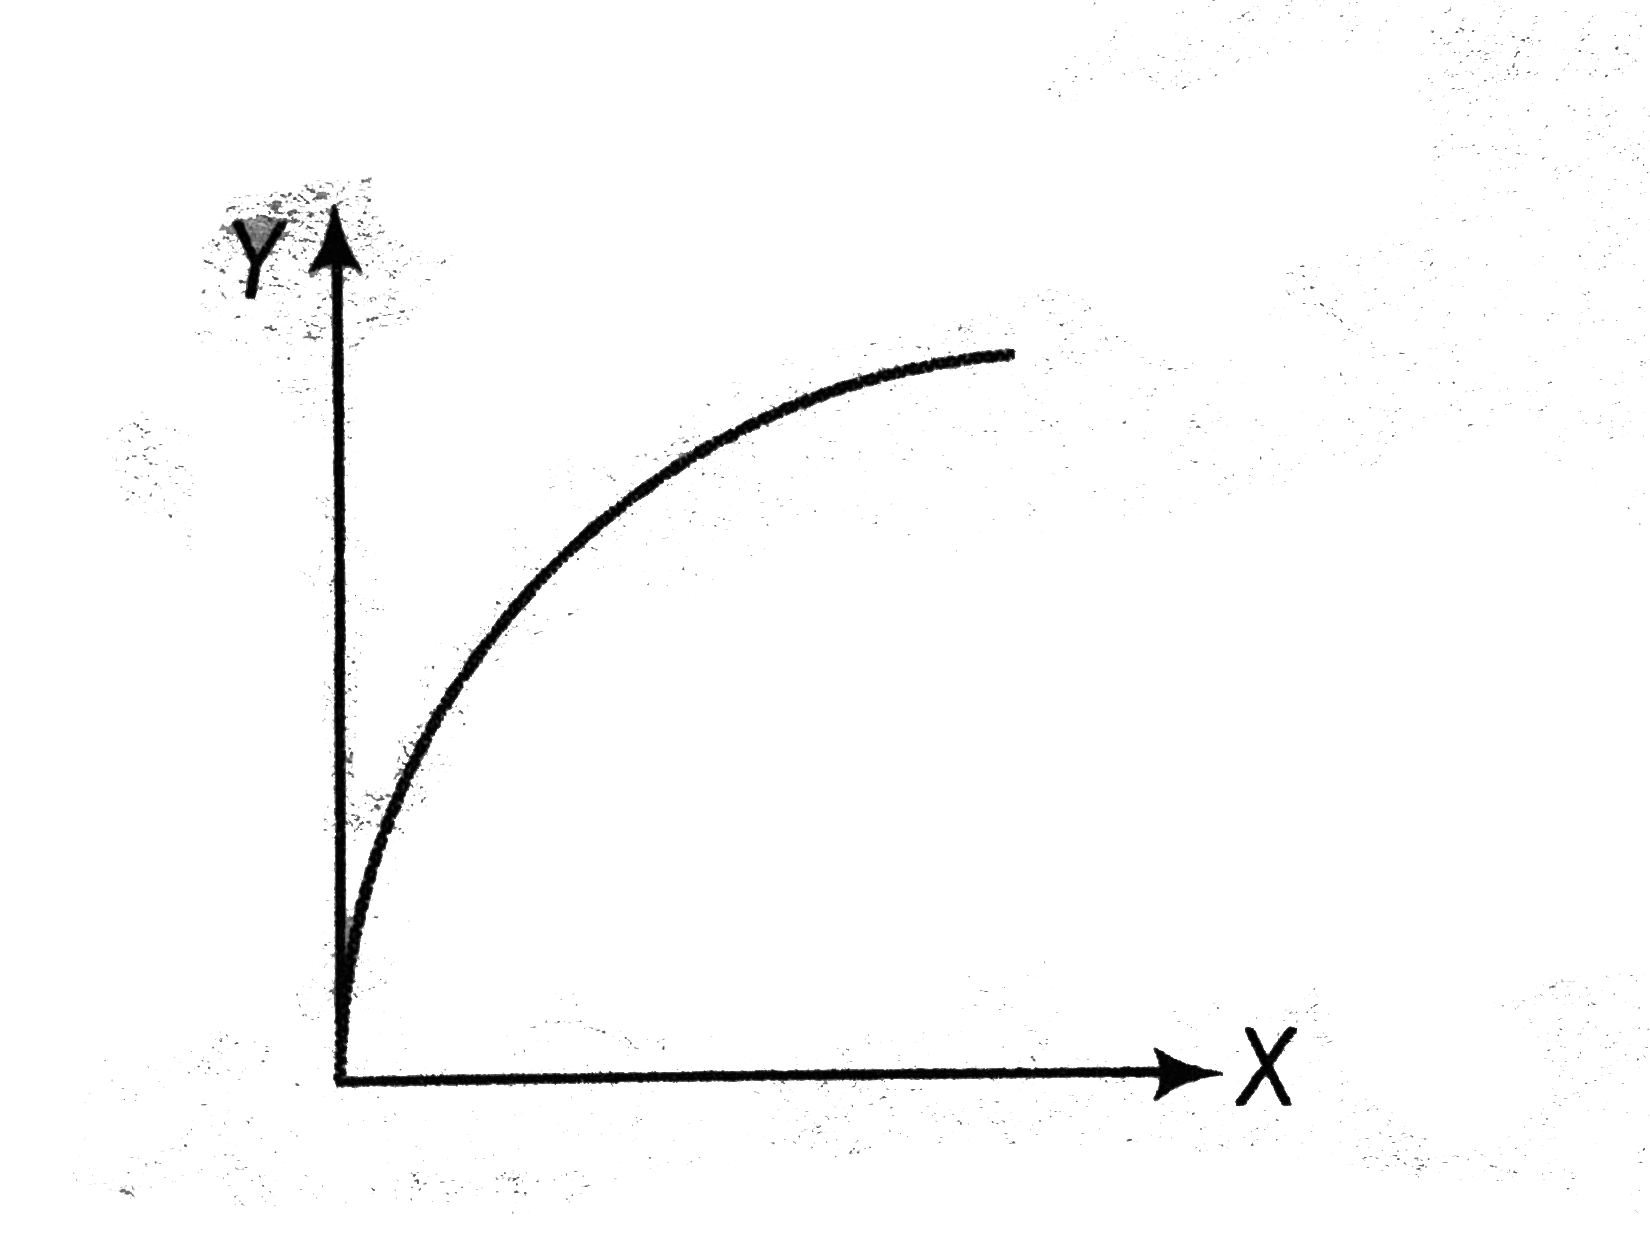 AA) U,σBB) U,εCC) σ,εDD) None of these
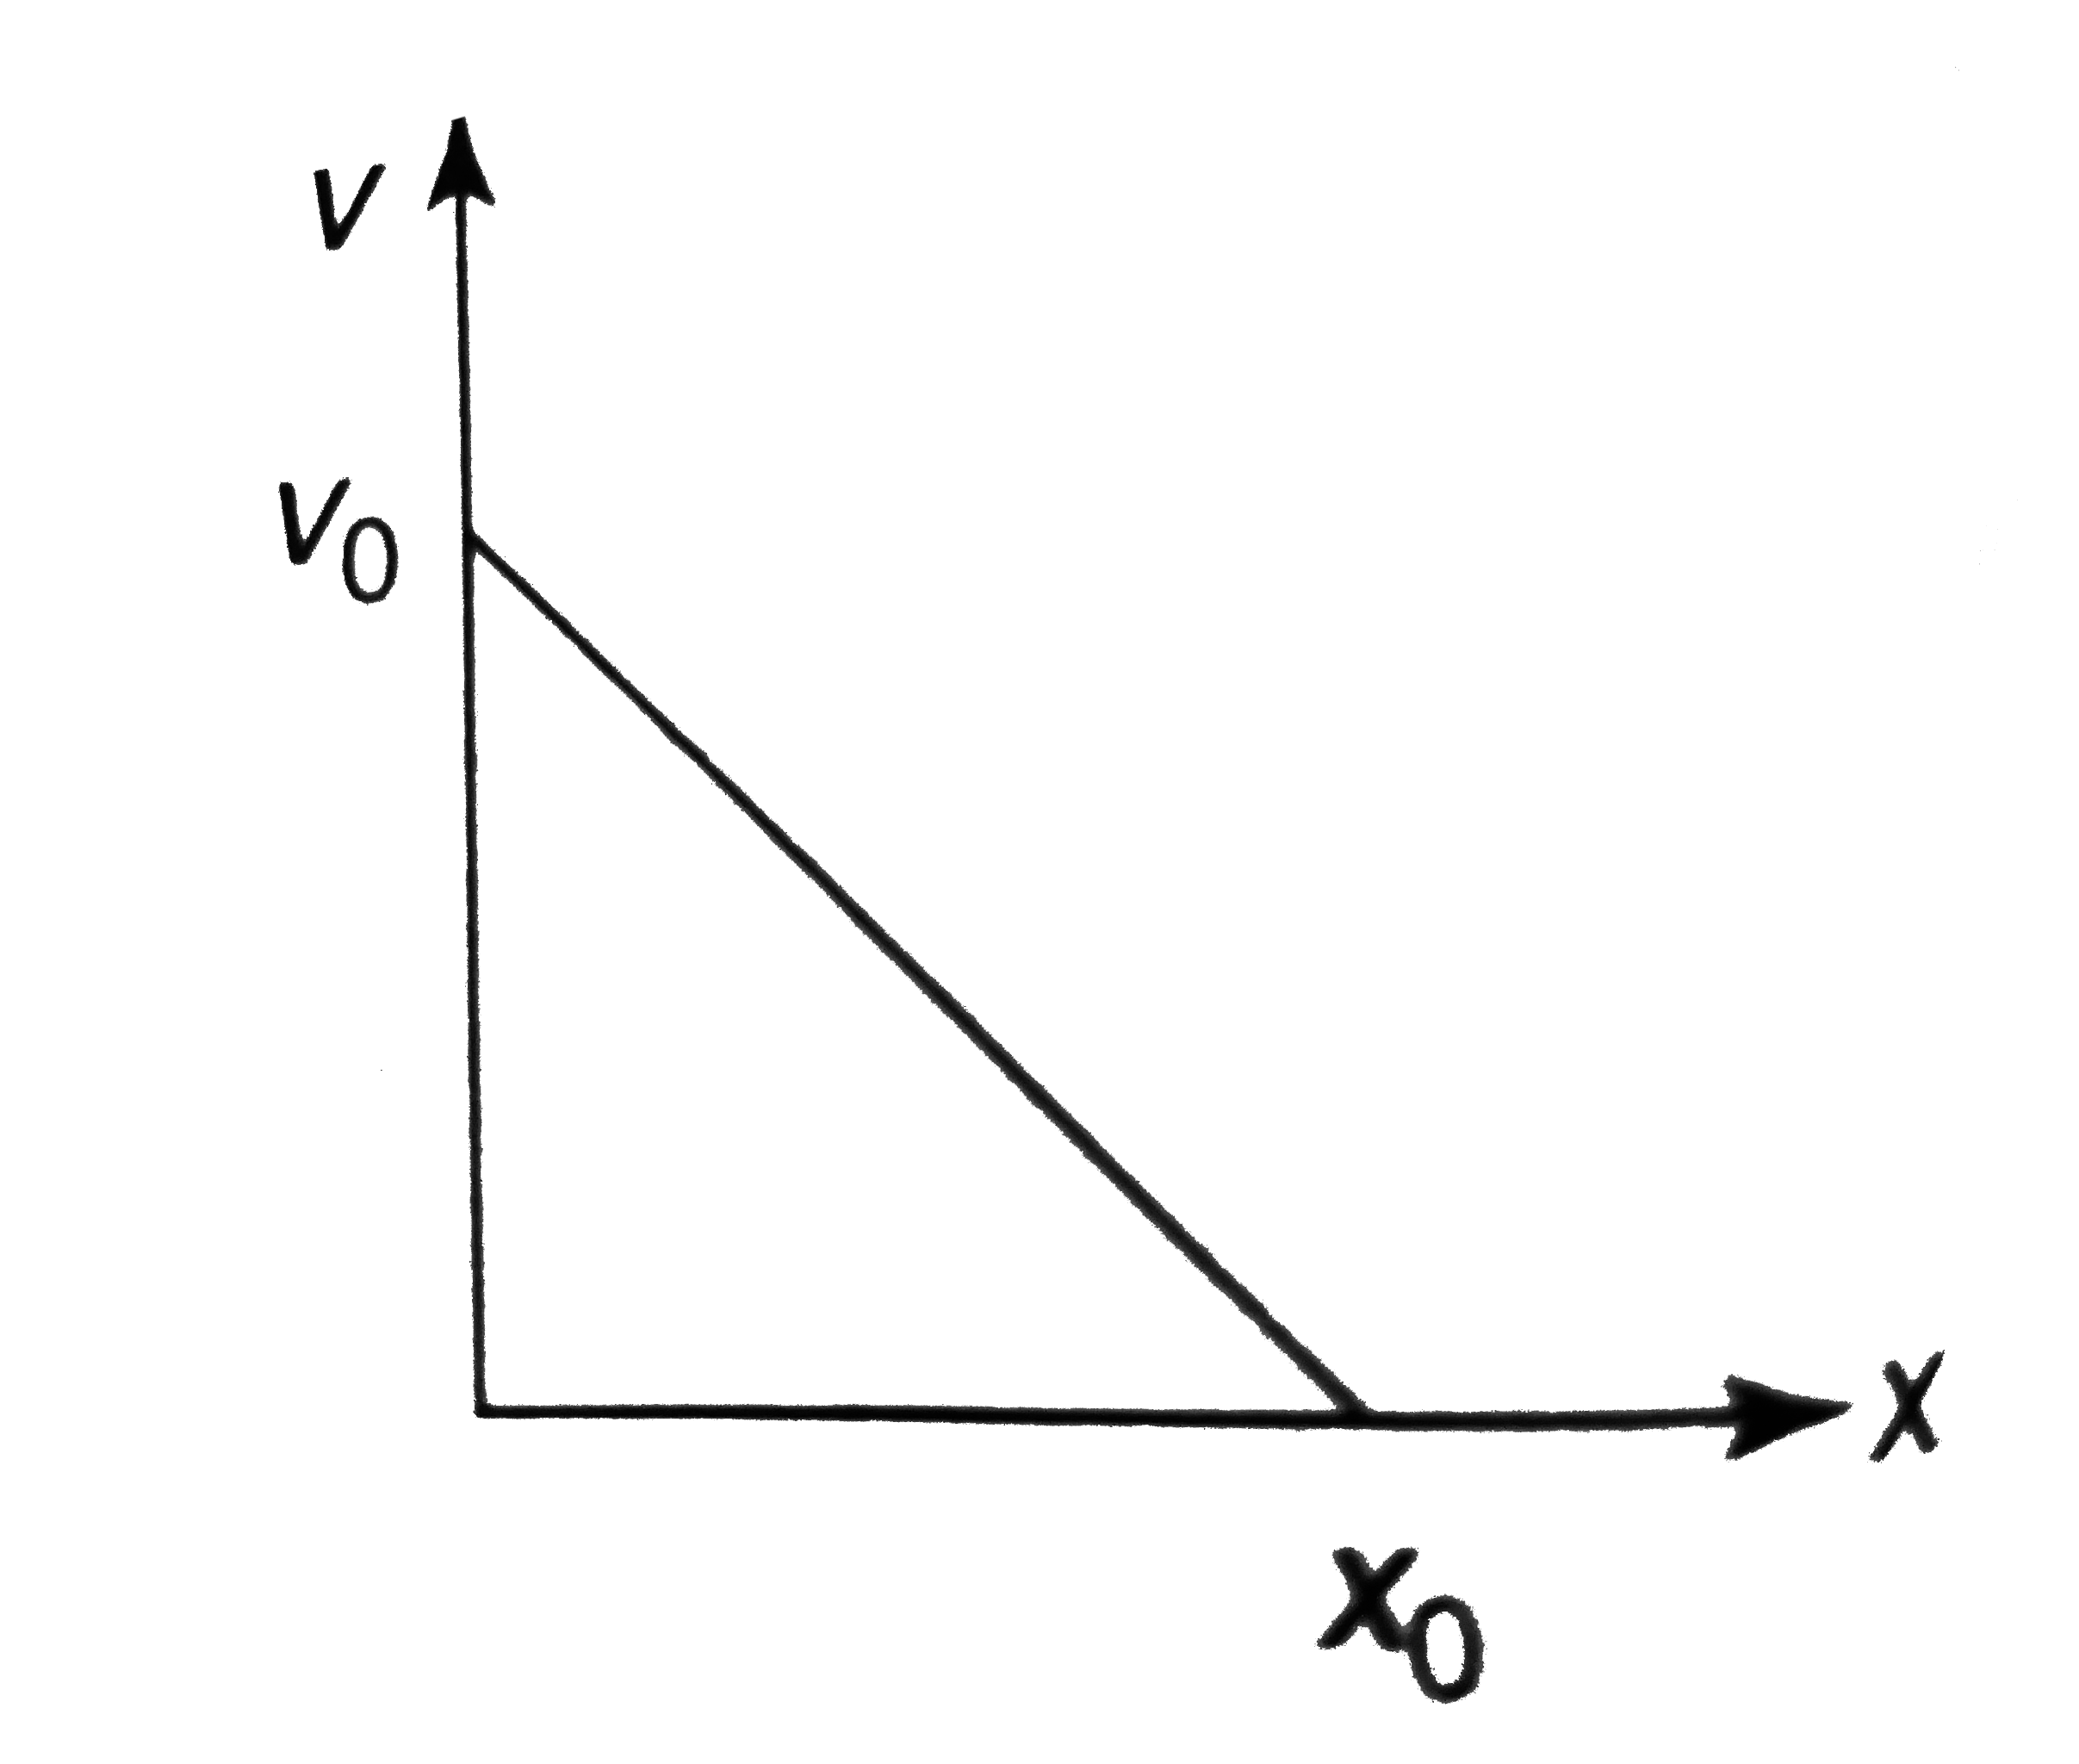
The given graph shows the variation of velocity with displacement. Which one of the graphs given below correctly represents the variation of acceleration with displacement ?
 A
A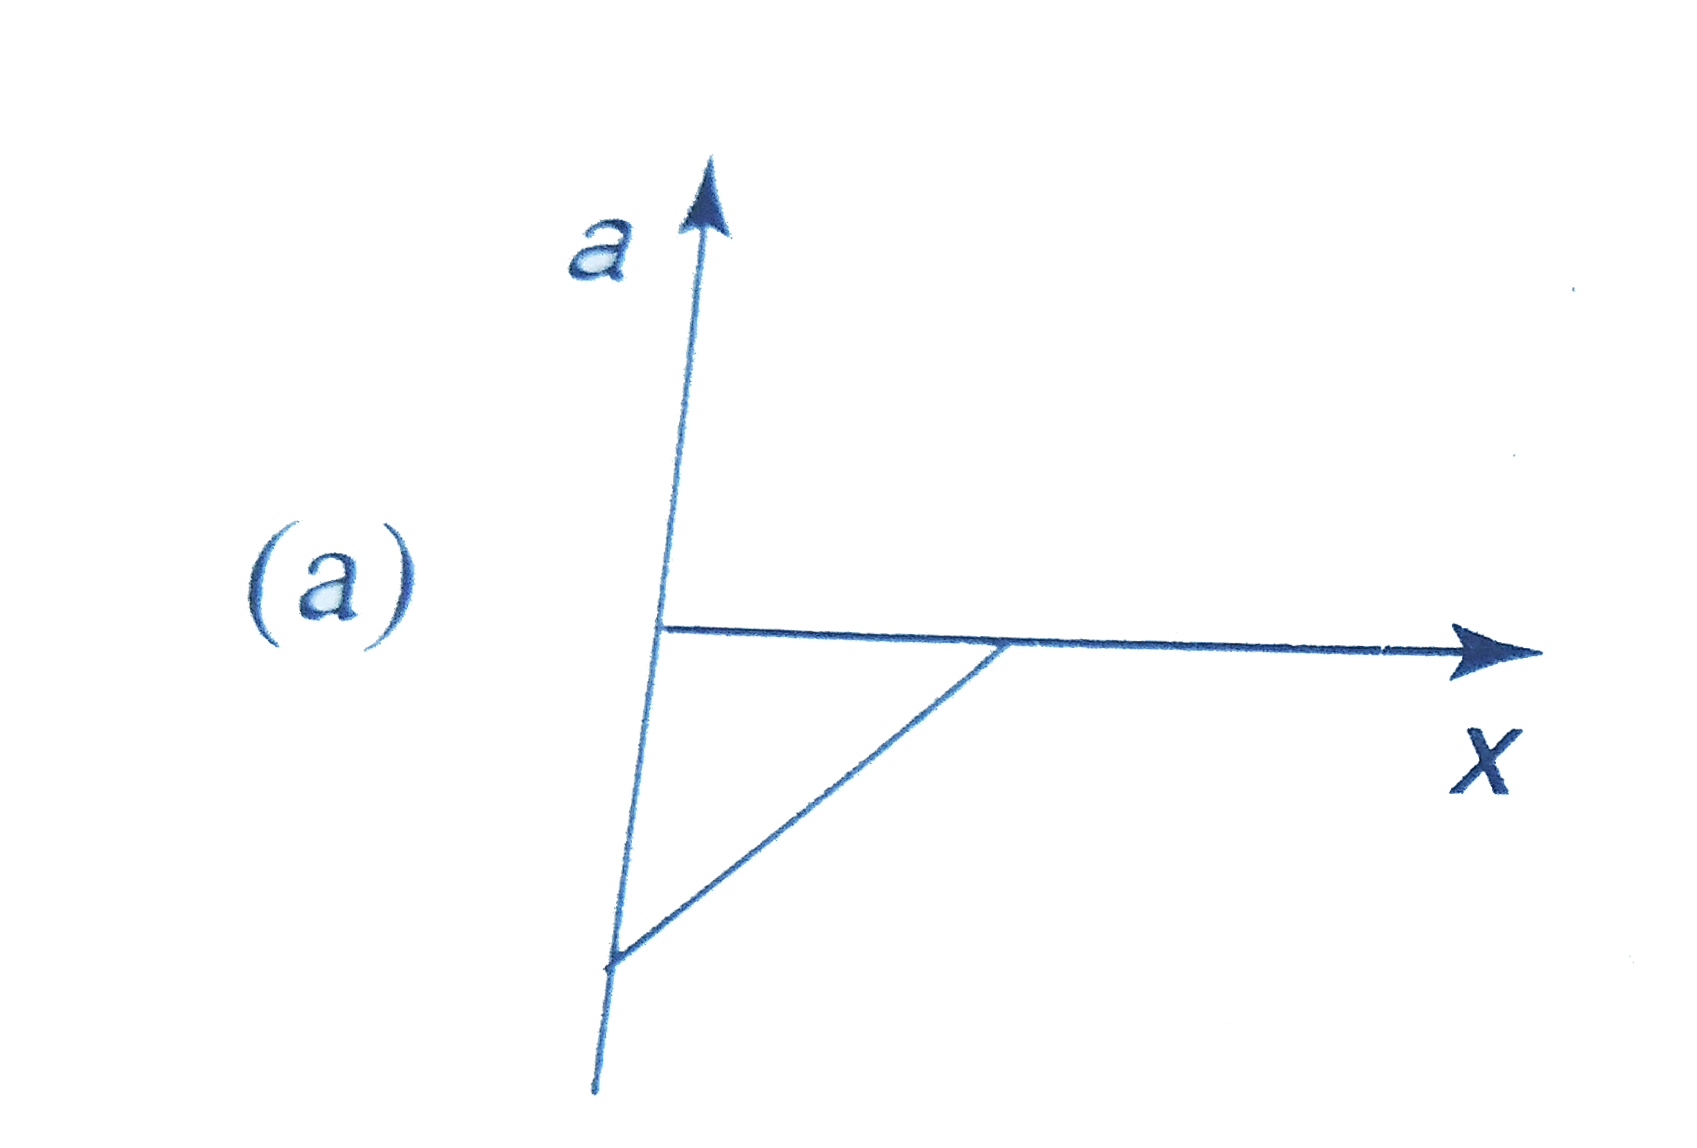 B
B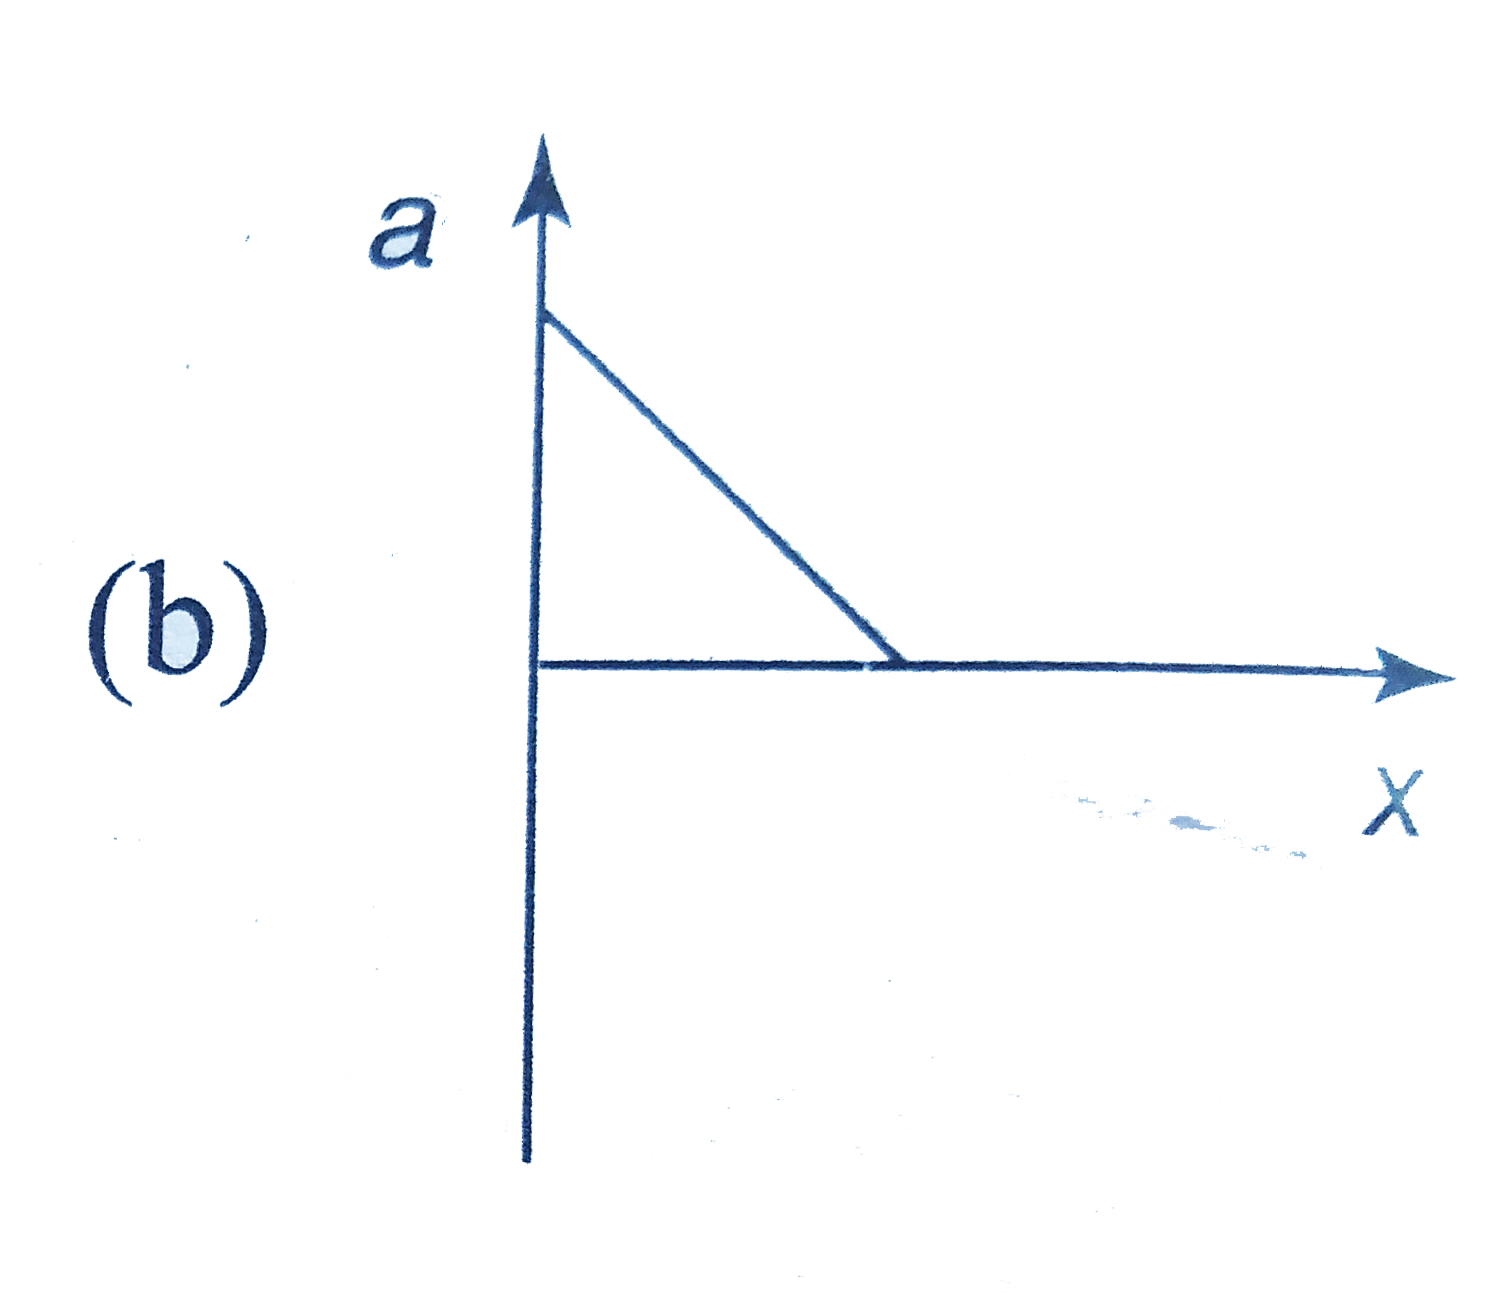 .C
.C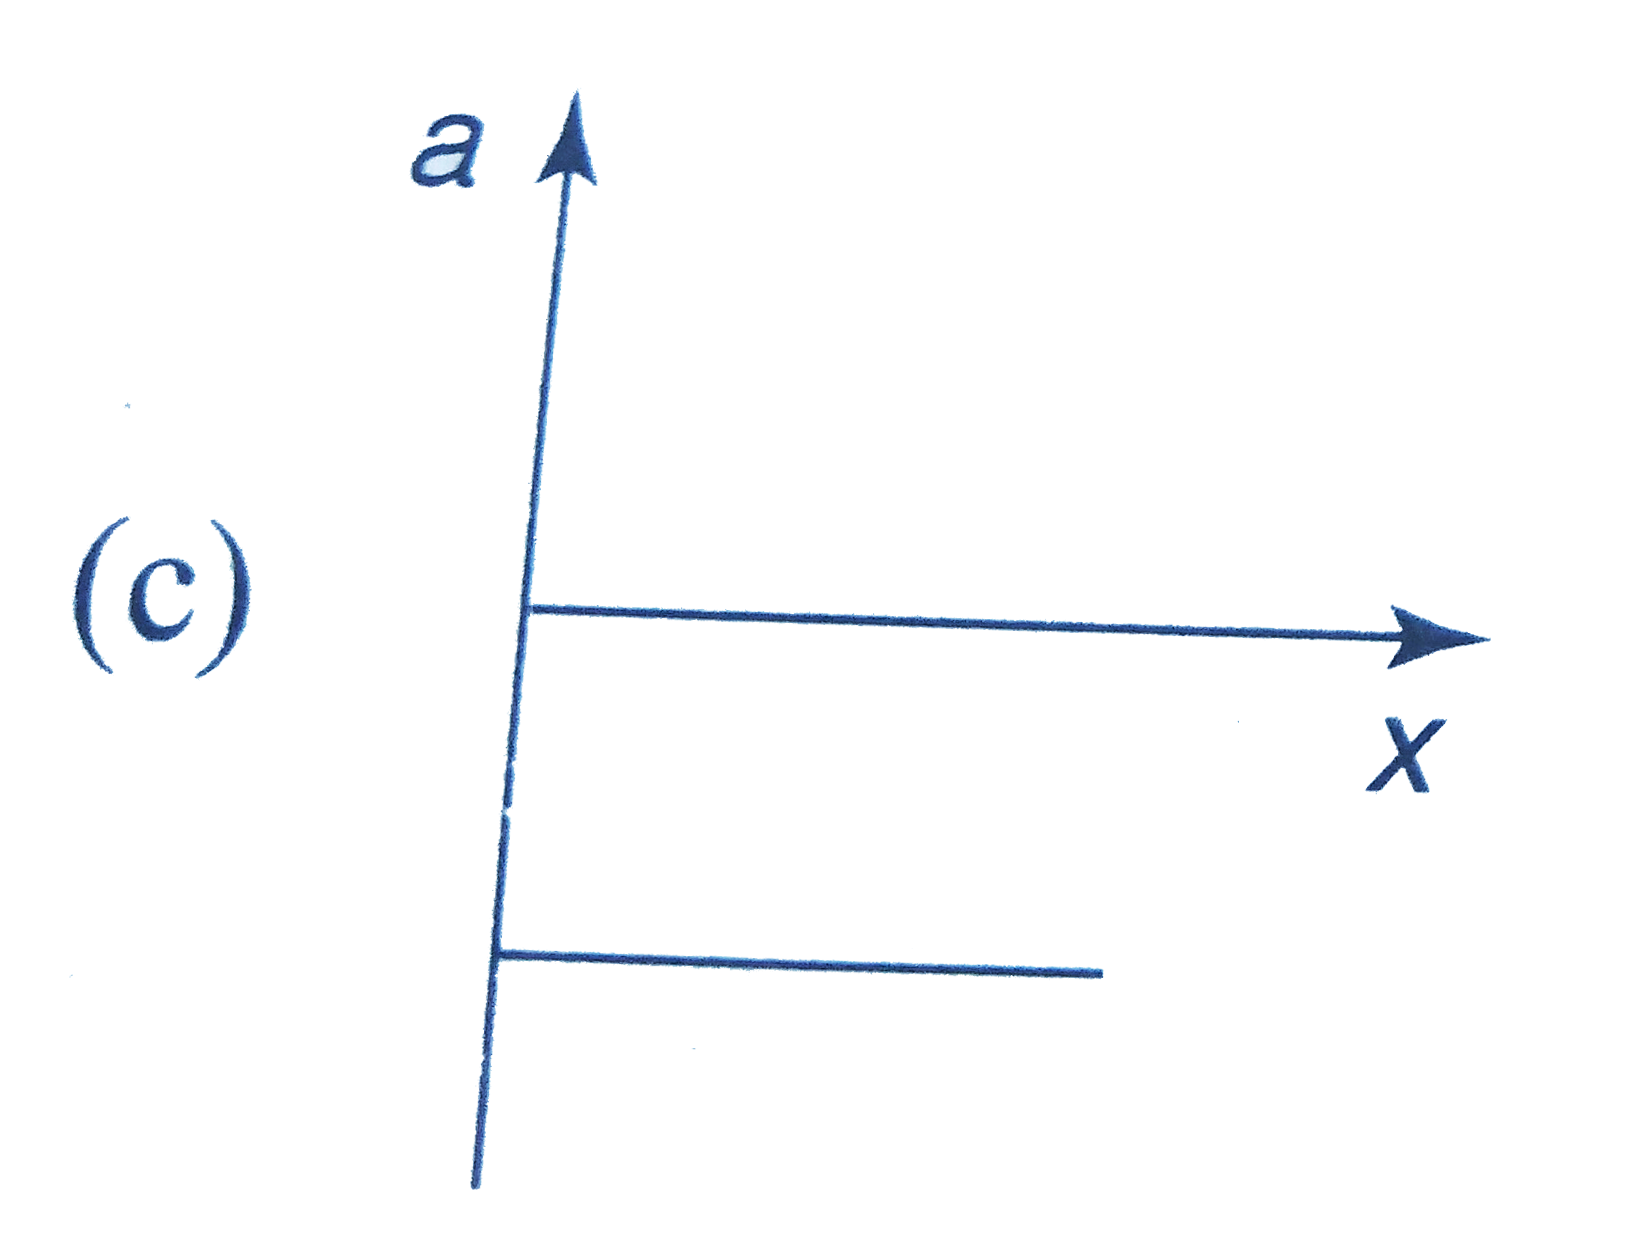 .D
.D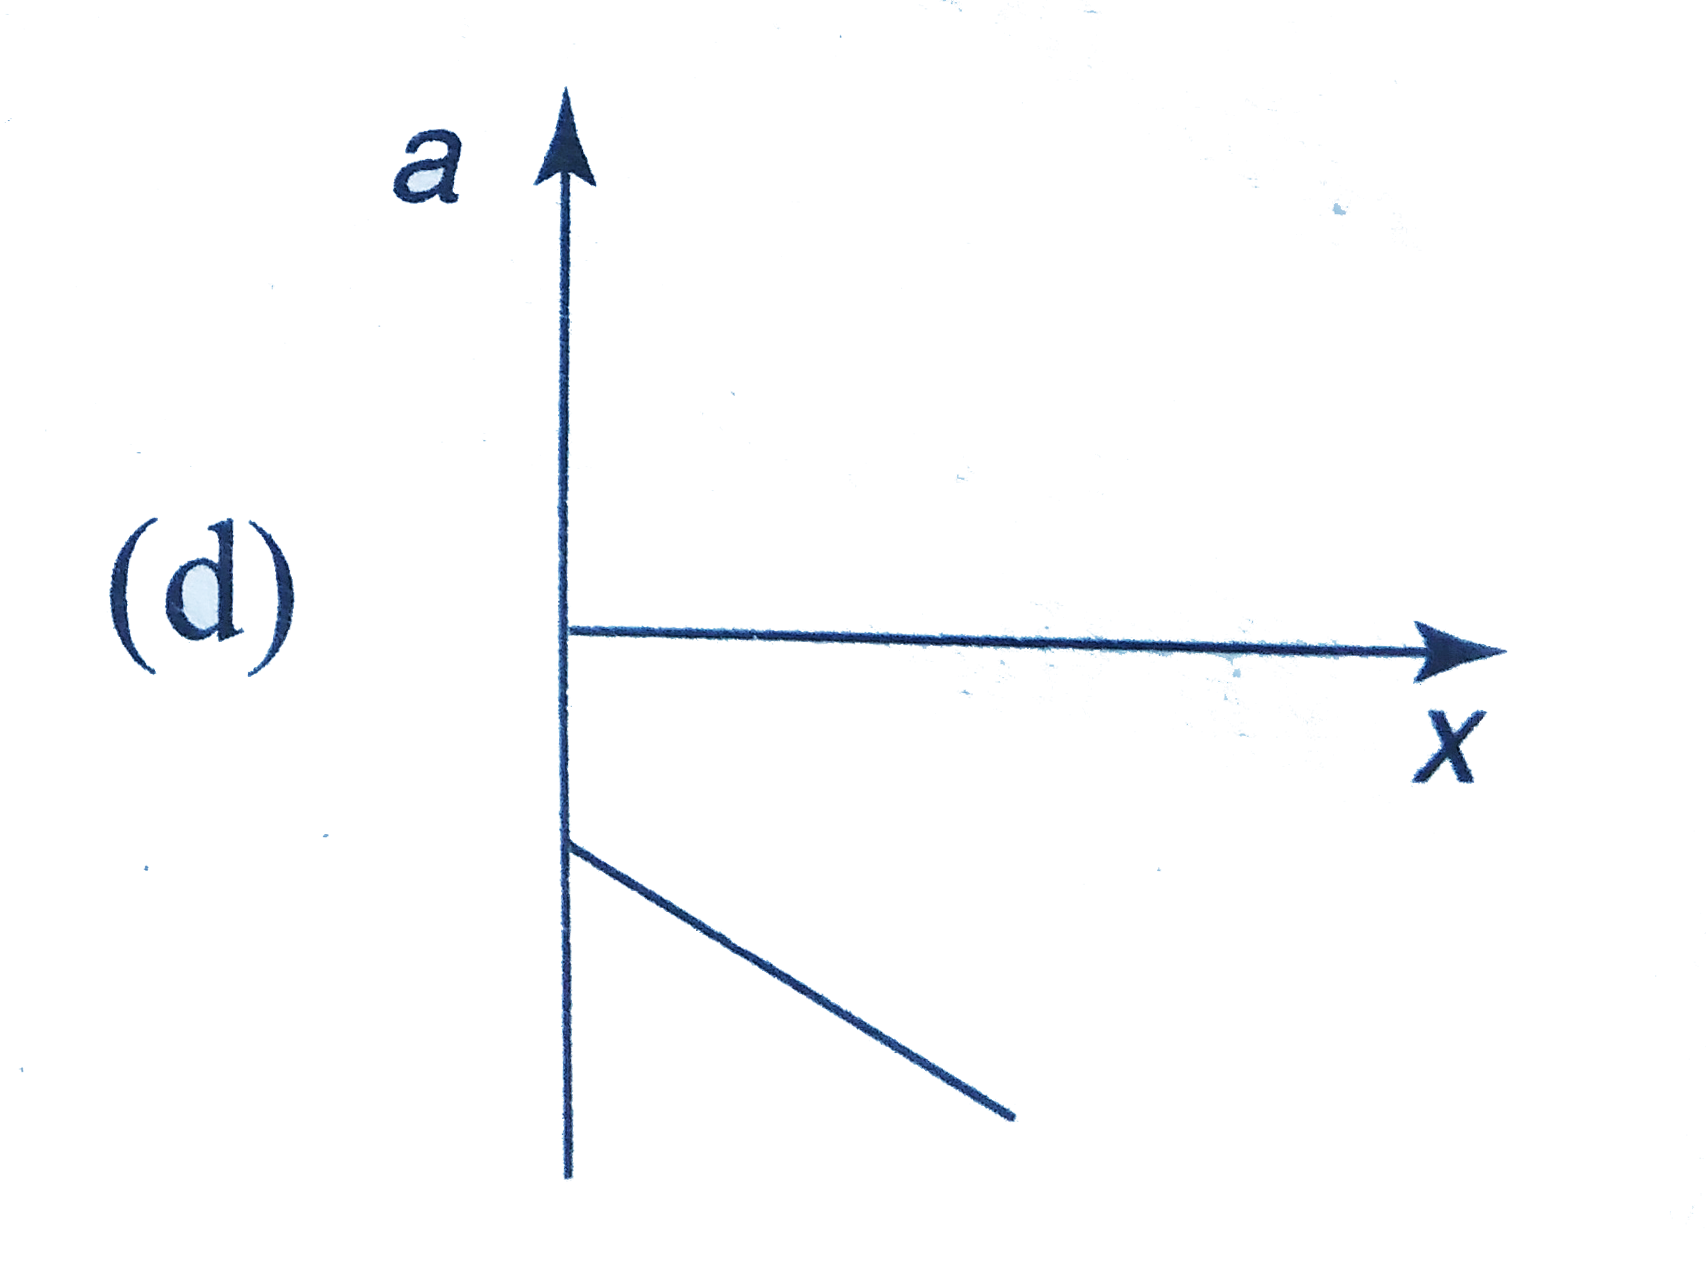 .
.
Draw the variation of potential energy and kinetic energy of a block attached to a spring, which obeys Hooke's law.
View SolutionWhich of the following graphs shows the variation of magnetic induction B with distance r from a long wire carrying current
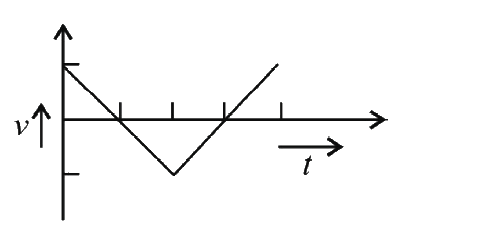
View SolutionThe graph in figure shows the velocity v versus time t for a body. Which of the graphs shown in figure represents the corresponding acceleration versus time graphs ?
View Solution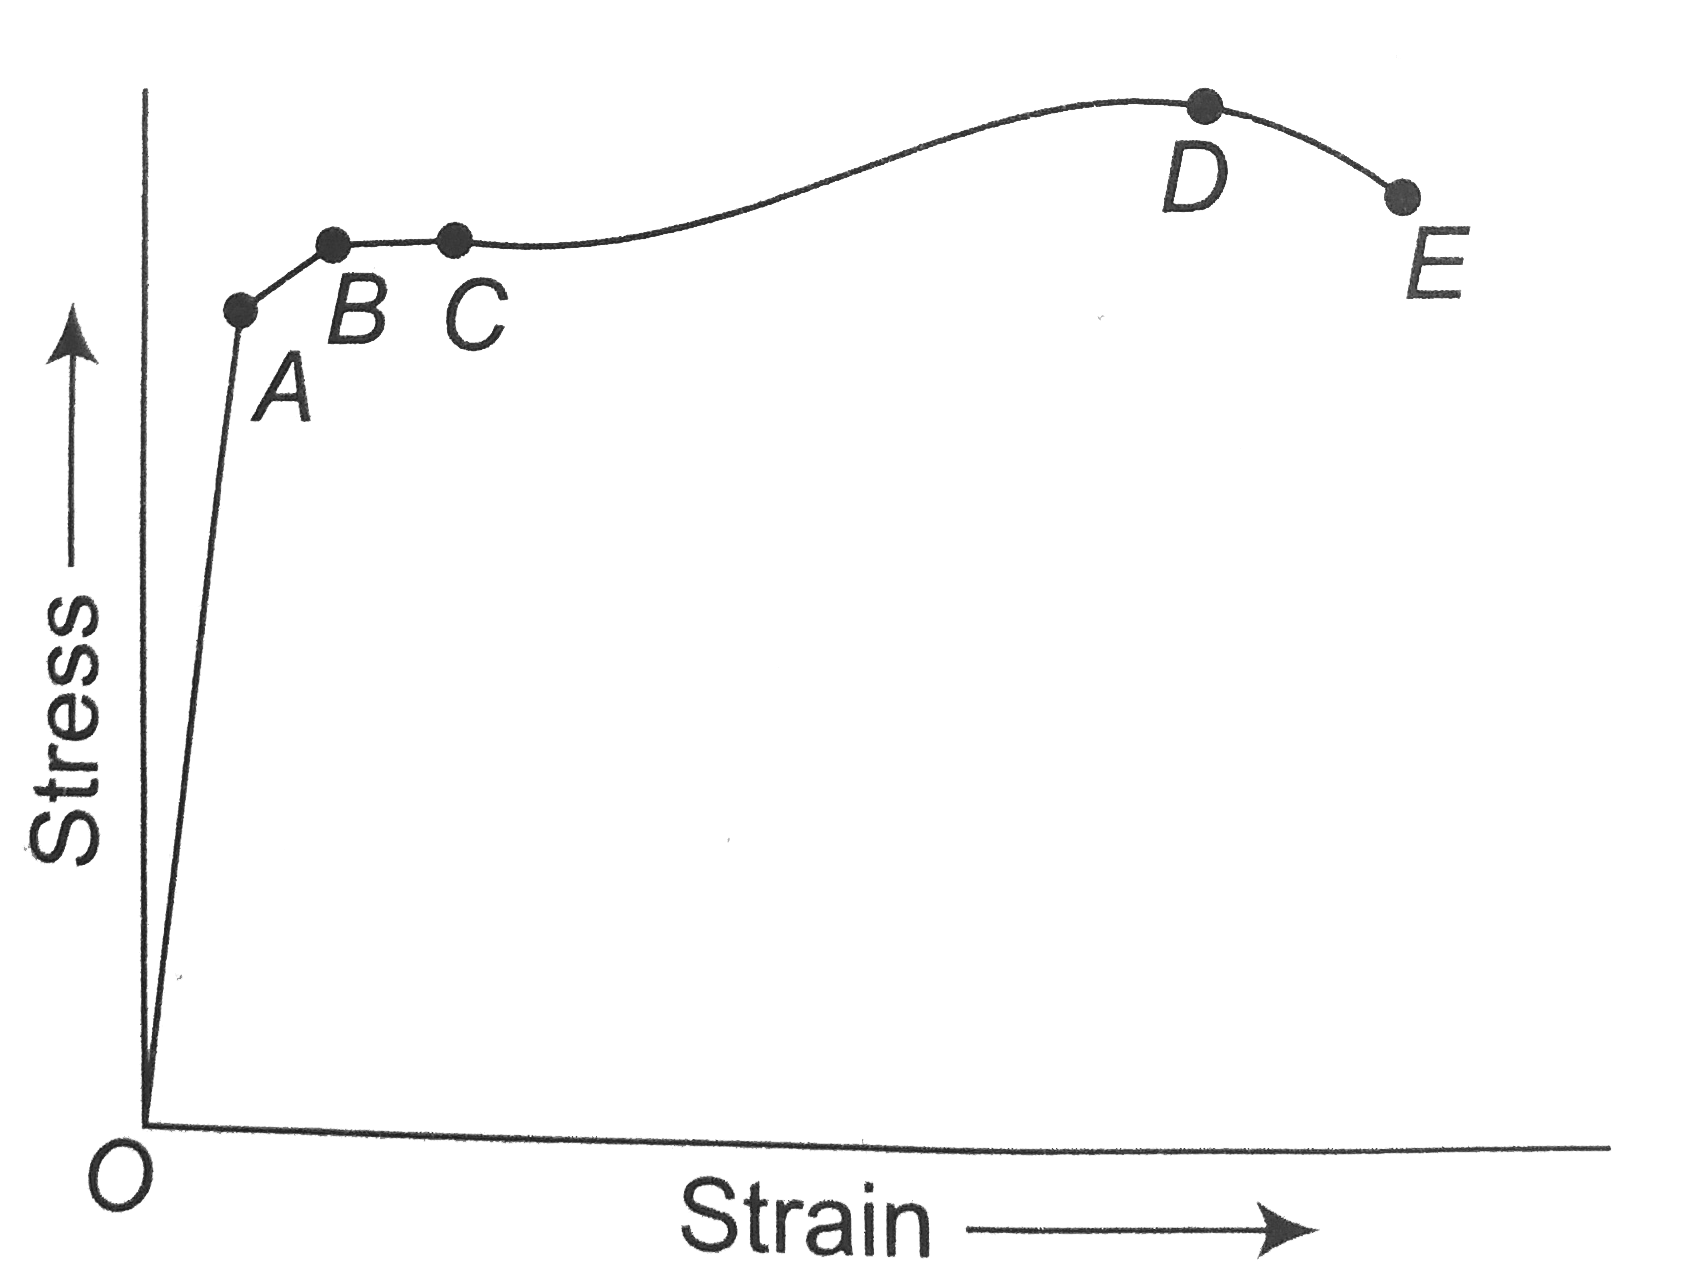
The stress strain graph for a metal wire is as shown in the figure. In the graph, the region in which Hooke's law is obeyed, the ultimate strength and fracture are represented by
View Solution_E01_007_Q01.png)
The load versus elongation graph for four wires of the same material and same length is shown in the figure. The hinnest wire is represented by the line
View Solution
