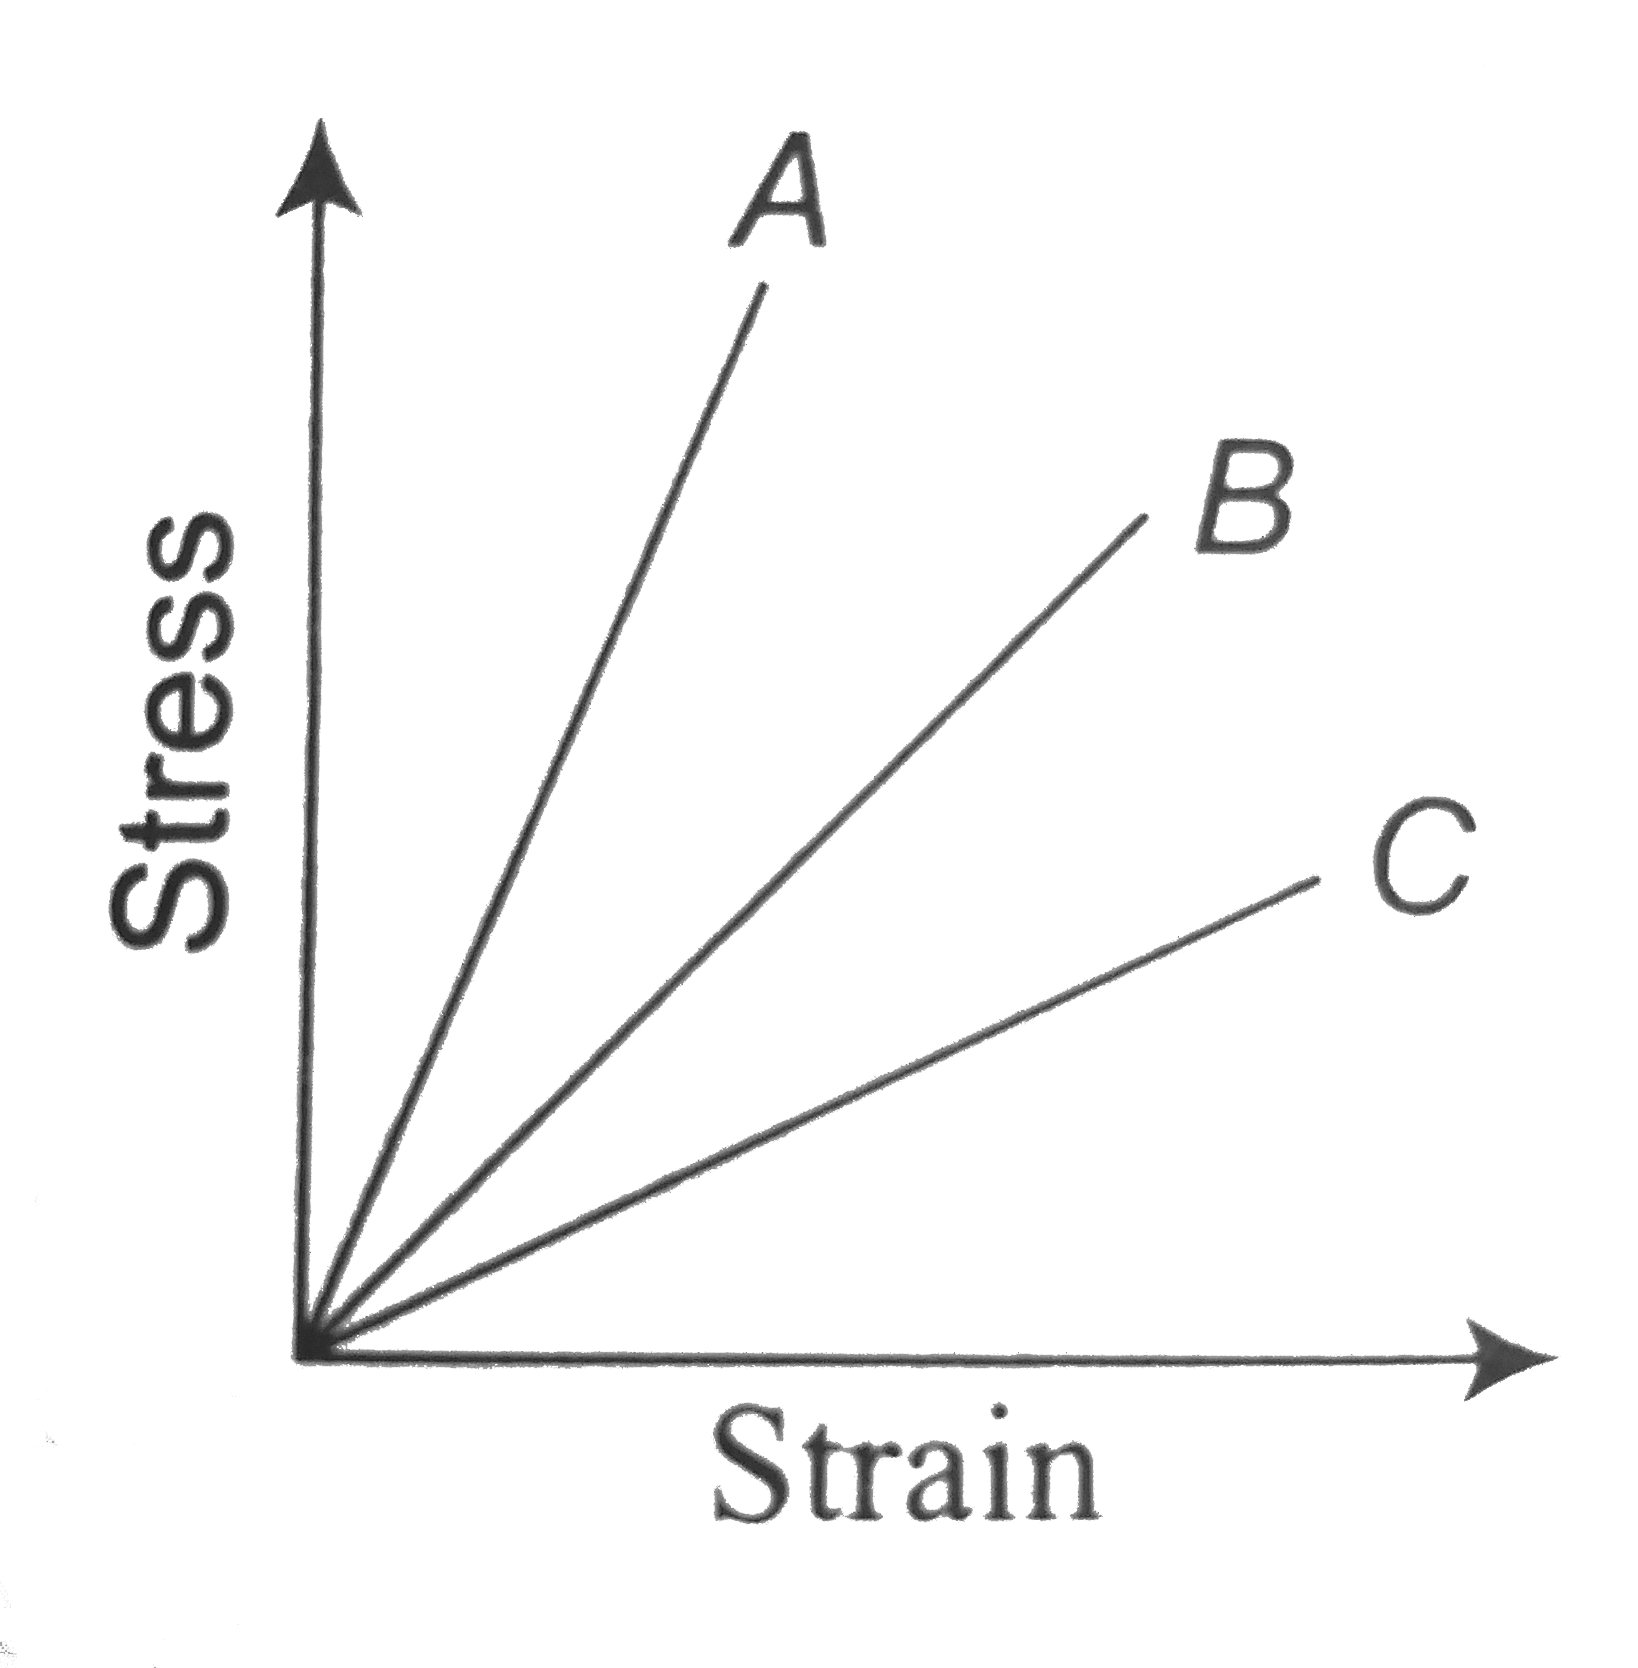
The stress strain curves for brass, steel and rubber are shown in the figure. The lines A, B and C are for
Rubber, brass and steel respectively
Brass, steel and rubber respectively
Steel, brass and rubber respectively
Steel, rubber and brass respectively
The correct Answer is:C
Step by step video, text & image solution for The stress strain curves for brass, steel and rubber are shown in the figure. The lines A, B and C are for by Physics experts to help you in doubts & scoring excellent marks in Class 11 exams.
Topper's Solved these Questions
- BOOK - ERRORLESS CHAPTER - ELASTICITYEXERCISE - Assertion and Reason12videos
ELASTICITY
- BOOK - ERRORLESS CHAPTER - ELASTICITYEXERCISE - Self Evaluation Test11videos
ELASTICITY
- BOOK - ERRORLESS CHAPTER - ELASTICITYEXERCISE - Critical Thinking8videos
ELASTICITY
- BOOK - ERRORLESS CHAPTER - FLUID MECHANICSEXERCISE - Fluid Mechanics19videos
FLUID MECHANICS
Similar Questions
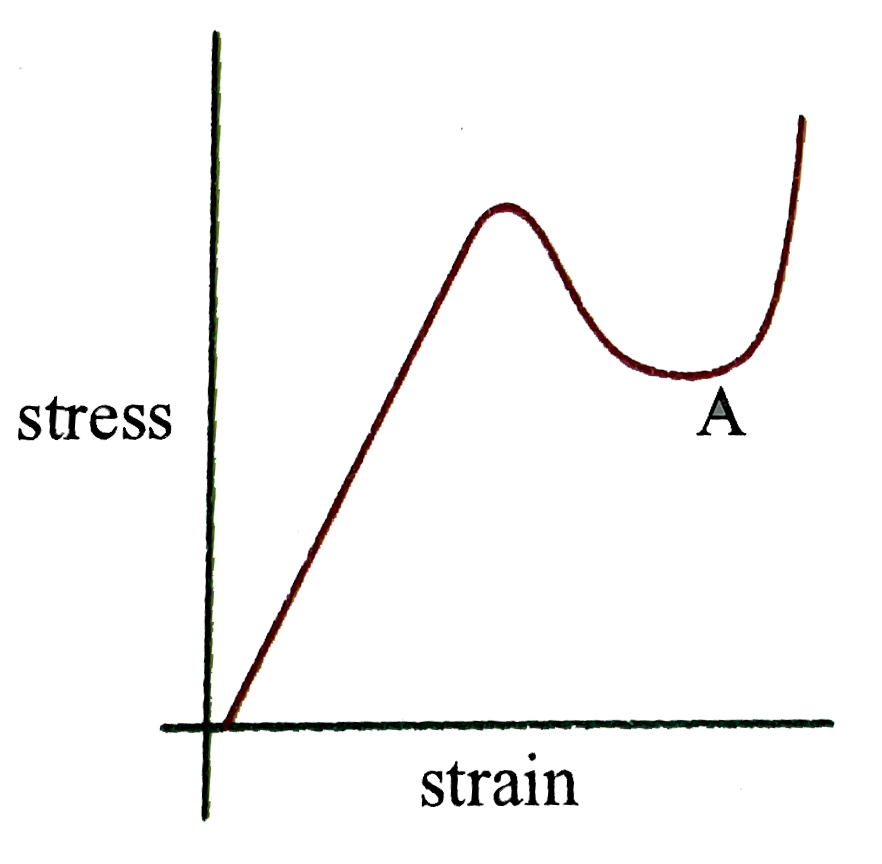
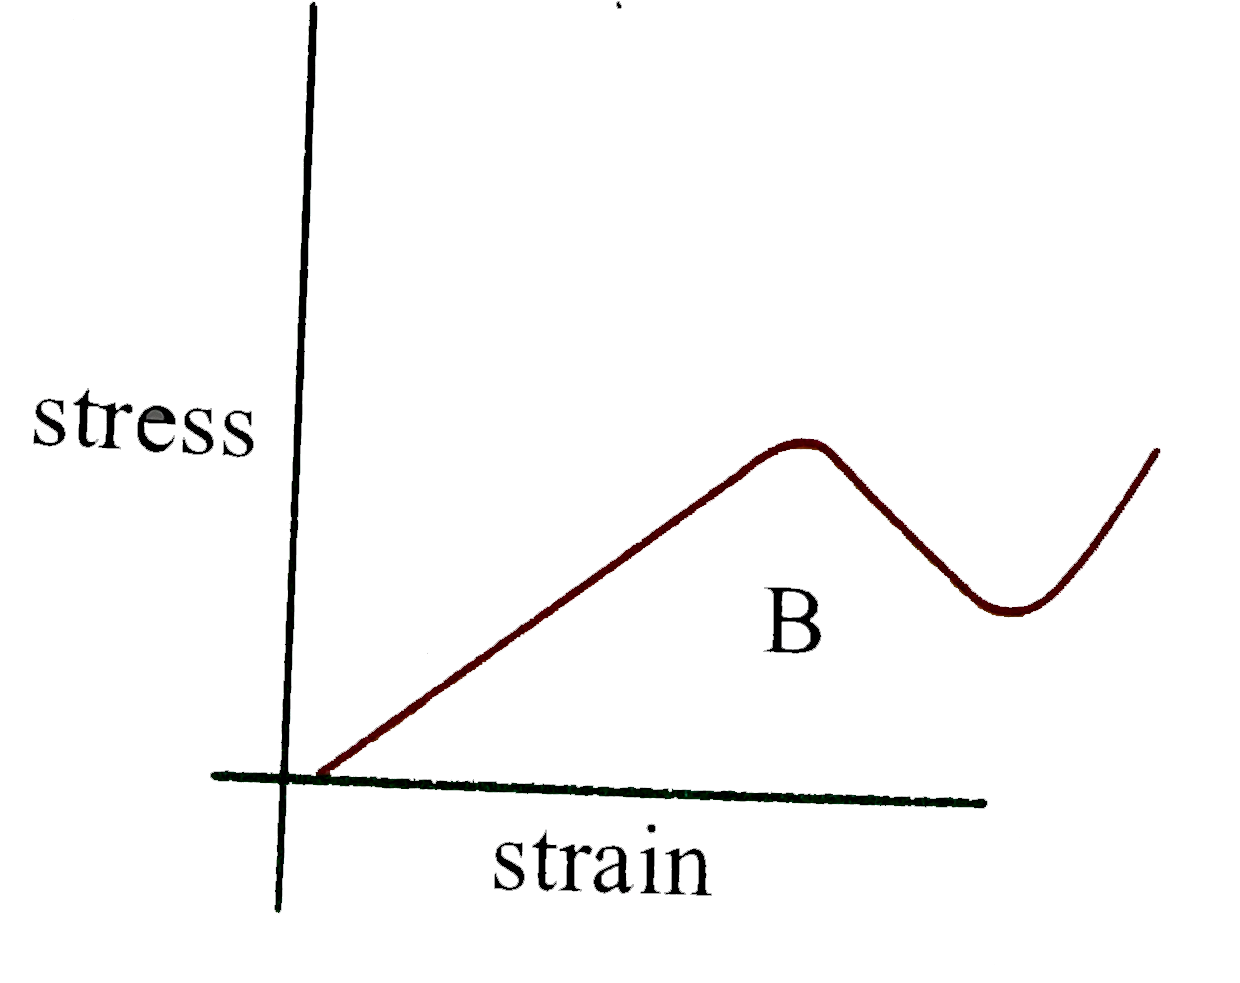
The stress-strain graphs for two materials A and B are shown in the figure. The graphs are drawn to the same scale.
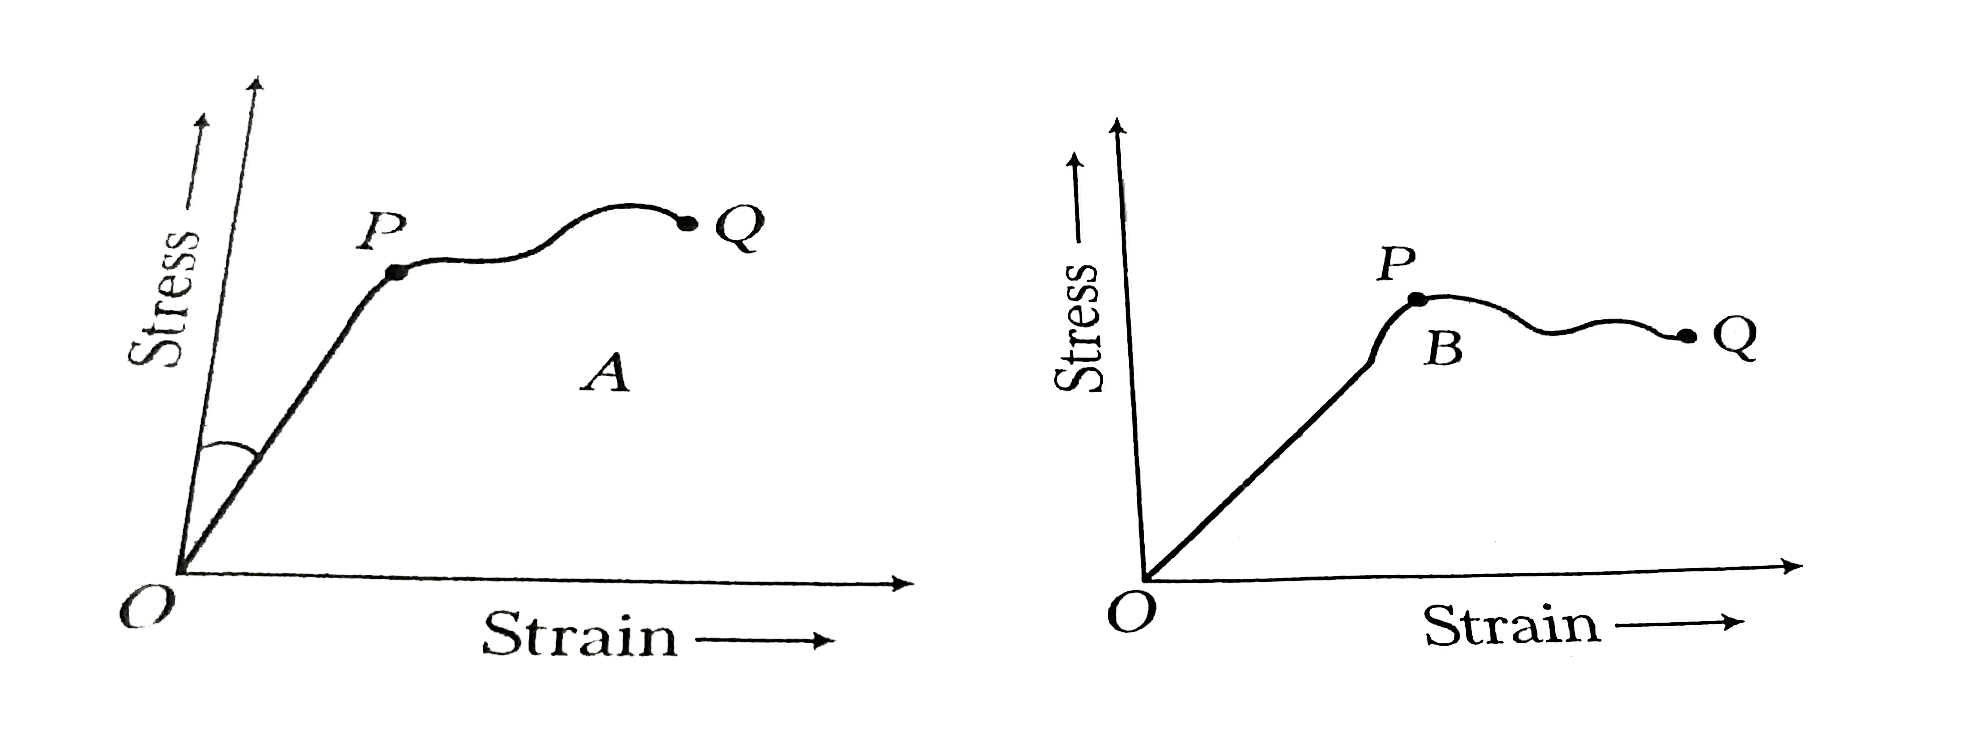
(a) Which material has a greater Young's modulus ?
(b) Which material is more ductile ?
(c) Which material is more brittle?
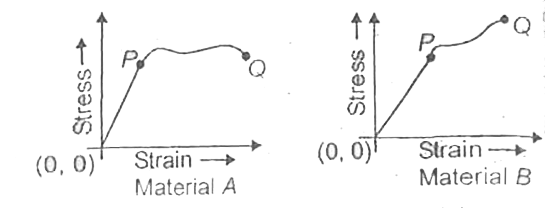
(d) Which of the two is the stronger material ?View SolutionThe stress-strain graphs for two materials A and are shown in figure. The graphs are drawn to the same scale. Select the correct statement
 View Solution
Knowledge Check
- Question 1 - Select One
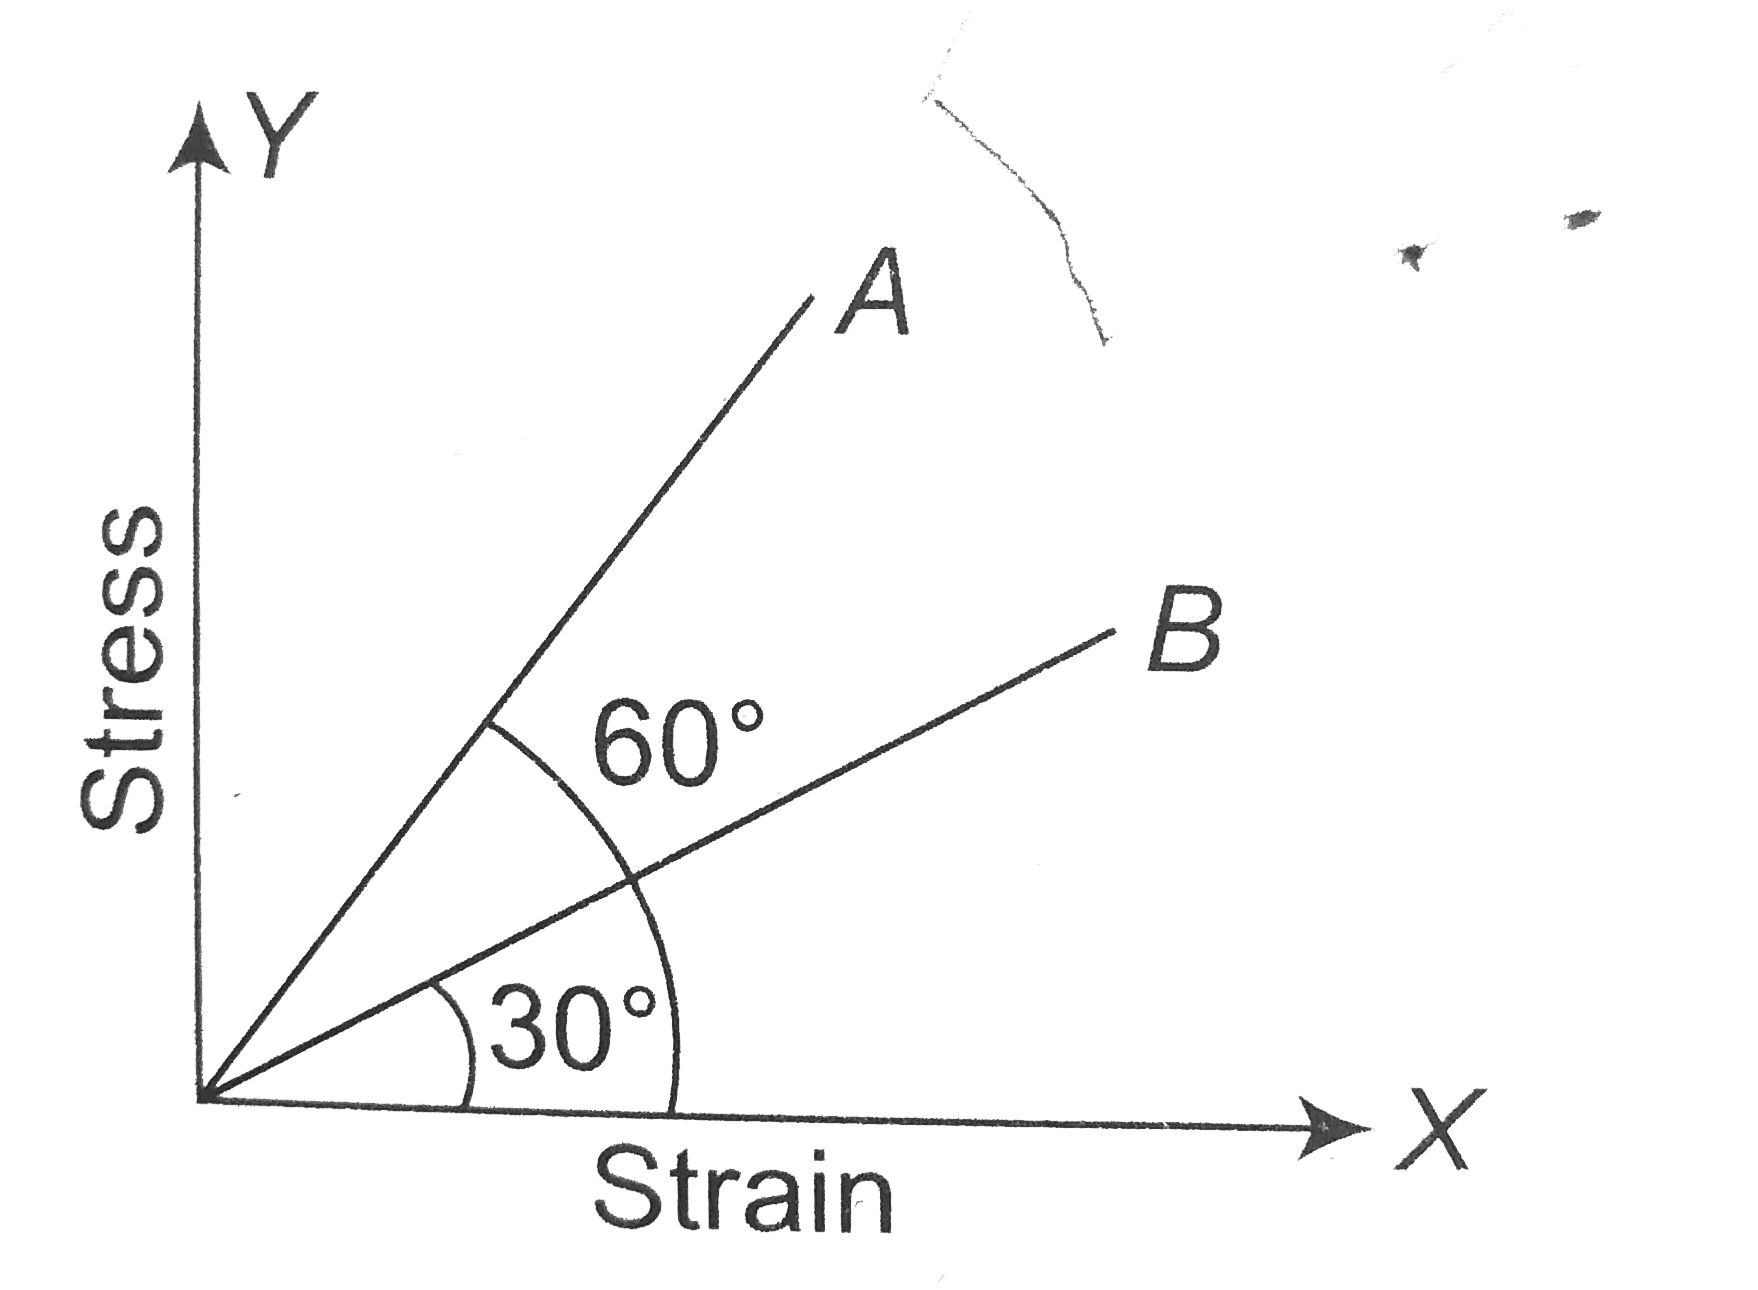
The stress versus strain graphs for wires of two materials A and B are as shown in the figure. If YA and YB are the Young's moduli of the materials thenAYB=2YABYA=YBCYB=3YADYA=3YB - Question 2 - Select One
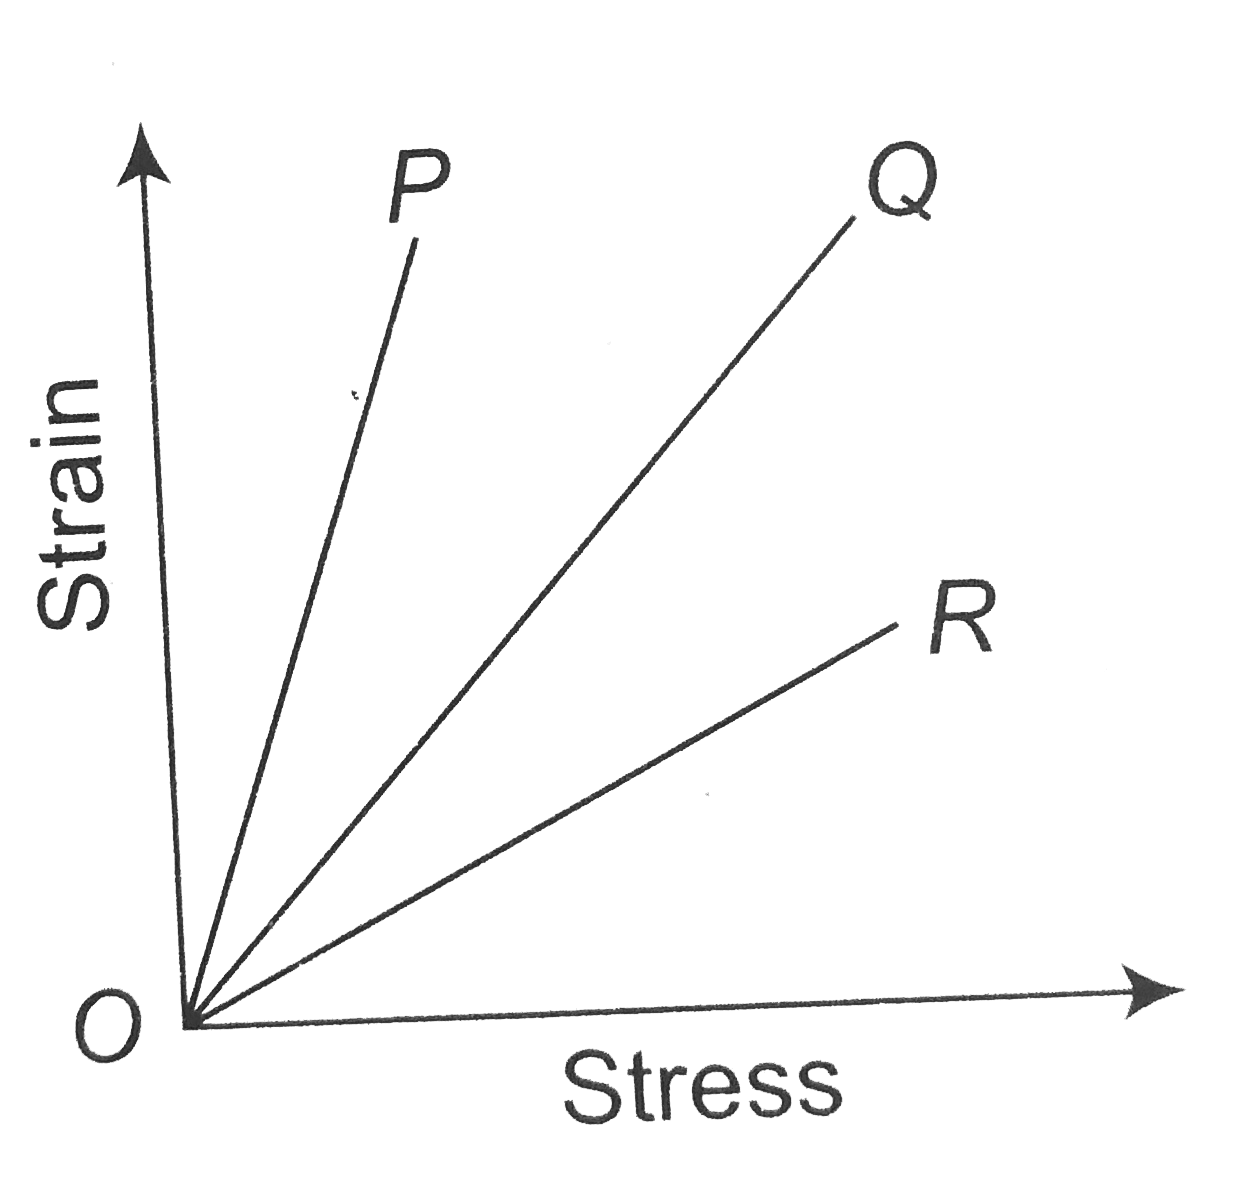
The strain stress curves of three wires of different materials are shown in the figure. P, Q and R are the elastic limits of the wires. The figure shown thatAElasticity of wire P is maximumBElasticity of wire Q is maximumCTensile strength of R is maximumDNone of the above is true. - Question 3 - Select One
The stress versus strain graphs for wires of two materials A and B are as shown in the figure. If YAandYB are the younng's moduli of the materials, then
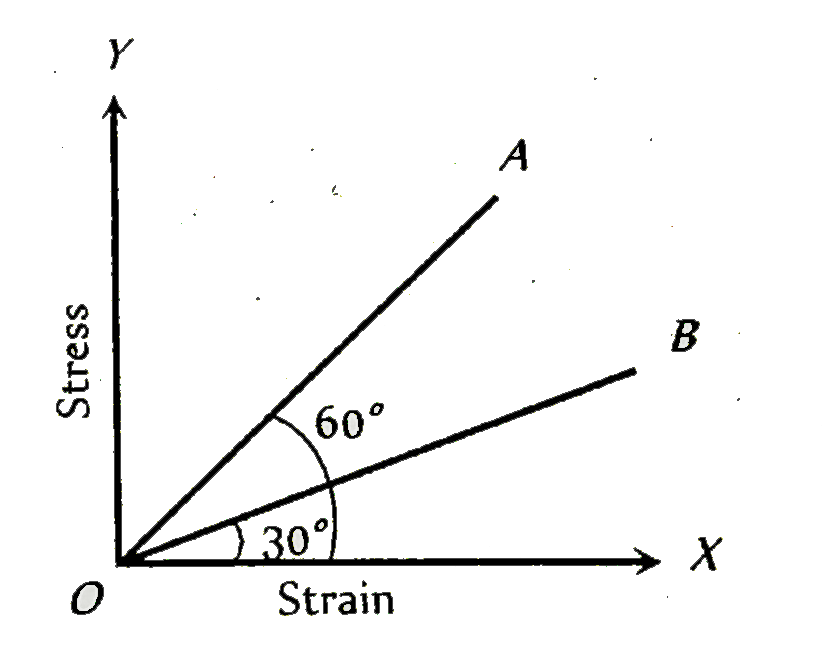 AYB=2YABYA=YBCYB=3YADYA=3YB
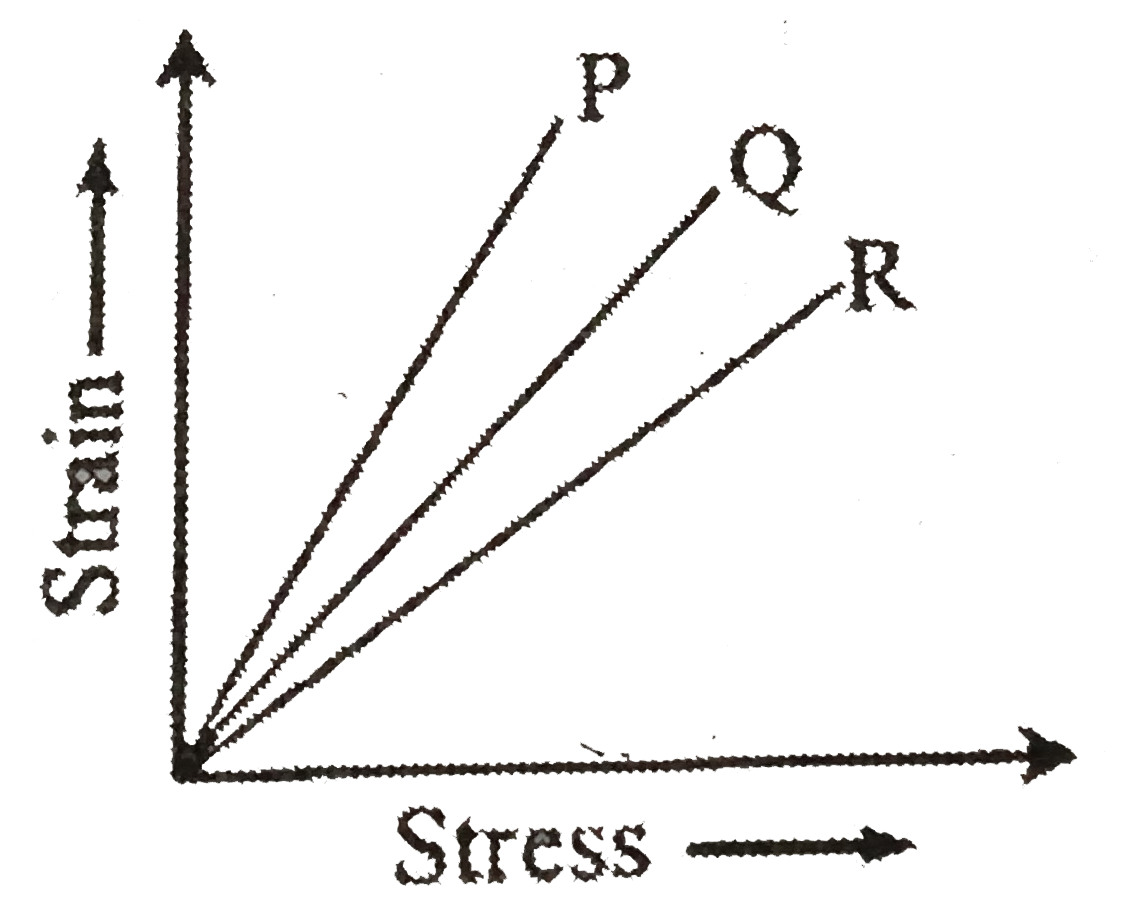
The strain-stress curves of three wires of different materials ar shown in the figure P,Q and R are the elastic limits of the wires. The figure shows that :
 View Solution
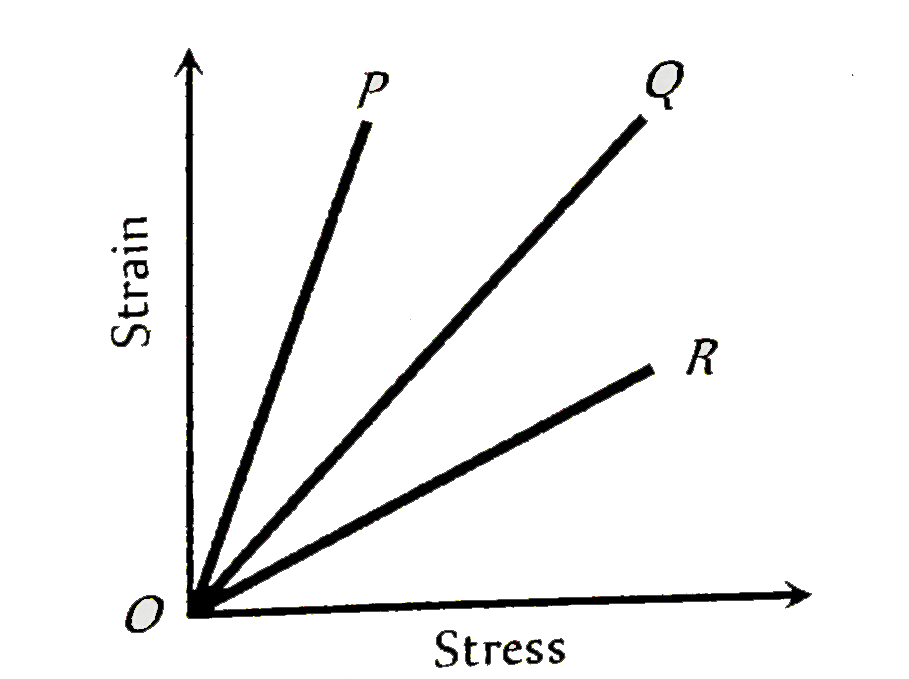
The strain-stress curves of three wire of different materials are shown in the figure. P,Q and R are the elastic limits of the wires. The figures shows that
 View Solution
The stress- strain graphs for materials A and B are as shown. Choose the correct alternative
 View Solution
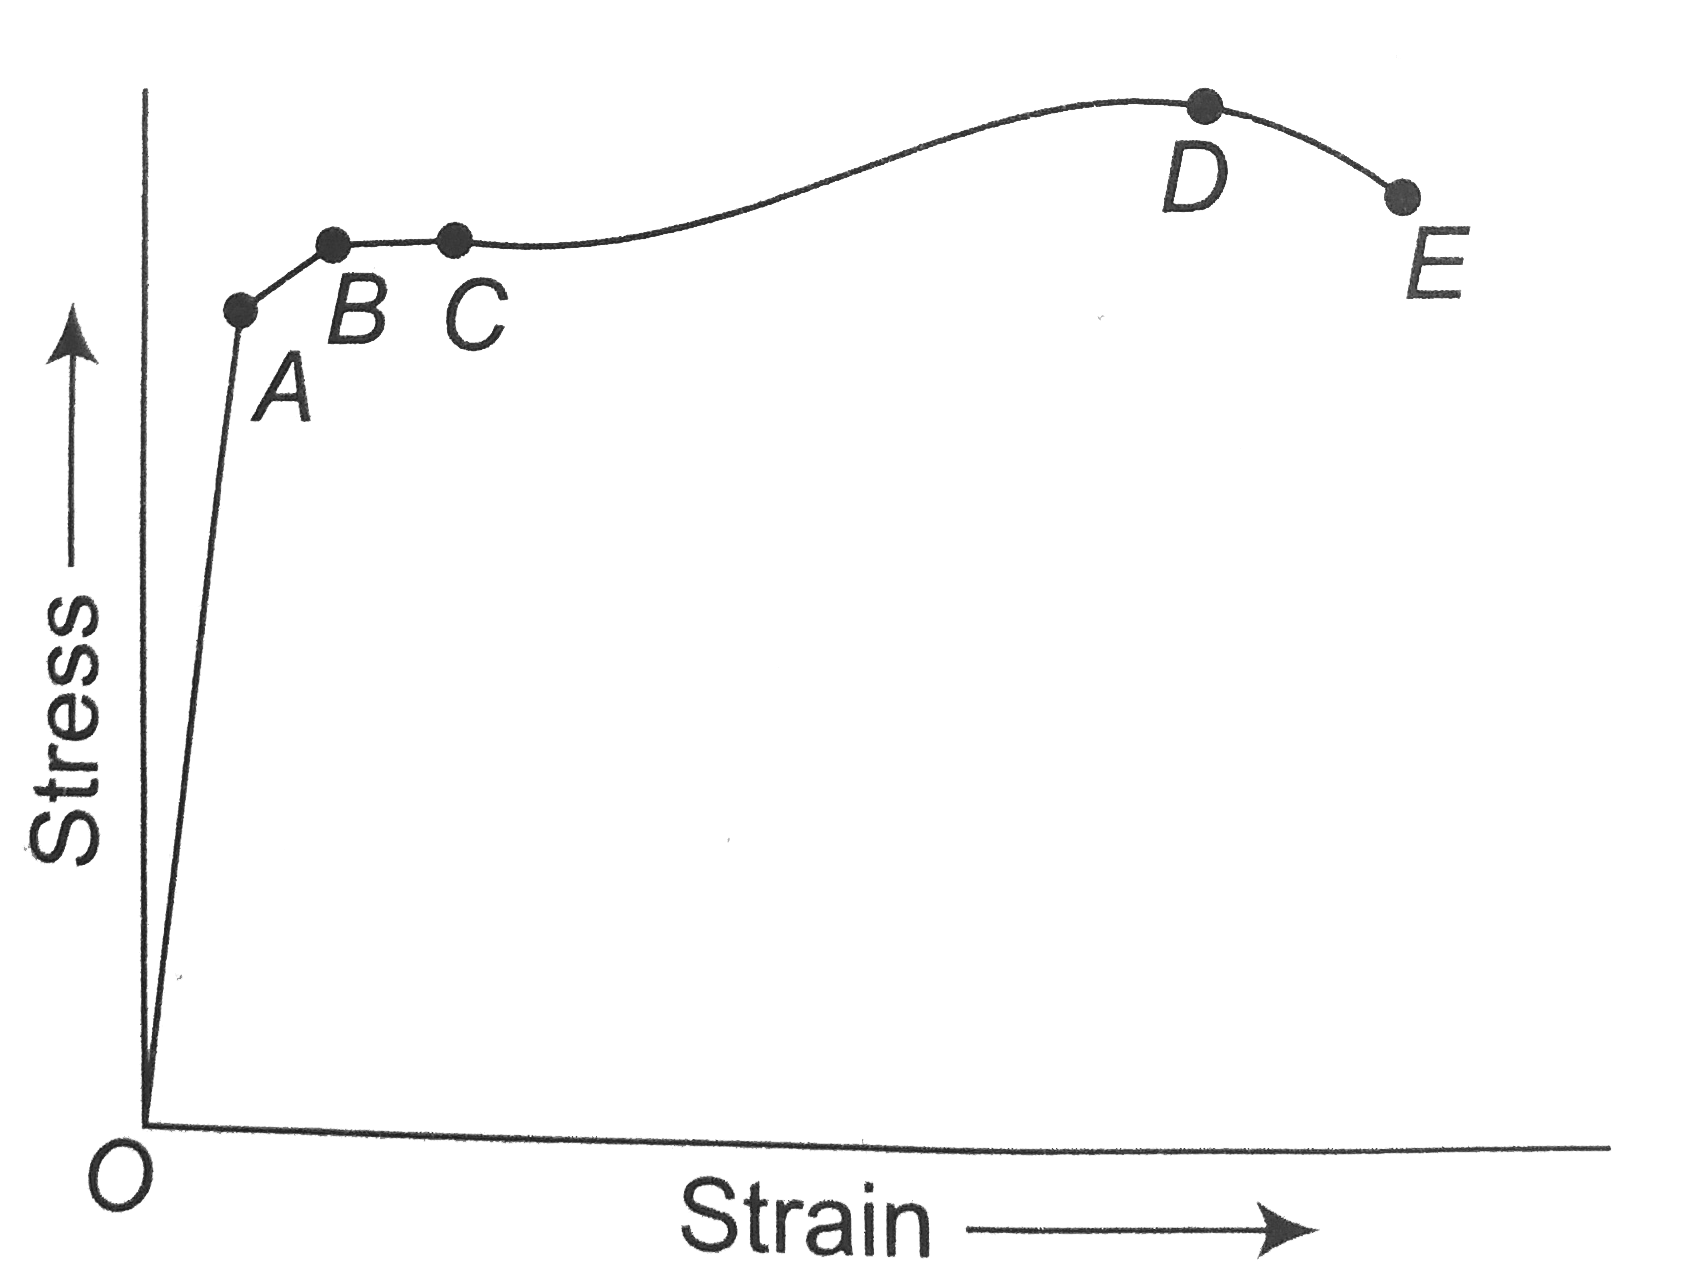
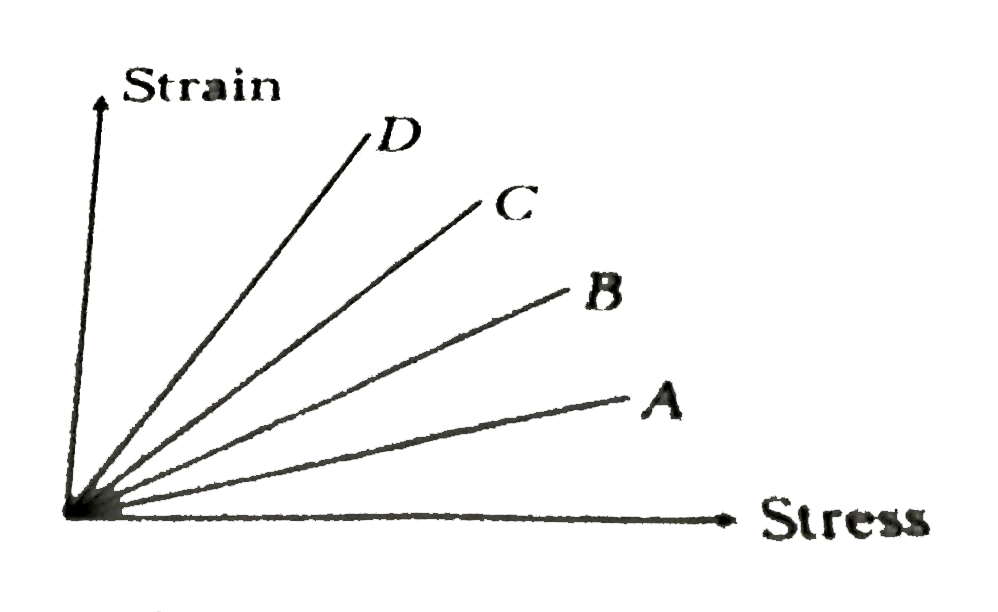
The stress strain graph for a metal wire is as shown in the figure. In the graph, the region in which Hooke's law is obeyed, the ultimate strength and fracture are represented byView SolutionStress-strain curve for four metals are shown in figure. The maximum Young's modulus of elasticity is for metal
 View Solution

