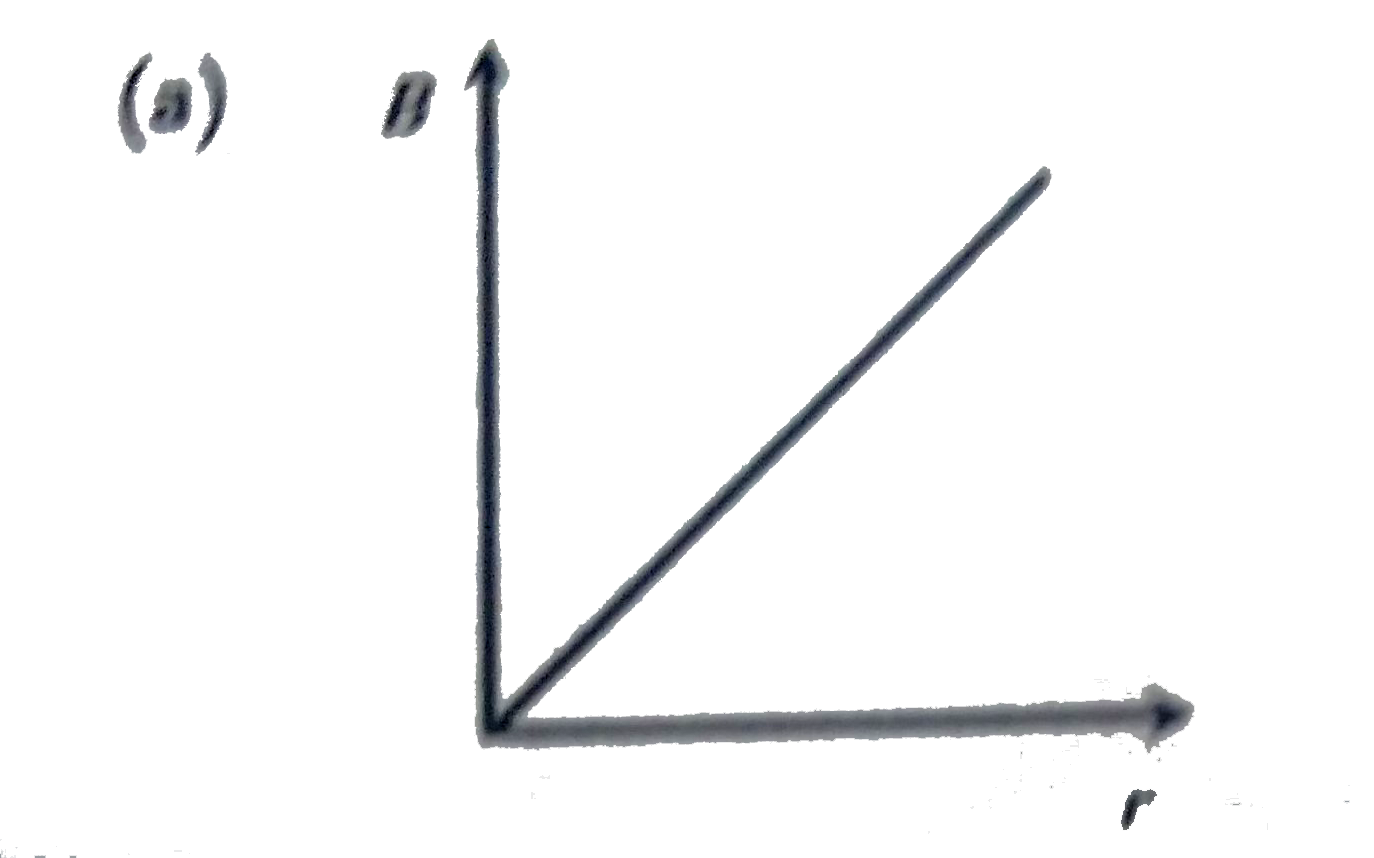
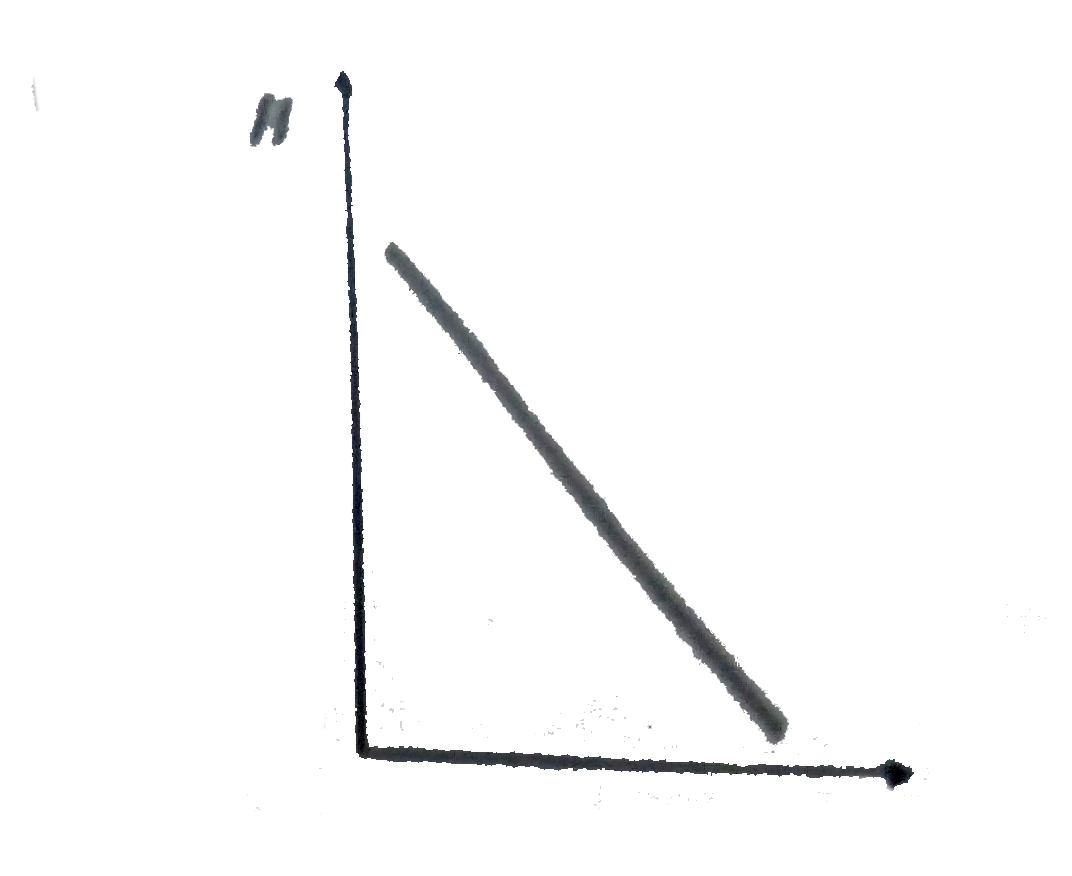
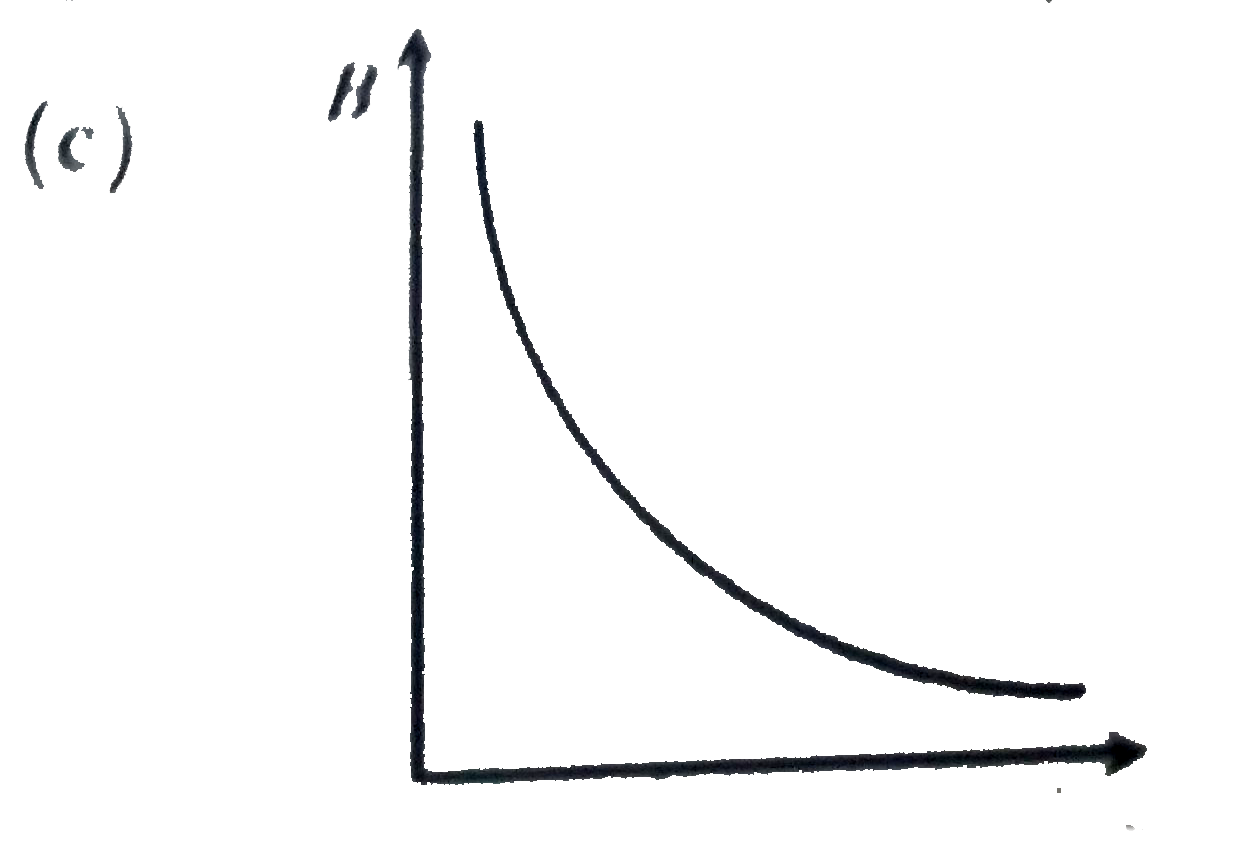
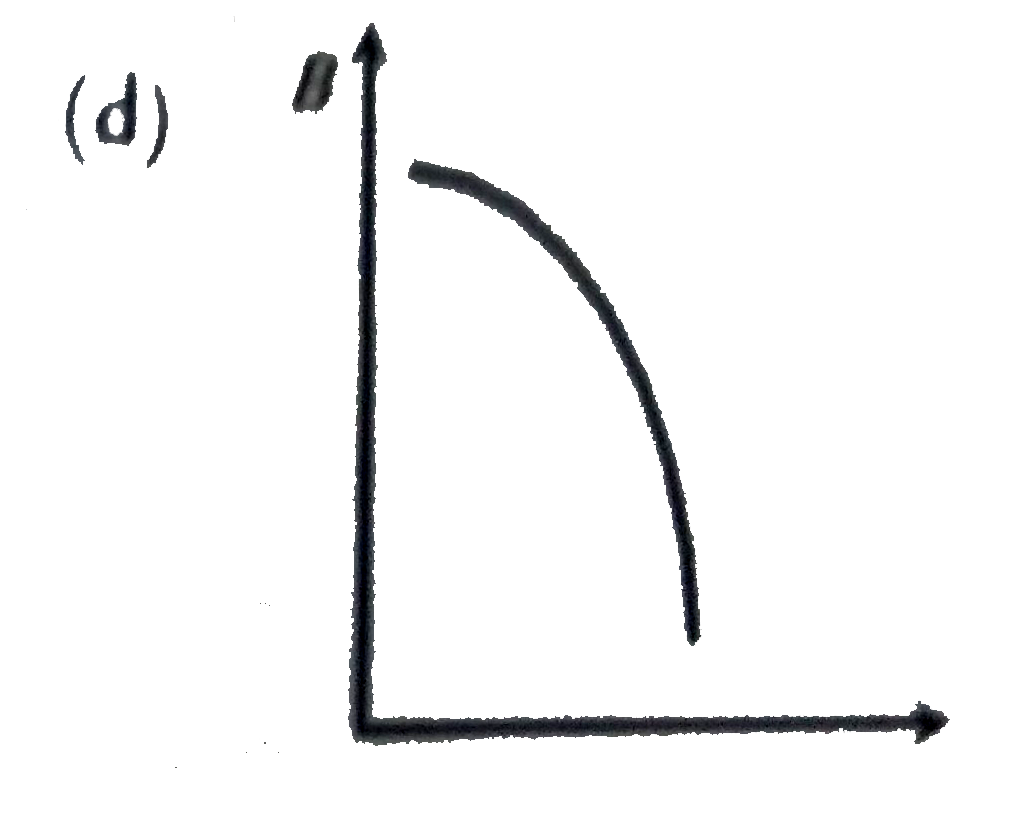
Which of the following graphs shows the variation of magnetic induction B with distance r from a long wire carrying current
A
B
C
D
Text Solution
The correct Answer is:C
|
Similar Questions
Knowledge Check
Which one of the following graphs shows the variation of magnetic induction B which distance r from a long wire carrying a current ?
A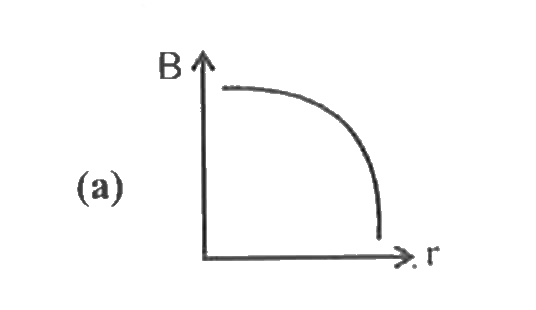 B
B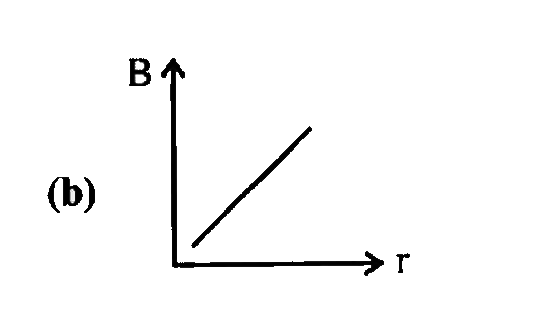 C
C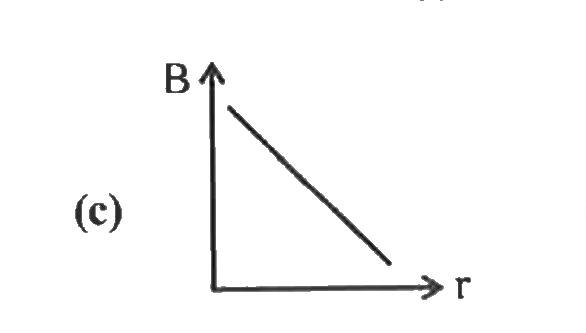 D
D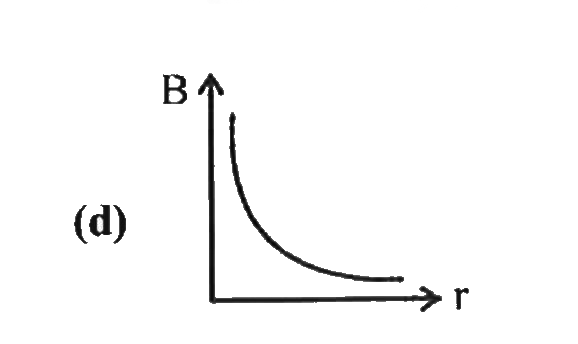
The magnetic induction at any point due to a long straight wire carrying a current is
AProportional to the distance from the wireBInversely proportional to the distance from wireCInversely proportional to the square of the distance from the wireDDoes not depend on distanceWhat is the magnetic induction at a distance of 5 cm from a straight wire carrying a current of 5 mA ?
A4×10−8Wb/m2B3×10−8Wb/m2C2×10−8Wb/m2D5.5×10−8Wb/m2
Which of the following figure shown the magnetic flux denstiy b at a distance r from a long straight rod carrying a steady current I ?
View SolutionVariation of magnetic field with distance from current carrying conductor is:
View SolutionA long straight wire of a circular cross-section (radius a) carries a steady current I and the current I is uniformly distributed across this cross-section. Which of the following plots represents the variation of magnitude of magnetic field B with distance r from the centre of the wire?
View SolutionWhich of the following figure shown the magnetic flux denstiy b at a distance r from a long straight rod carrying a steady current I ?
View SolutionThe magnetic induction in air at a point 1cm away from a long wire that carries a current of 1A, will be
View Solution

