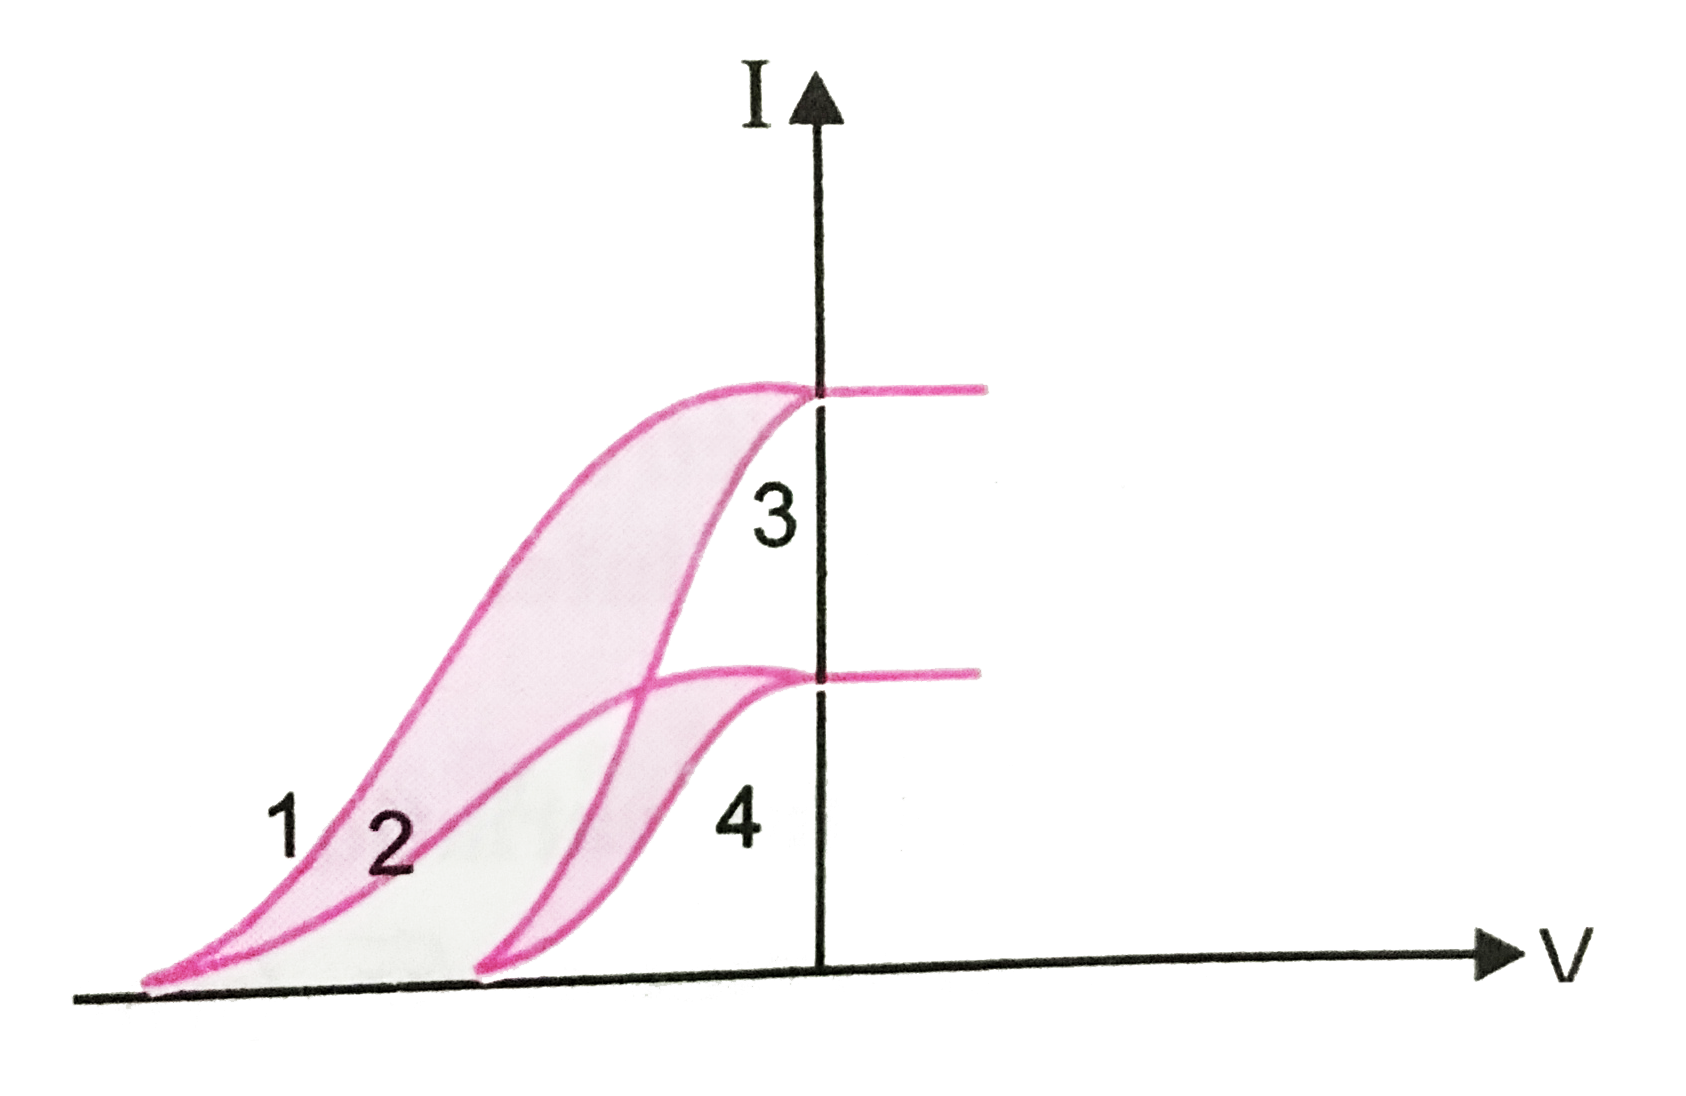
Draw graphs showing variation of photoelectric current with applied voltage for two incident radiations of equal frequency and different instensities. Mark the graph for the radiation of higher instensity.Solution in Bengali
Step by step video & image solution for Draw graphs showing variation of photoelectric current with applied voltage for two incident radiations of equal frequency and different instensities. Mark the graph for the radiation of higher instensity. by Physics experts to help you in doubts & scoring excellent marks in Class 12 exams.
Topper's Solved these Questions
- BOOK - CHHAYA PUBLICATIONCHAPTER - QUANTUM THEORYEXERCISE - Examination Archive with solutions39videos
QUANTUM THEORY
- BOOK - CHHAYA PUBLICATIONCHAPTER - OPTICAL INSTRUMENTSEXERCISE - CBSE SCANNER8videos
OPTICAL INSTRUMENTS
- BOOK - CHHAYA PUBLICATIONCHAPTER - QUESTION PAPER OF NEET 2017EXERCISE - QUESTION PAPERS OF (NEET) (2017)39videos
QUESTION PAPER OF NEET 2017
Similar Questions
What will be the kinetic energy of emitted photoelectrons if light of threshold frequency falls on a metal?
01:50View SolutionDefine the magnifying power of a compound microscope when the final image is formed at infinity . Why must both the objective and the eyepiece of a compound microscope has short focal lengths ? Explain.
03:34View SolutionA molecule of a substance has permanent dipole moment p. A mole of this substance is polarised by applying a strong electrostatic field E. The direction of the field is suddenly changed by an angle of 60∘. If N is the Avogadro's number the amount of work done by the field is
02:51View SolutionThe stopping potential as a function of the frequency of the incident radiation is plotted for two different photoelectric surfaces A and B . The graphs show that work function of A is
 01:58View Solution
Draw a plot showing the variation of photoelectric current with collector plate potential for two different frequencies, v1>v2 of incident radiation having the same intensity. In which case will the stopping potential be higher? Justify your answer.
03:05View SolutionThe graph of Fig. shows the variation of photoelectric current (I) versus applied voltage (V) for the two different photosensitive materials for two different intensities of the incident radiation. Identify the pairs of curves that correspond to different materials but same intensity of incident radiation.
01:58View SolutionDarw graphs showing variation of photoelctric current with applied voltage for two incident radiations of equal frequecny and different intensities. Mark the graph for the radiaiton of higher intensity.
03:18View SolutionDraw a graph showing variation of photoelectric current (I) with anode potential ( V ) for different intensities of incident radiation. Name the characteristic of incident radiation that is kept constant in this experiment.
04:22View SolutionDarw graphs showing variation of photoelctric current with applied voltage for two incident radiations of equal frequecny and different intensities. Mark the graph for the radiaiton of higher intensity.
View SolutionDraw and explain the graph showing the variation of stopping potential with frequency of incident radiation in relation to photoelectric effect.
02:47View SolutionDefine photoelectric effect. Draw a graph to show the variation of stopping potential with frequency of incident radiation on a metal plate.
01:00View SolutionDraw graphs showing variation of photoelectric current with applied voltage for three incident radiations of equal frequency and different intensities. Mark the graph for the radiation of higher intensity.
04:19View SolutionDraw a plot showing the variation of photoelectric current with collector plate potential for two different frequencies, v1>v2 of incident radiation having the same intensity. In which case will the stopping potential be higher? Justify your answer.
01:41View SolutionThe graph of Fig. shows the variation of photoelectric current (I) versus applied voltage (V) for the two different photosensitive materials for two different intensities of the incident radiation. Identify the pairs of curves that correspond to different materials but same intensity of incident radiation.
 02:46View Solution
Darw graphs showing variation of photoelctric current with applied voltage for two incident radiations of equal frequecny and different intensities. Mark the graph for the radiaiton of higher intensity.
02:24View Solution

