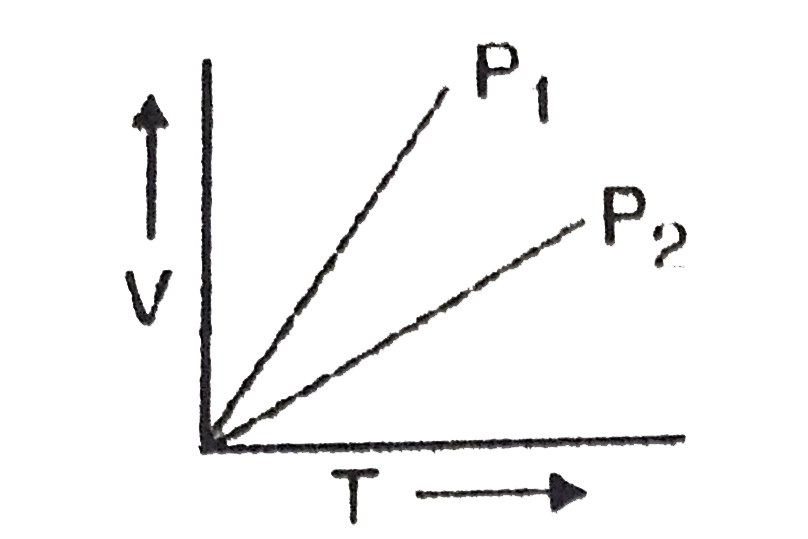
At constant pressure for a given amount of an ideal gas, will the graph obtained by plotting V vs t∘C and V vs TK be different ?Solution in Bengali
According to Charles' law V=KT . . .[1]
[at constant pressure for a given mass of a gas]
But T=273+t, hence, V=K(273+t) . . [2]
Both the equation [1] & [2] express equations for straight lines. Equation no [1] represents a straight line passing through the origin. equation no. [2] does not represent a straight line passing through the origin. the plot of V vs t results in a straight line that cuts the V-axis at 0∘C. if this straight line is extrapolated backward, it meets the t-axis at −273∘C. ltBrgt 
From the, above two graphs it is evident that there are no actual defferences between the two graphs, because −273∘C and 0K express the same temperature.
Topper's Solved these Questions
- STATES OF MATTER : GASES AND LIQUIDSBOOK - CHHAYA PUBLICATIONCHAPTER - STATES OF MATTER : GASES AND LIQUIDSEXERCISE - SOLVED WBCHSE SCANNER
23 Videos
- STATES OF MATTER : GASES AND LIQUIDSBOOK - CHHAYA PUBLICATIONCHAPTER - STATES OF MATTER : GASES AND LIQUIDSEXERCISE - SOLVED NCERT EXERCISE
23 Videos
- STATES OF MATTER : GASES AND LIQUIDSBOOK - CHHAYA PUBLICATIONCHAPTER - STATES OF MATTER : GASES AND LIQUIDSEXERCISE - WARM UP EXERCISE
104 Videos
- SOME BASIC CONCEPTS OF CHEMISTRYBOOK - CHHAYA PUBLICATIONCHAPTER - SOME BASIC CONCEPTS OF CHEMISTRYEXERCISE - PRACTICE SET
13 Videos
- STRUCTURE OF ATOMBOOK - CHHAYA PUBLICATIONCHAPTER - STRUCTURE OF ATOMEXERCISE - PRACTICE SET
15 Videos
Similar Questions
Determine the value of gas constant R in SI unit.
View SolutionFind out the minimum pressure required to compress 500 dm3 of aiir at 1 bar to 200 dm3 at 30∘C.
View SolutionDetermine the types of intermolecular forces of attraction in the following substances.
n-hexane, SO2,CO2, CHCl3, (CH3)2CO, I2, (CH3)2O
View SolutionWhat do you mean by semimolar NaOH solution?
View SolutionWhat accelerating potential is needed to produce an electron beam with an effective wavelength of 0.090Å-
View SolutionDraw the plot log V vs log T.
View SolutionIn the following sketch three constant pressure lines are plotted on T vs V plot, then which is the correct order of the pressure .

View SolutionV vs T curves at constant pressure P1 and P2 for an ideal gas are shown below

Which is correct ?
View SolutionAt low pressure, the graph of PVvs1V for a given amount at a constant temperature for a real gas is:
View SolutionGraphs: s vs t, v vs t and a vs t
View SolutionWill the nature of the following graphical presentations for a given mass of gas be the same? (i) P vs V at a constant temperature (ii) V vs T at constant pressure.
View SolutionPlot density vs pressure for a fixed mass of an ideal gas at a constant temperature.
View SolutionWhat is the slope of the plot of log P vs log V for a given amount of an ideal gas at a givem temperature?
View Solutionfor a given mass of an ideal gas at constant temperature draw and explain the graphs (i) PV^(2) vs V (ii) P^(2)V vs V.
View SolutionAt constant pressure for a given amount of an ideal gas, will the graphs obtained by plotting V vs t^(@)C and V vs TK be different?
View Solution
