Graphs: s vs t, v vs t and a vs t
NA
Similar Questions
Knowledge Check
An unstable nucleus X can decay into two stable nuclie Y and Z A sample containing only X is taken at t=0 Three graphs loge(Nx vs t,Nx, vs t and Nz vs t are drawn as shown below Here Nx,Ny and Nz represent number of nuclei of X,Y and Z repectively at any instant. t
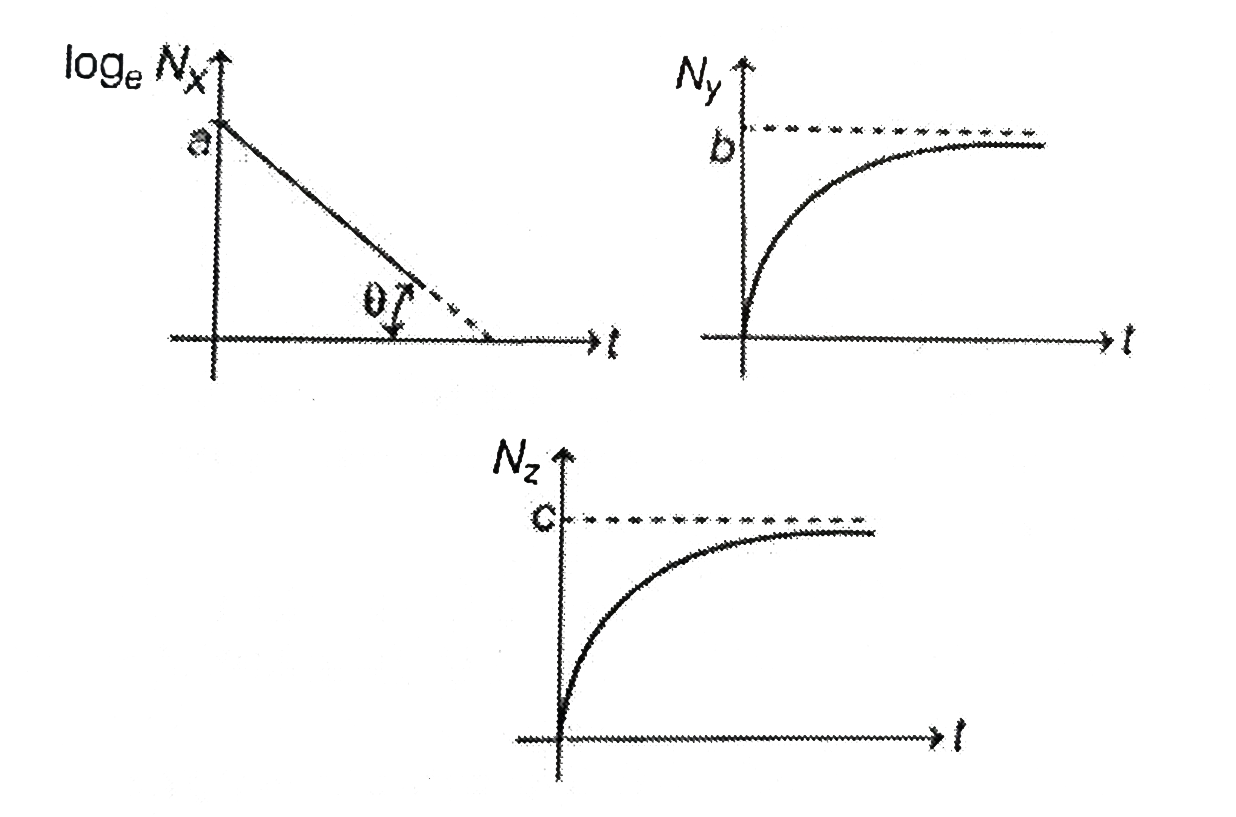
Choose the correct choice (s) from the following :ADecay constant for decay of X into Y is btanθeaBecay constant for decay of X into Z is ctanθeaCNumber of nuclei of X at t=0-is eaDHalf-life of nuclei X is 1tanθThe graph of P vs V is given at temperature and number of moles :
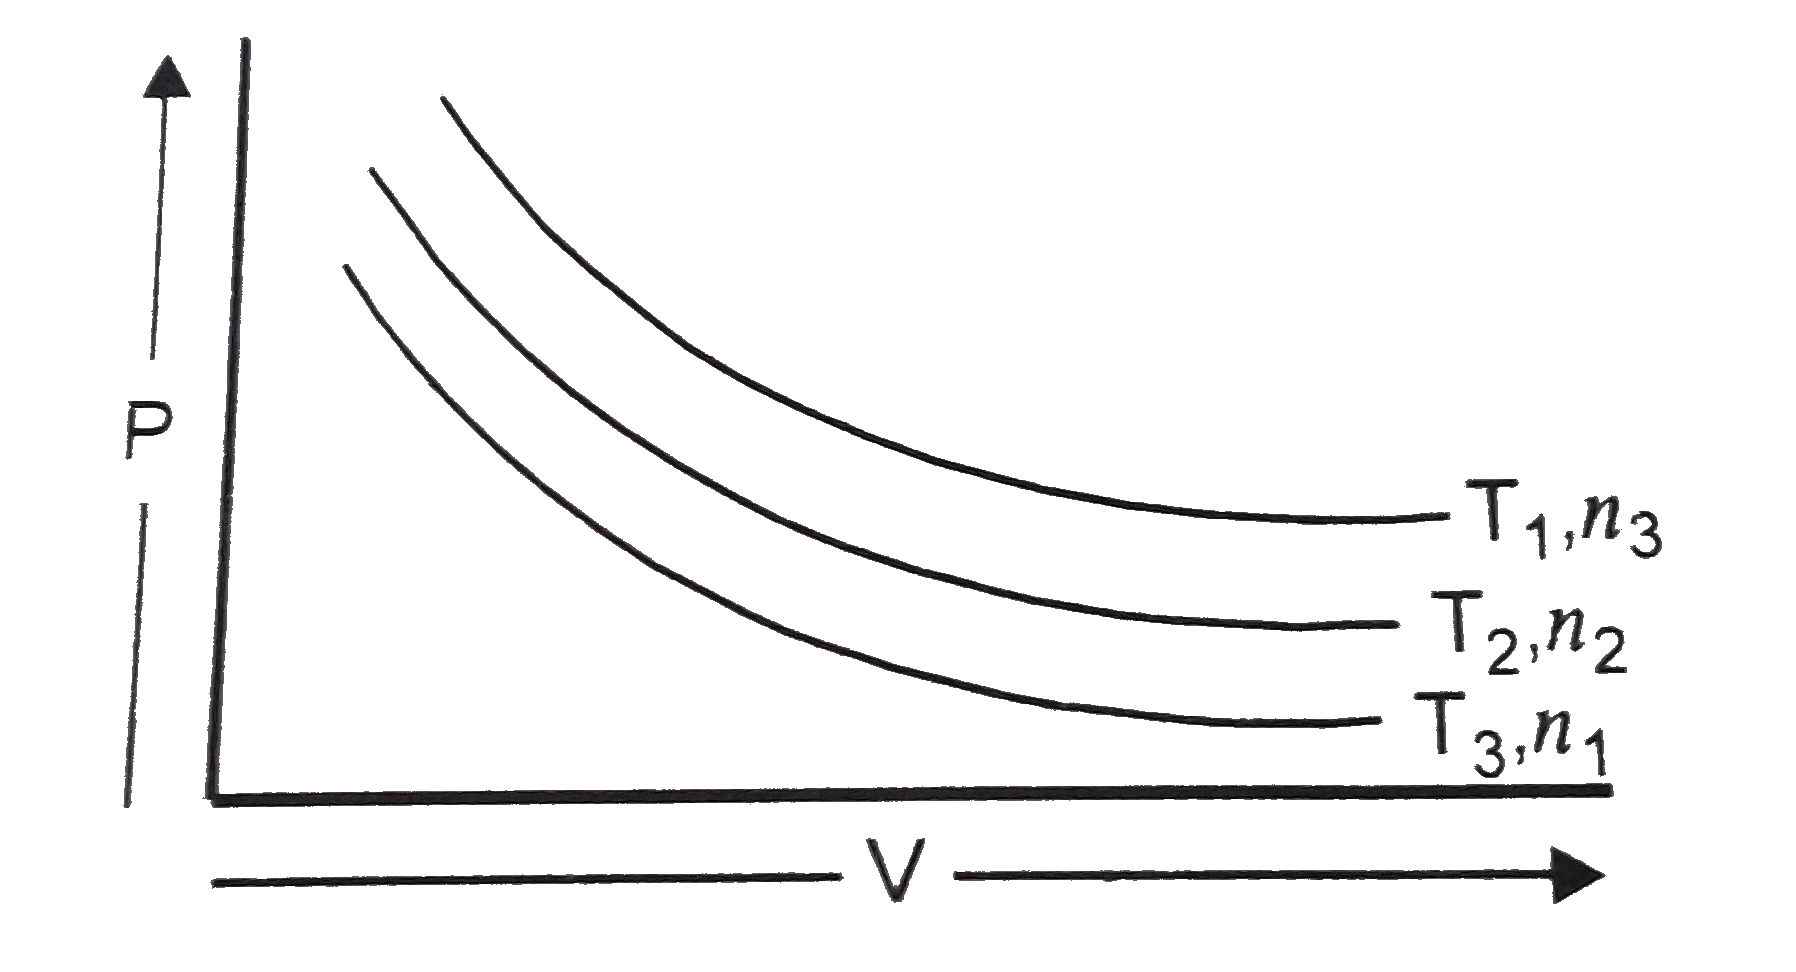
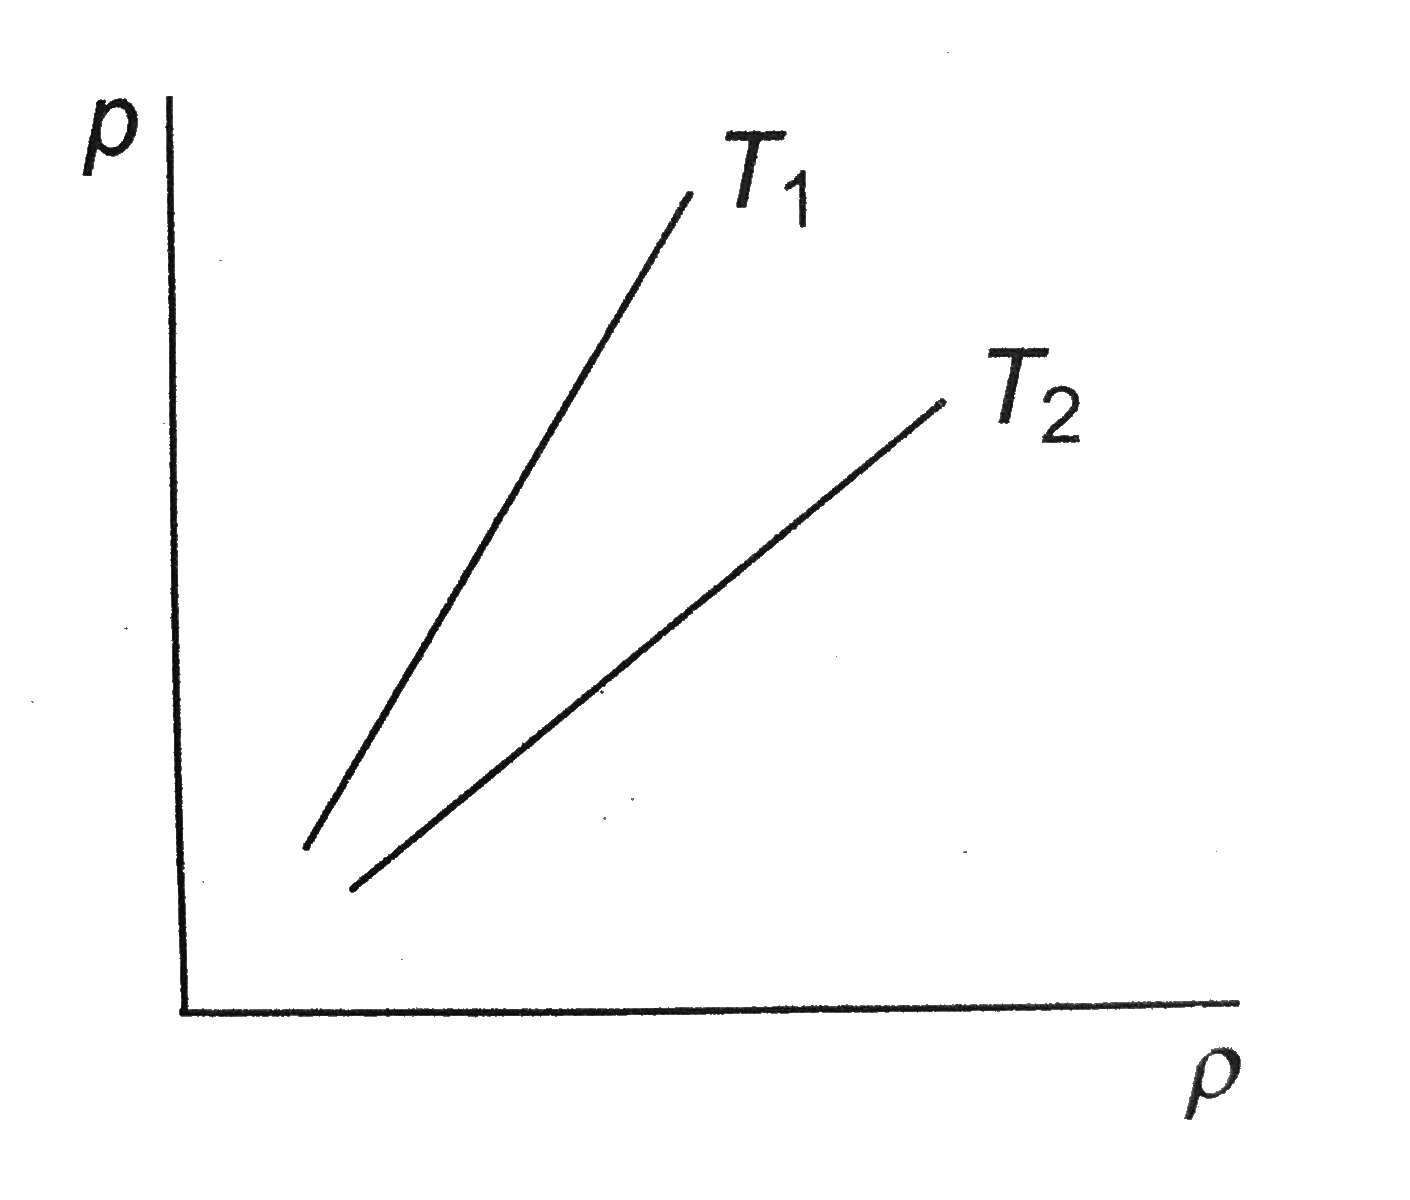
The correct relationship is/areAT1>T2>T3BT1<T2<T3Cn1>n2>n3Dn3>n2>n1Figure shows graphs of pressure vs density for an ideal gas at two temperatures Tt and T2
AT1>T2BT1=T2CT1<T2Dany of the three is possible
Starting at x=0, a particle moves according to the graph of v vs t shown in . Sketch a staph of the instantaneoud acceleration a vs t, indicationg numerical values at significant points of the graph.
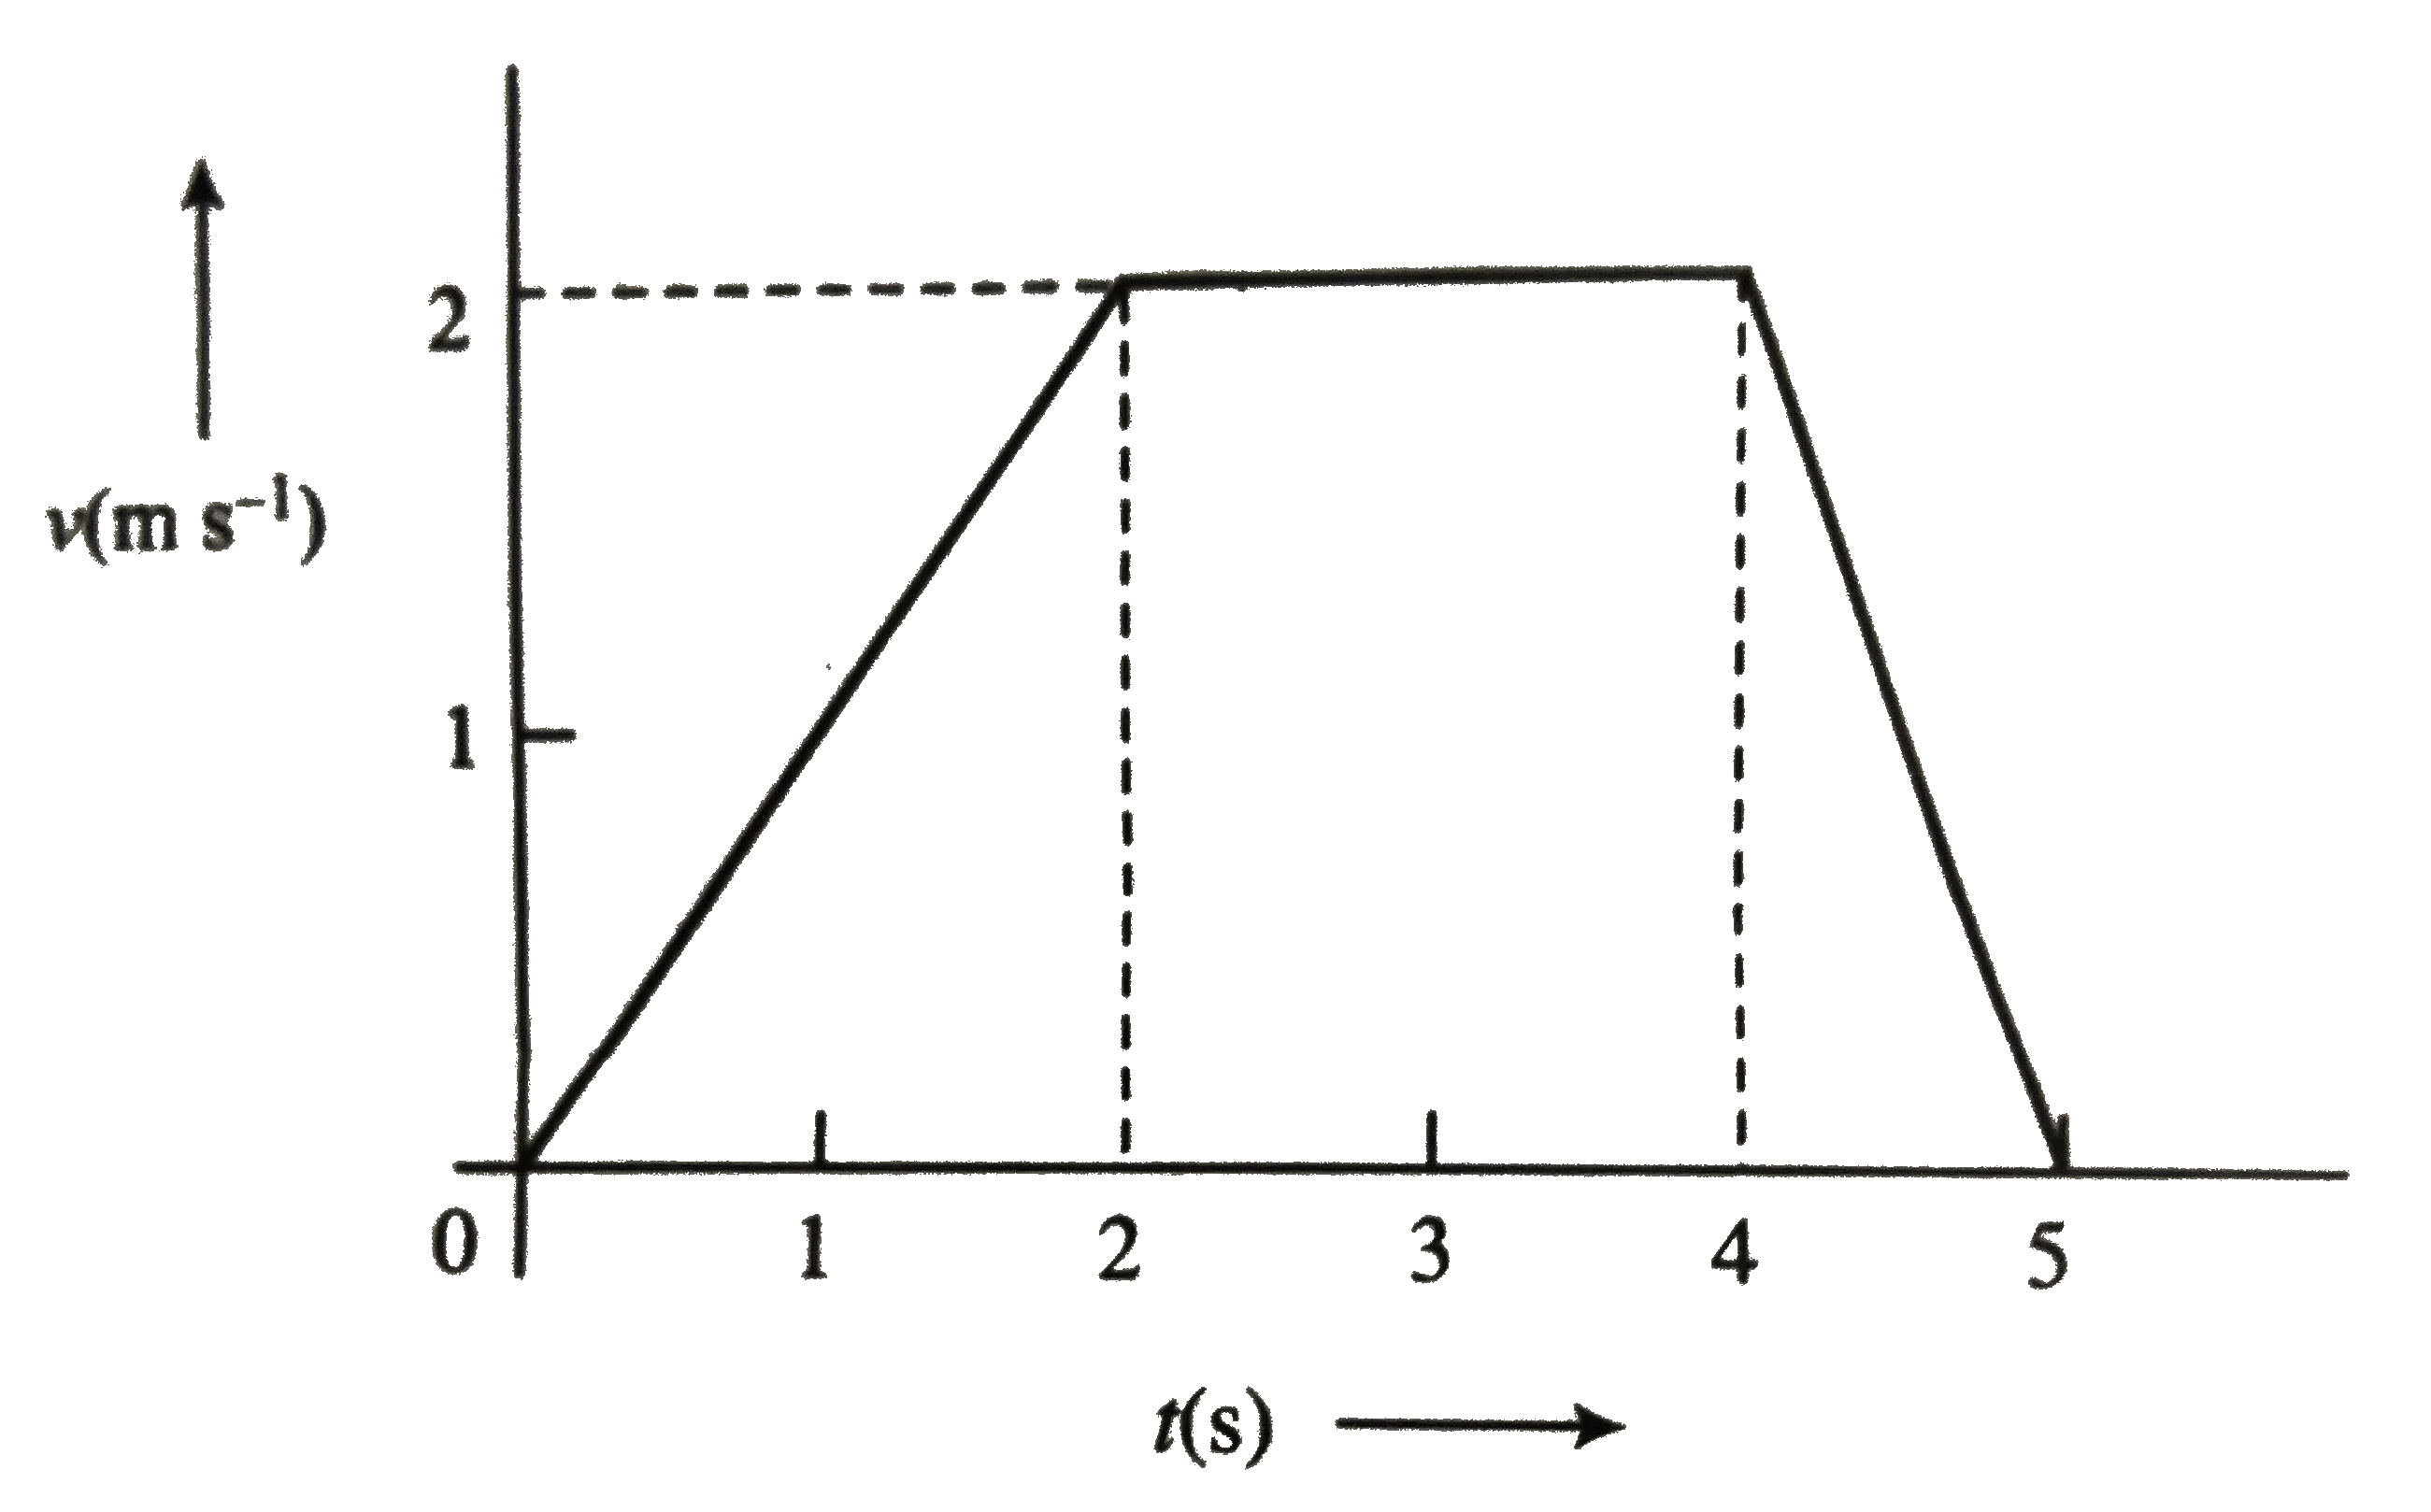 .
.
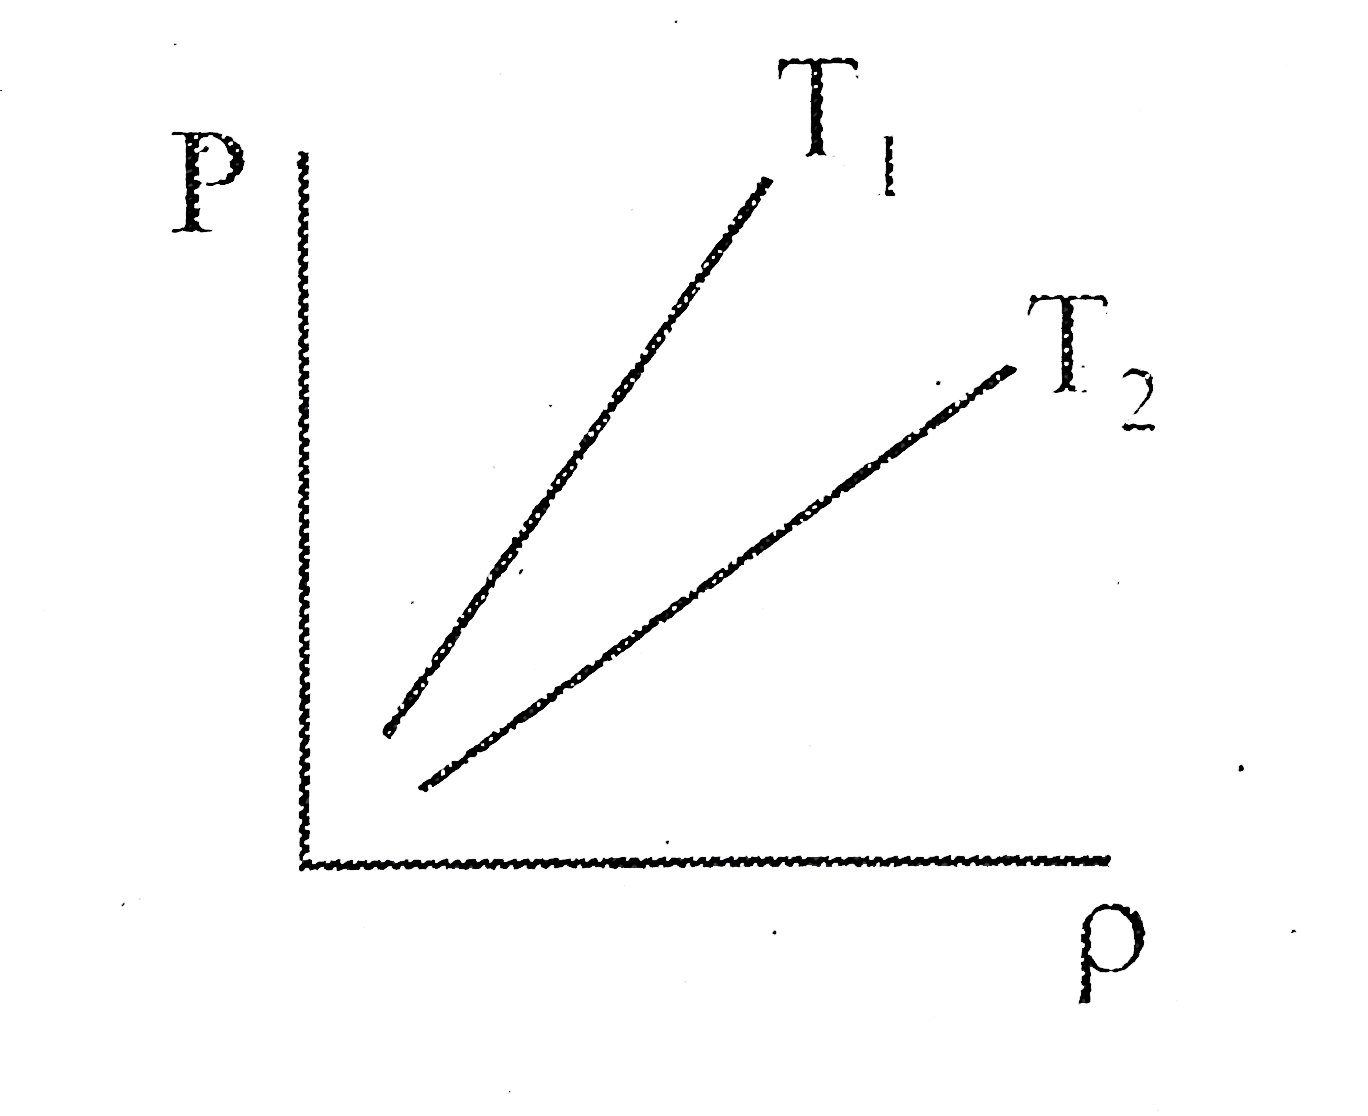
View SolutionFigure shows graphs of pressure vs density for an ideal gas at two temperature T1 and T2 . Which of the following is correct ?
View SolutionConsider the following statements -
(i) At same P, if V vs T graph is draw for sam e mass of the two idea gaes, then the heavier has will have a heighter slope.
(ii) Intercept of log V vs T graph should always be posiive.
(iii) Graph of V2 vs 1T2 for fixes amount of an ideal gas at constant pressure will be a parabola.
View SolutionShows graphs of pressure vs density for an ideal gas at two temperaturesT1andT2
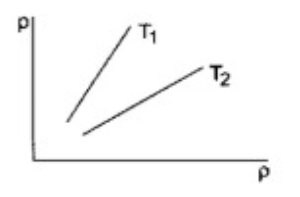
View SolutionFigure shows graphs of pressure vs density for an ideal gas at two temperature T1andT2. Which of the following is correct?
View Solution
