Graphs: s vs t, v vs t and a vs t
To solve the problem of understanding the relationships between displacement, velocity, and acceleration through their respective graphs, we can break it down into three main parts:
Step 1: Displacement vs. Time Graph (s vs t)
1. Understand the Graph: The displacement vs. time graph shows how the position of an object changes over time.
2. Identify the Slope: The slope of the displacement-time graph represents the velocity of the object.
- If the slope is positive, the object is moving in the positive direction.
- If the slope is negative, the object is moving in the negative direction.
- A flat (horizontal) line indicates that the object is at rest.
Step 2: Velocity vs. Time Graph (v vs t)
1. Understand the Graph: The velocity vs. time graph shows how the velocity of an object changes over time.
2. Identify the Slope: The slope of the velocity-time graph represents the acceleration of the object.
- A positive slope indicates positive acceleration (speeding up).
- A negative slope indicates negative acceleration (slowing down).
- A flat line indicates constant velocity.
Step 3: Acceleration vs. Time Graph (a vs t)
1. Understand the Graph: The acceleration vs. time graph shows how the acceleration of an object changes over time.
2. Identify the Slope: The slope of the acceleration-time graph represents the jerk (the rate of change of acceleration).
- A positive slope indicates that acceleration is increasing.
- A negative slope indicates that acceleration is decreasing.
- A flat line indicates constant acceleration.
Summary of Relationships:
- Displacement vs. Time: Slope = Velocity
- Velocity vs. Time: Slope = Acceleration
- Acceleration vs. Time: Slope = Jerk
1. Understand the Graph: The displacement vs. time graph shows how the position of an object changes over time.
2. Identify the Slope: The slope of the displacement-time graph represents the velocity of the object.
- If the slope is positive, the object is moving in the positive direction.
- If the slope is negative, the object is moving in the negative direction.
- A flat (horizontal) line indicates that the object is at rest.
1. Understand the Graph: The velocity vs. time graph shows how the velocity of an object changes over time.
2. Identify the Slope: The slope of the velocity-time graph represents the acceleration of the object.
- A positive slope indicates positive acceleration (speeding up).
- A negative slope indicates negative acceleration (slowing down).
- A flat line indicates constant velocity.
1. Understand the Graph: The acceleration vs. time graph shows how the acceleration of an object changes over time.
2. Identify the Slope: The slope of the acceleration-time graph represents the jerk (the rate of change of acceleration).
- A positive slope indicates that acceleration is increasing.
- A negative slope indicates that acceleration is decreasing.
- A flat line indicates constant acceleration.
- Displacement vs. Time: Slope = Velocity
- Velocity vs. Time: Slope = Acceleration
- Acceleration vs. Time: Slope = Jerk
Similar Questions
An unstable nucleus X can decay into two stable nuclie Y and Z A sample containing only X is taken at t=0 Three graphs loge(Nx vs t,Nx, vs t and Nz vs t are drawn as shown below Here Nx,Ny and Nz represent number of nuclei of X,Y and Z repectively at any instant. t
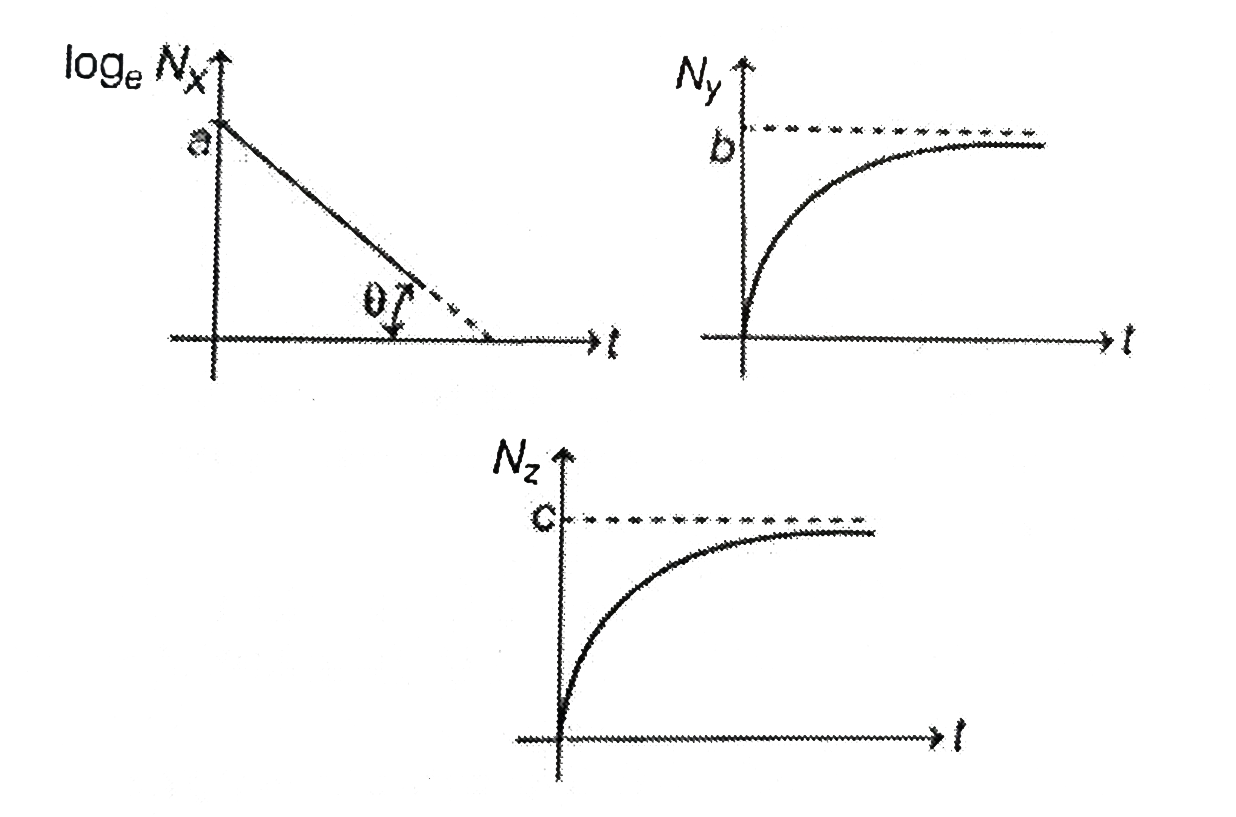
Choose the correct choice (s) from the following :
View SolutionThe graph of P vs V is given at temperature and number of moles :
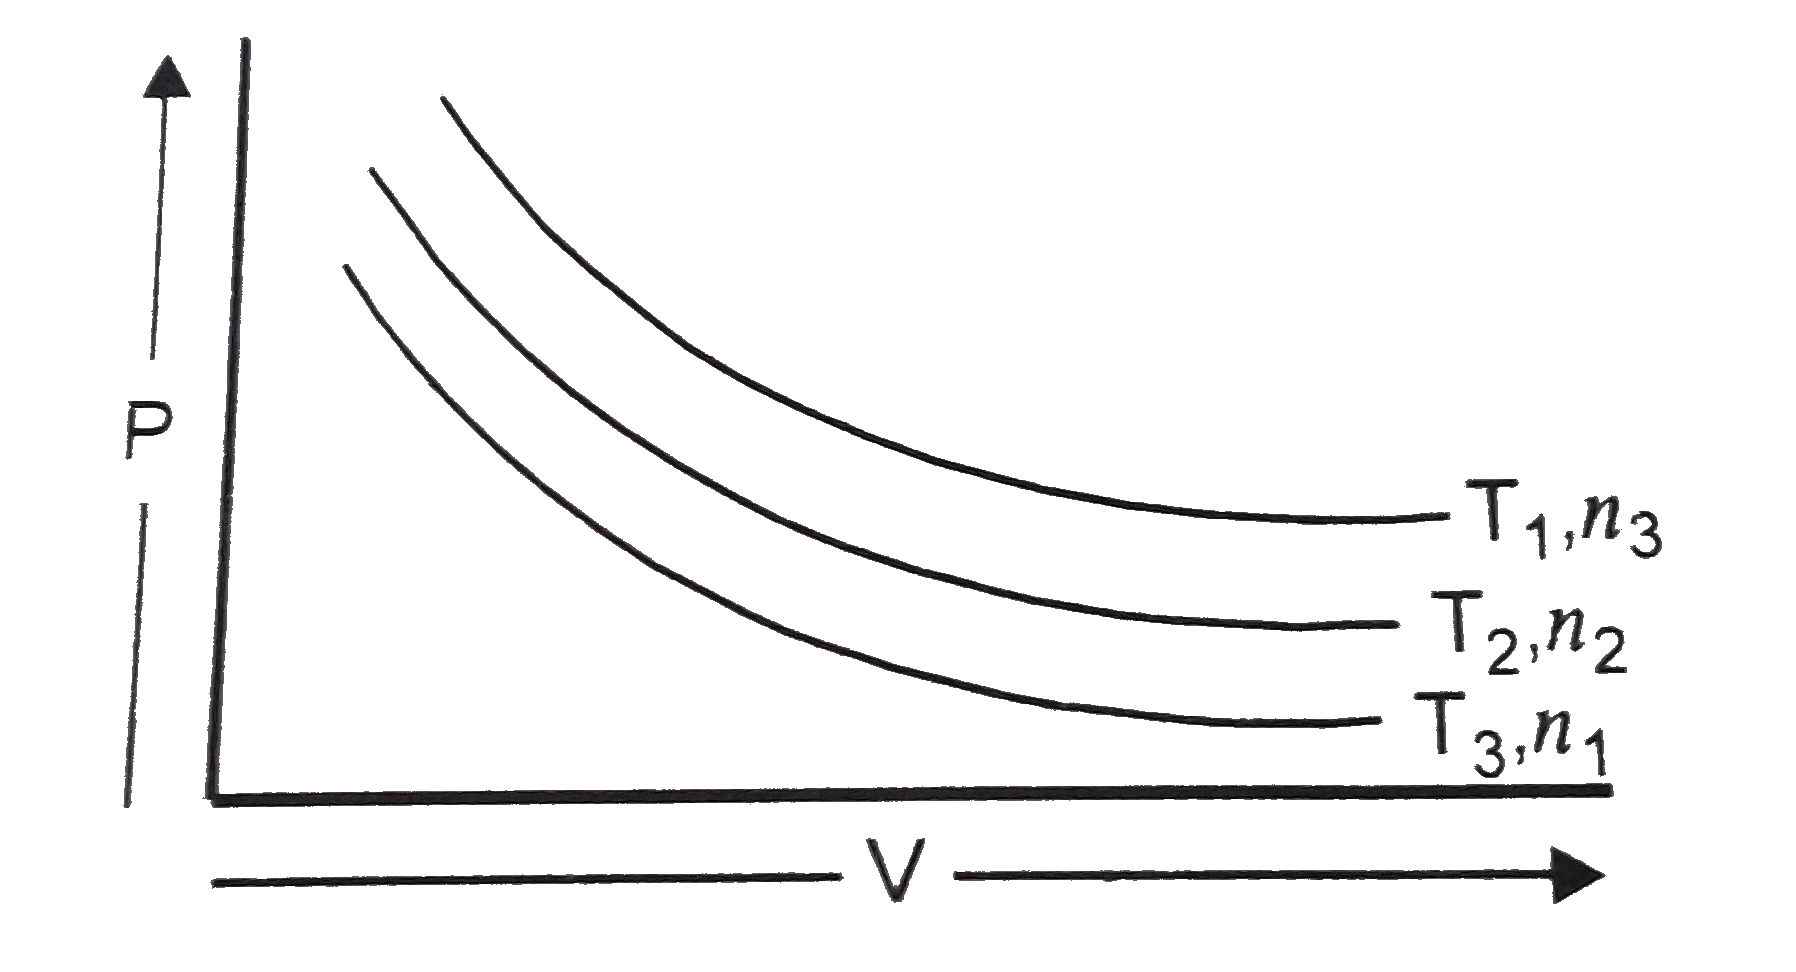
The correct relationship is/are
View Solution
Knowledge Check
The graph of PV vs P for a gas is
AparabolicBhyperbolicCa straight line parallel to X-axisDa straight line passing through origin
An ac source of emf V=V0sinωt is connected to a capacitor of capacitance C. Deduce the expression for the current (I) flowing in it. Plot the graph of (i) Vvs.ωt,and (ii) Ivs.ωt
View SolutionStarting at x=0, a particle moves according to the graph of v vs t shown in . Sketch a staph of the instantaneoud acceleration a vs t, indicationg numerical values at significant points of the graph.
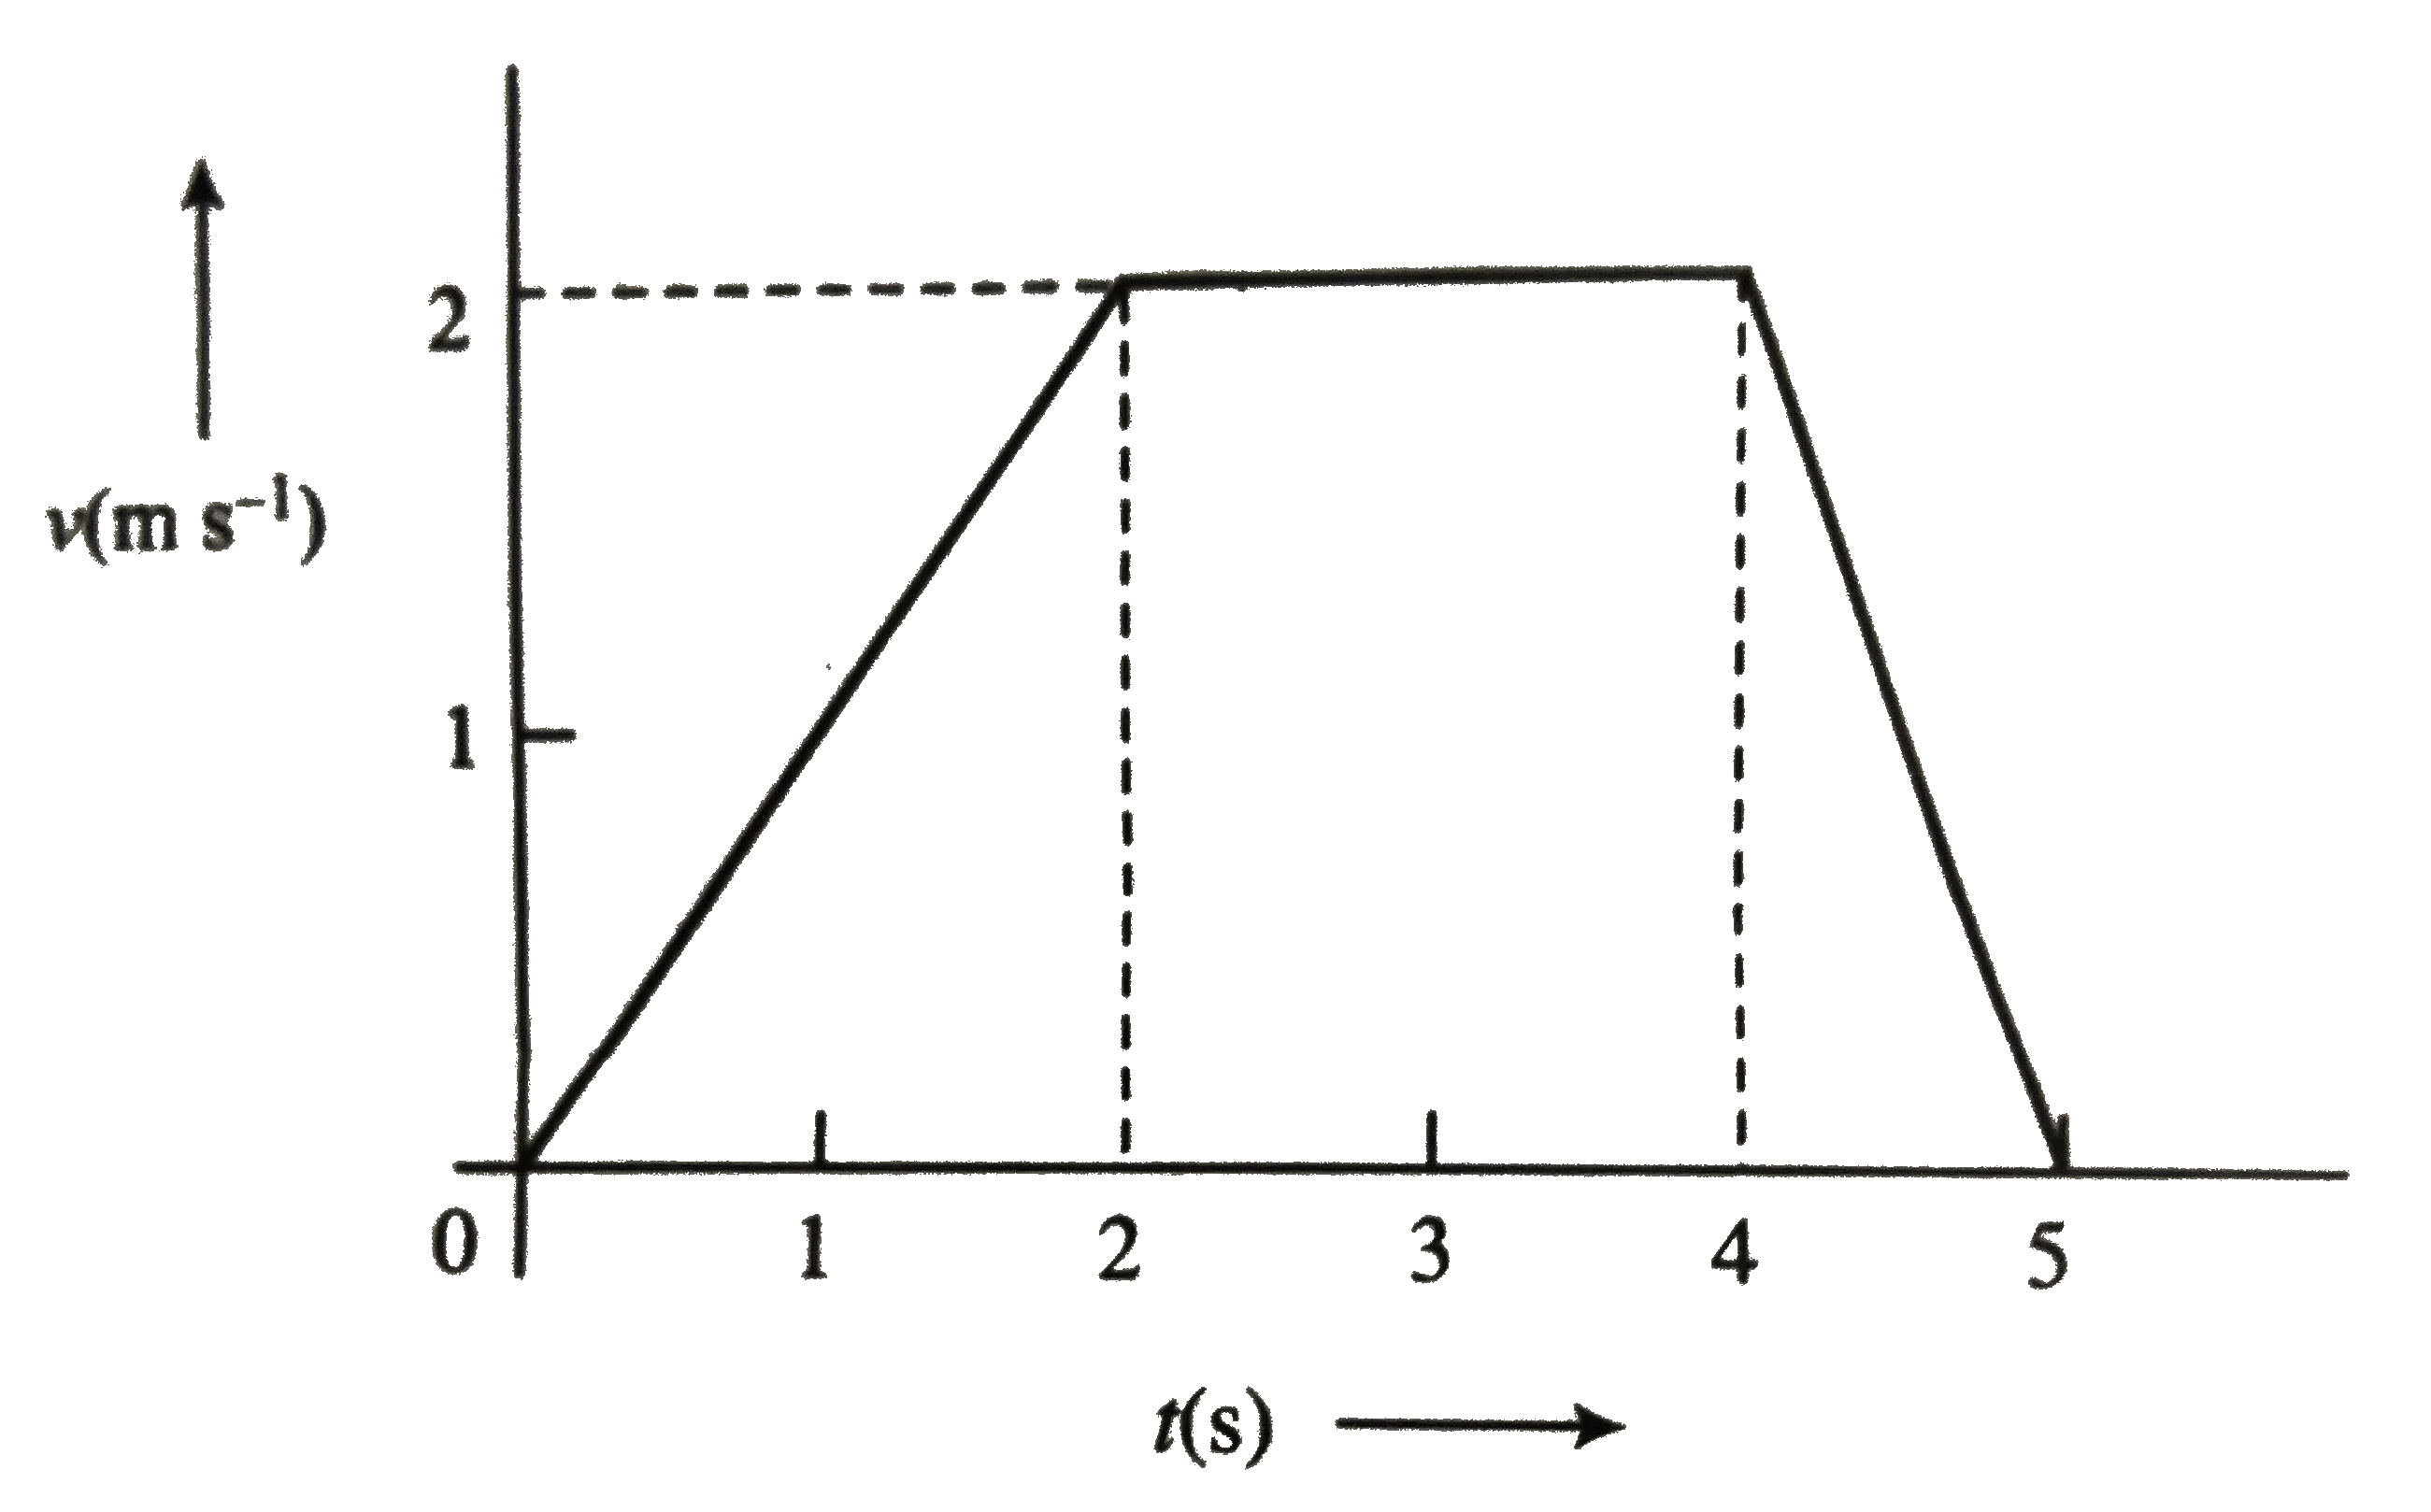 .
.
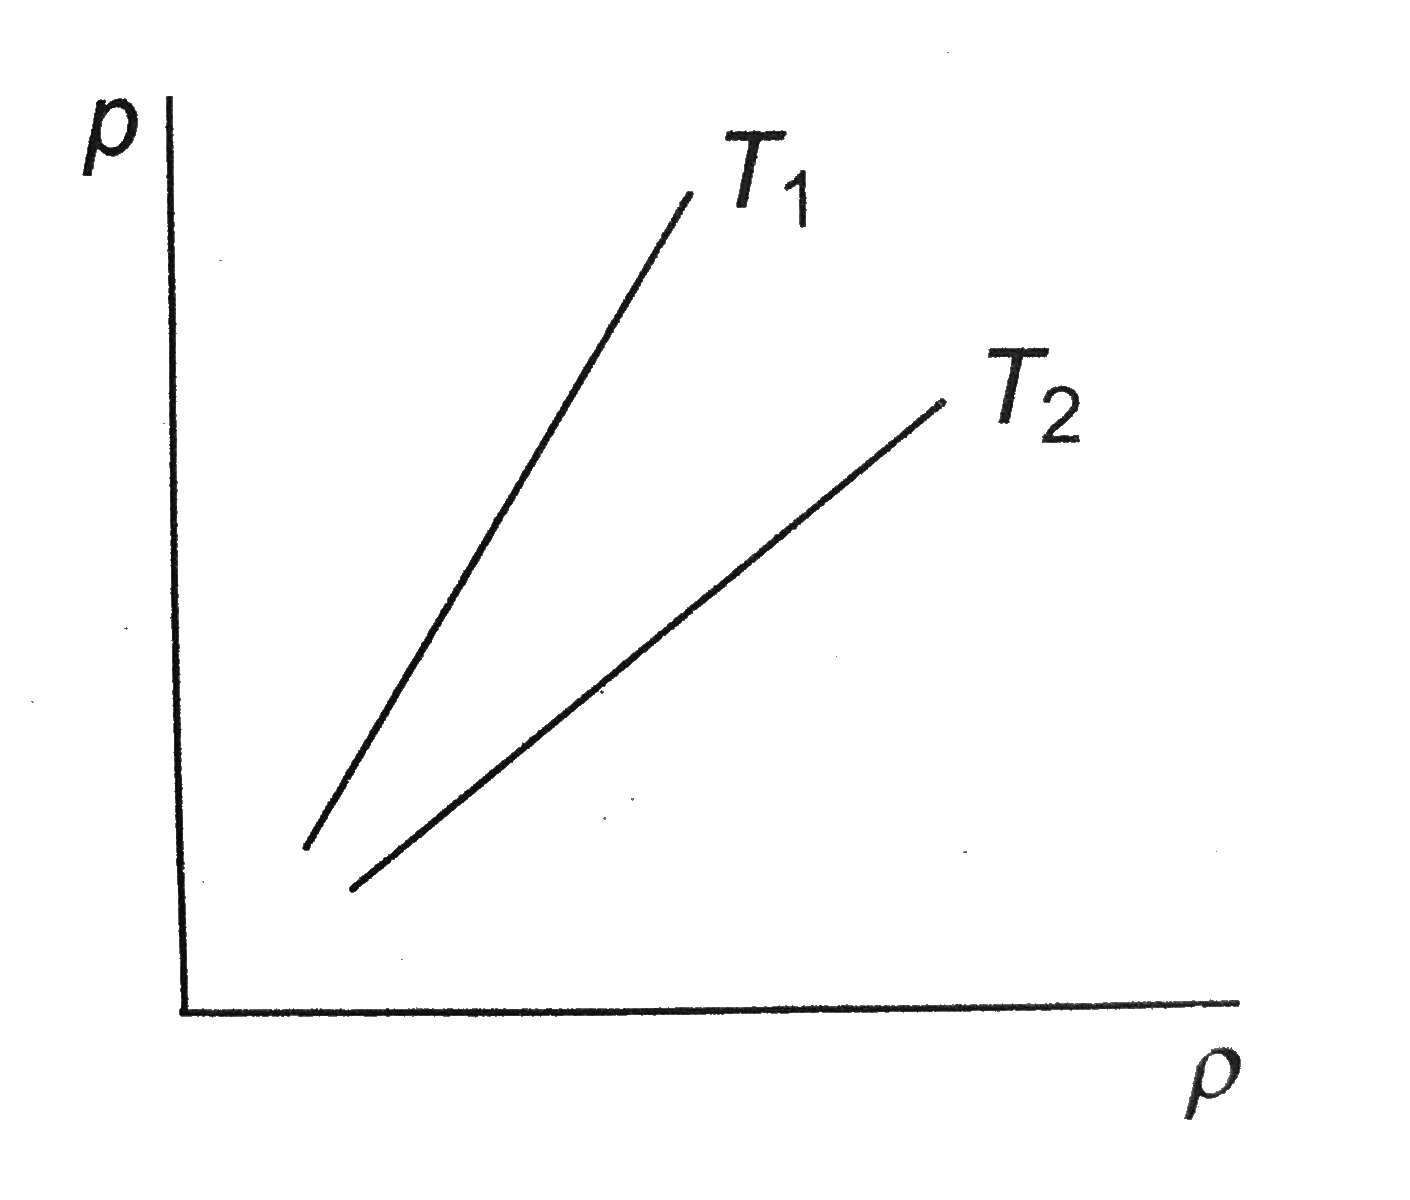
View SolutionFigure shows graphs of pressure vs density for an ideal gas at two temperature T1andT2. Which of the following is correct?
View SolutionThe graph of P vs V is given at different temperature
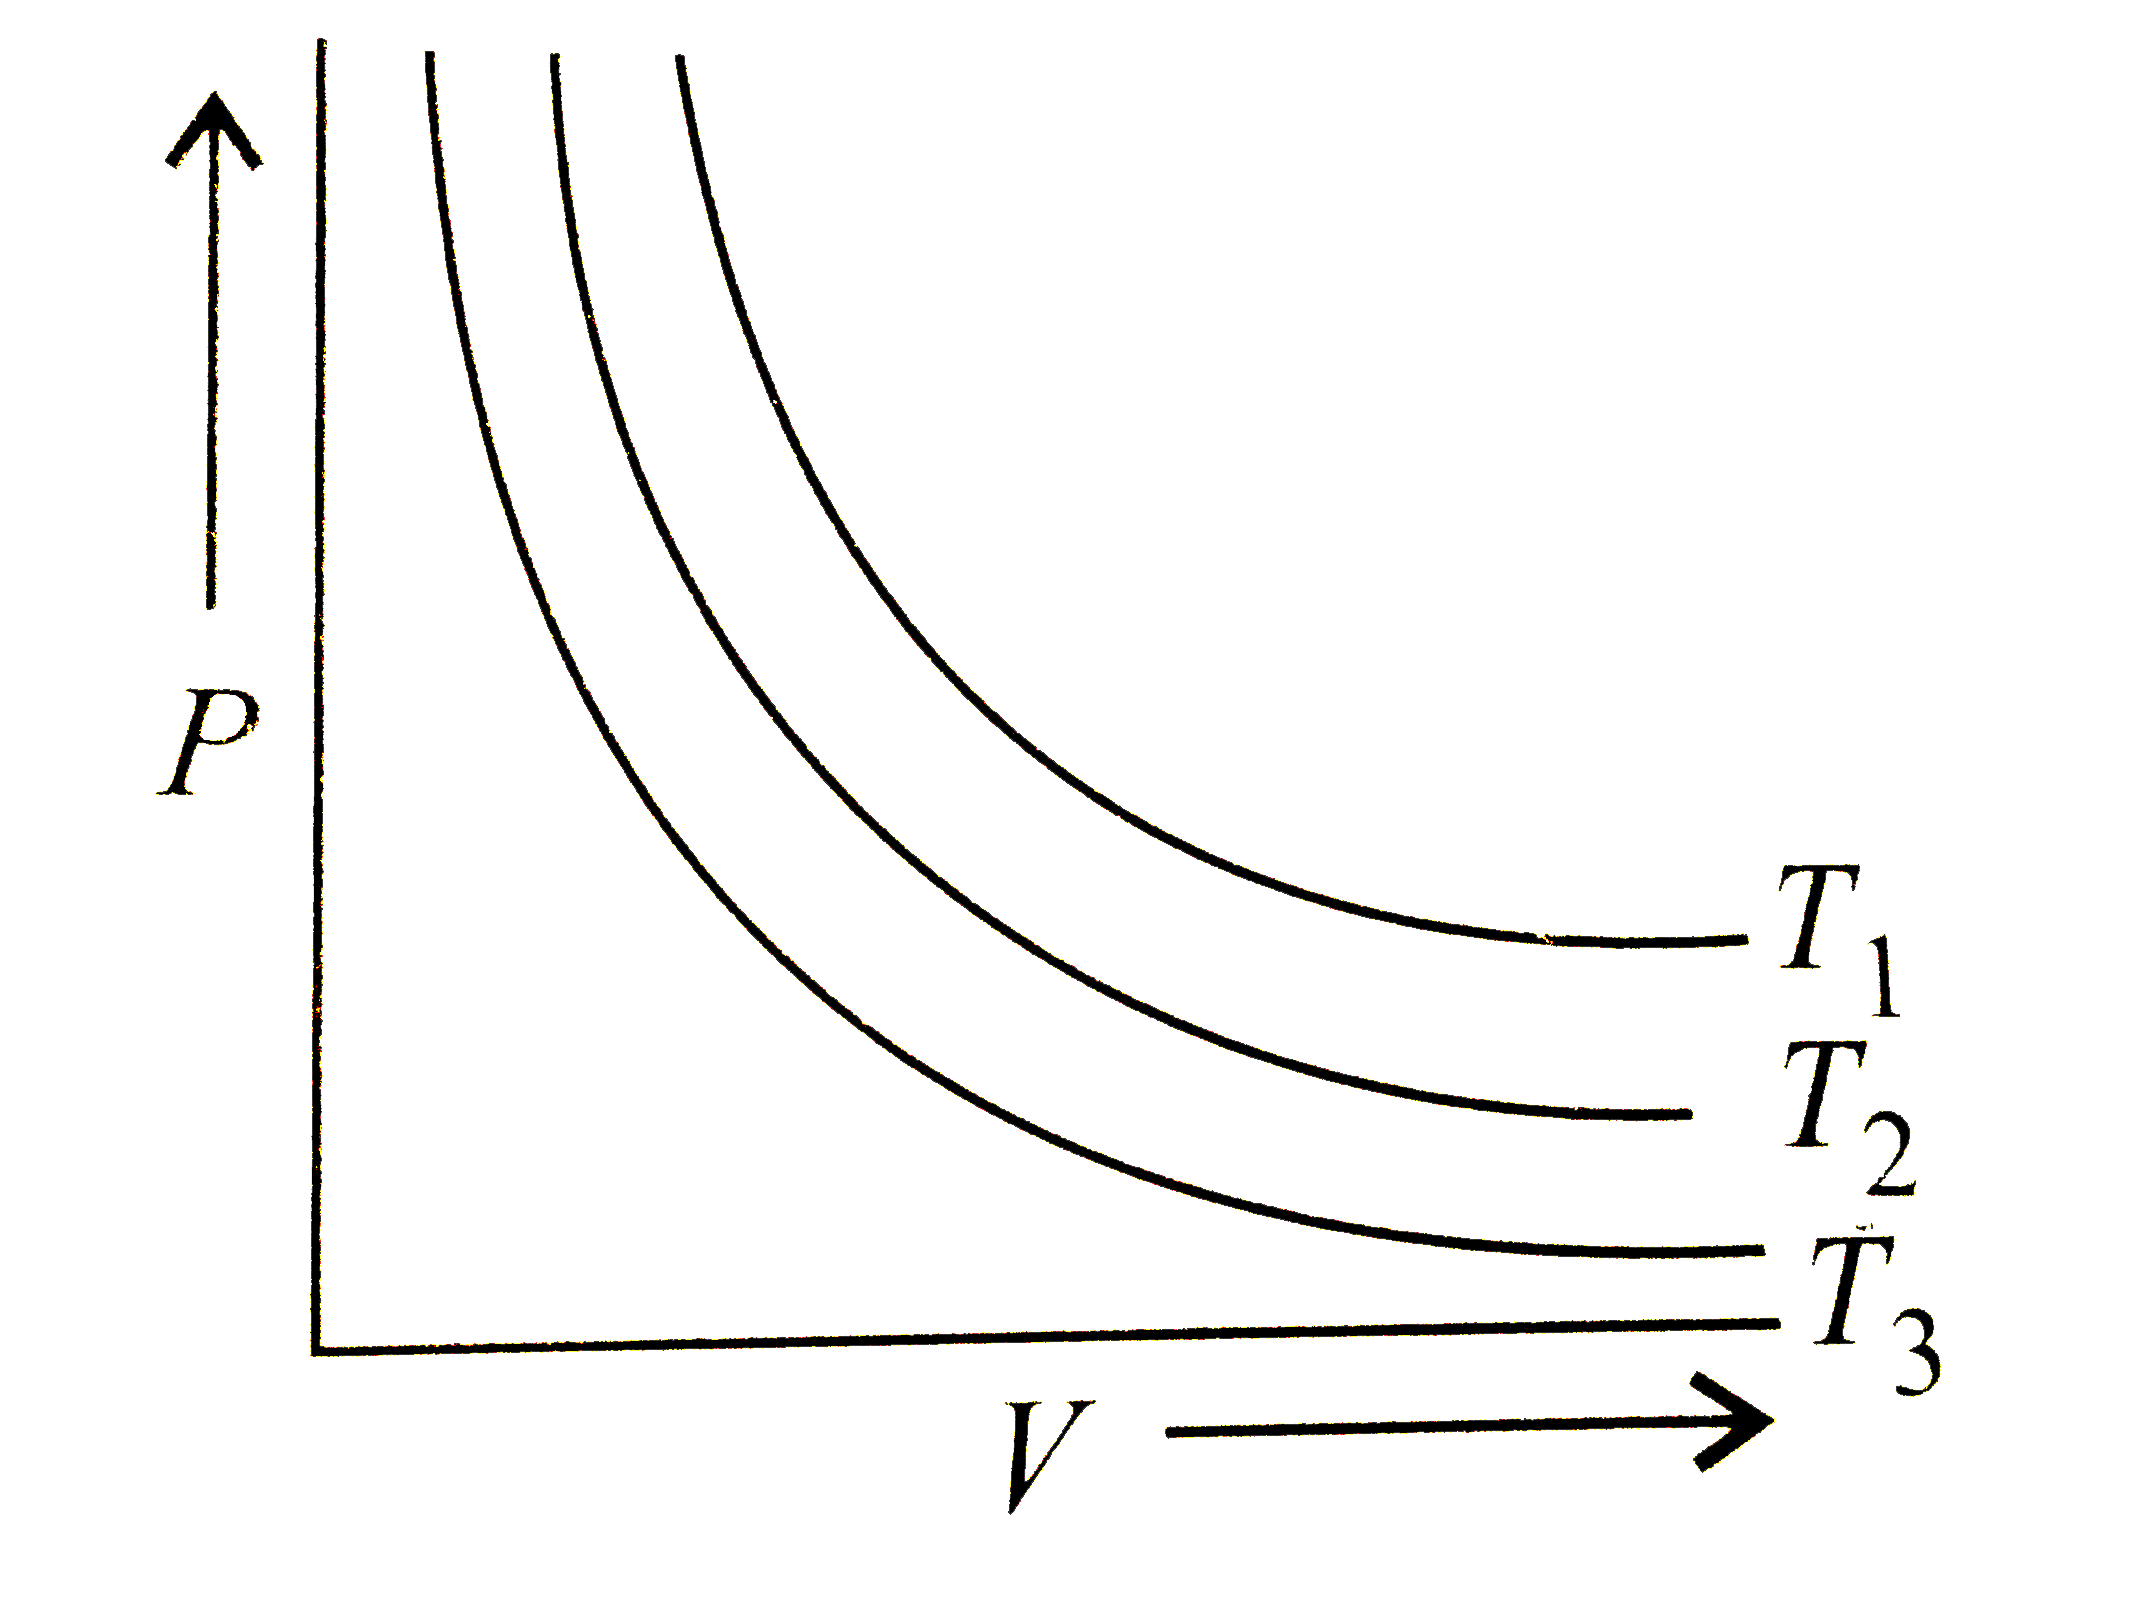
The correct relationship is
View SolutionA (current vs time) graph of the current passing through a solenoid is shown in Fig. For which time is the back electromotive force (u) a maximum? If the back emf t = 3 s is e, find the back emf at t = 7 s, 15 s and 40 s OA, AB and BC are straight line segments.

View SolutionA graph plotted between Pdvsd (where p is osmotic pressure of solution of a solute of mol. Wt. m and d is its density temperature T. Pick out the correct statements about the plots :
View SolutionThe graph between PV vs P at constant temperature is linear parallel to the pressure axis.
View Solution
