At two different temperature T1andT2,(T2>T1), draw two PV-P graphs for a definite amount of an ideal gas.Solution in Bengali
Step by step video & image solution for At two different temperature T_(1) and T_(2), (T_(2) gt T_(1)), draw two PV-P graphs for a definite amount of an ideal gas. by Chemistry experts to help you in doubts & scoring excellent marks in Class 11 exams.
Topper's Solved these Questions
- BOOK - CHHAYA PUBLICATIONCHAPTER - STATES OF MATTER : GASES AND LIQUIDSEXERCISE - EXERCISE (NUMBERICAL PROBLEMS)56videos
STATES OF MATTER : GASES AND LIQUIDS
- BOOK - CHHAYA PUBLICATIONCHAPTER - STATES OF MATTER : GASES AND LIQUIDSEXERCISE - PRACTICE SET10videos
STATES OF MATTER : GASES AND LIQUIDS
- BOOK - CHHAYA PUBLICATIONCHAPTER - STATES OF MATTER : GASES AND LIQUIDSEXERCISE - EXERCISE (FILL IN THE BLANKS)13videos
STATES OF MATTER : GASES AND LIQUIDS
- BOOK - CHHAYA PUBLICATIONCHAPTER - SOME BASIC CONCEPTS OF CHEMISTRYEXERCISE - PRACTICE SET13videos
SOME BASIC CONCEPTS OF CHEMISTRY
- BOOK - CHHAYA PUBLICATIONCHAPTER - STRUCTURE OF ATOMEXERCISE - PRACTICE SET15videos
STRUCTURE OF ATOM
Similar Questions
At 10−3mm pressure and 300 K, a 2L flask contains equal numbers of moles of N2 and water vapour. (i) what is the total number of moles of N2 and water vapour in the mixture ? (ii) what is the total mass of the mixture?
01:39View SolutionMaximum deviation from ideal gas is expected in case of-
03:51View Solution0.1 ATM=_____Pa=_______torr.
01:07View SolutionWhat do you mean by semimolar NaOH solution?
View SolutionWhat accelerating potential is needed to produce an electron beam with an effective wavelength of 0.090Å-
01:48View SolutionFigure shows graphs of pressure versus density for an ideal gas at two temperatures T_(1) and T_(2) Which is correct ? .
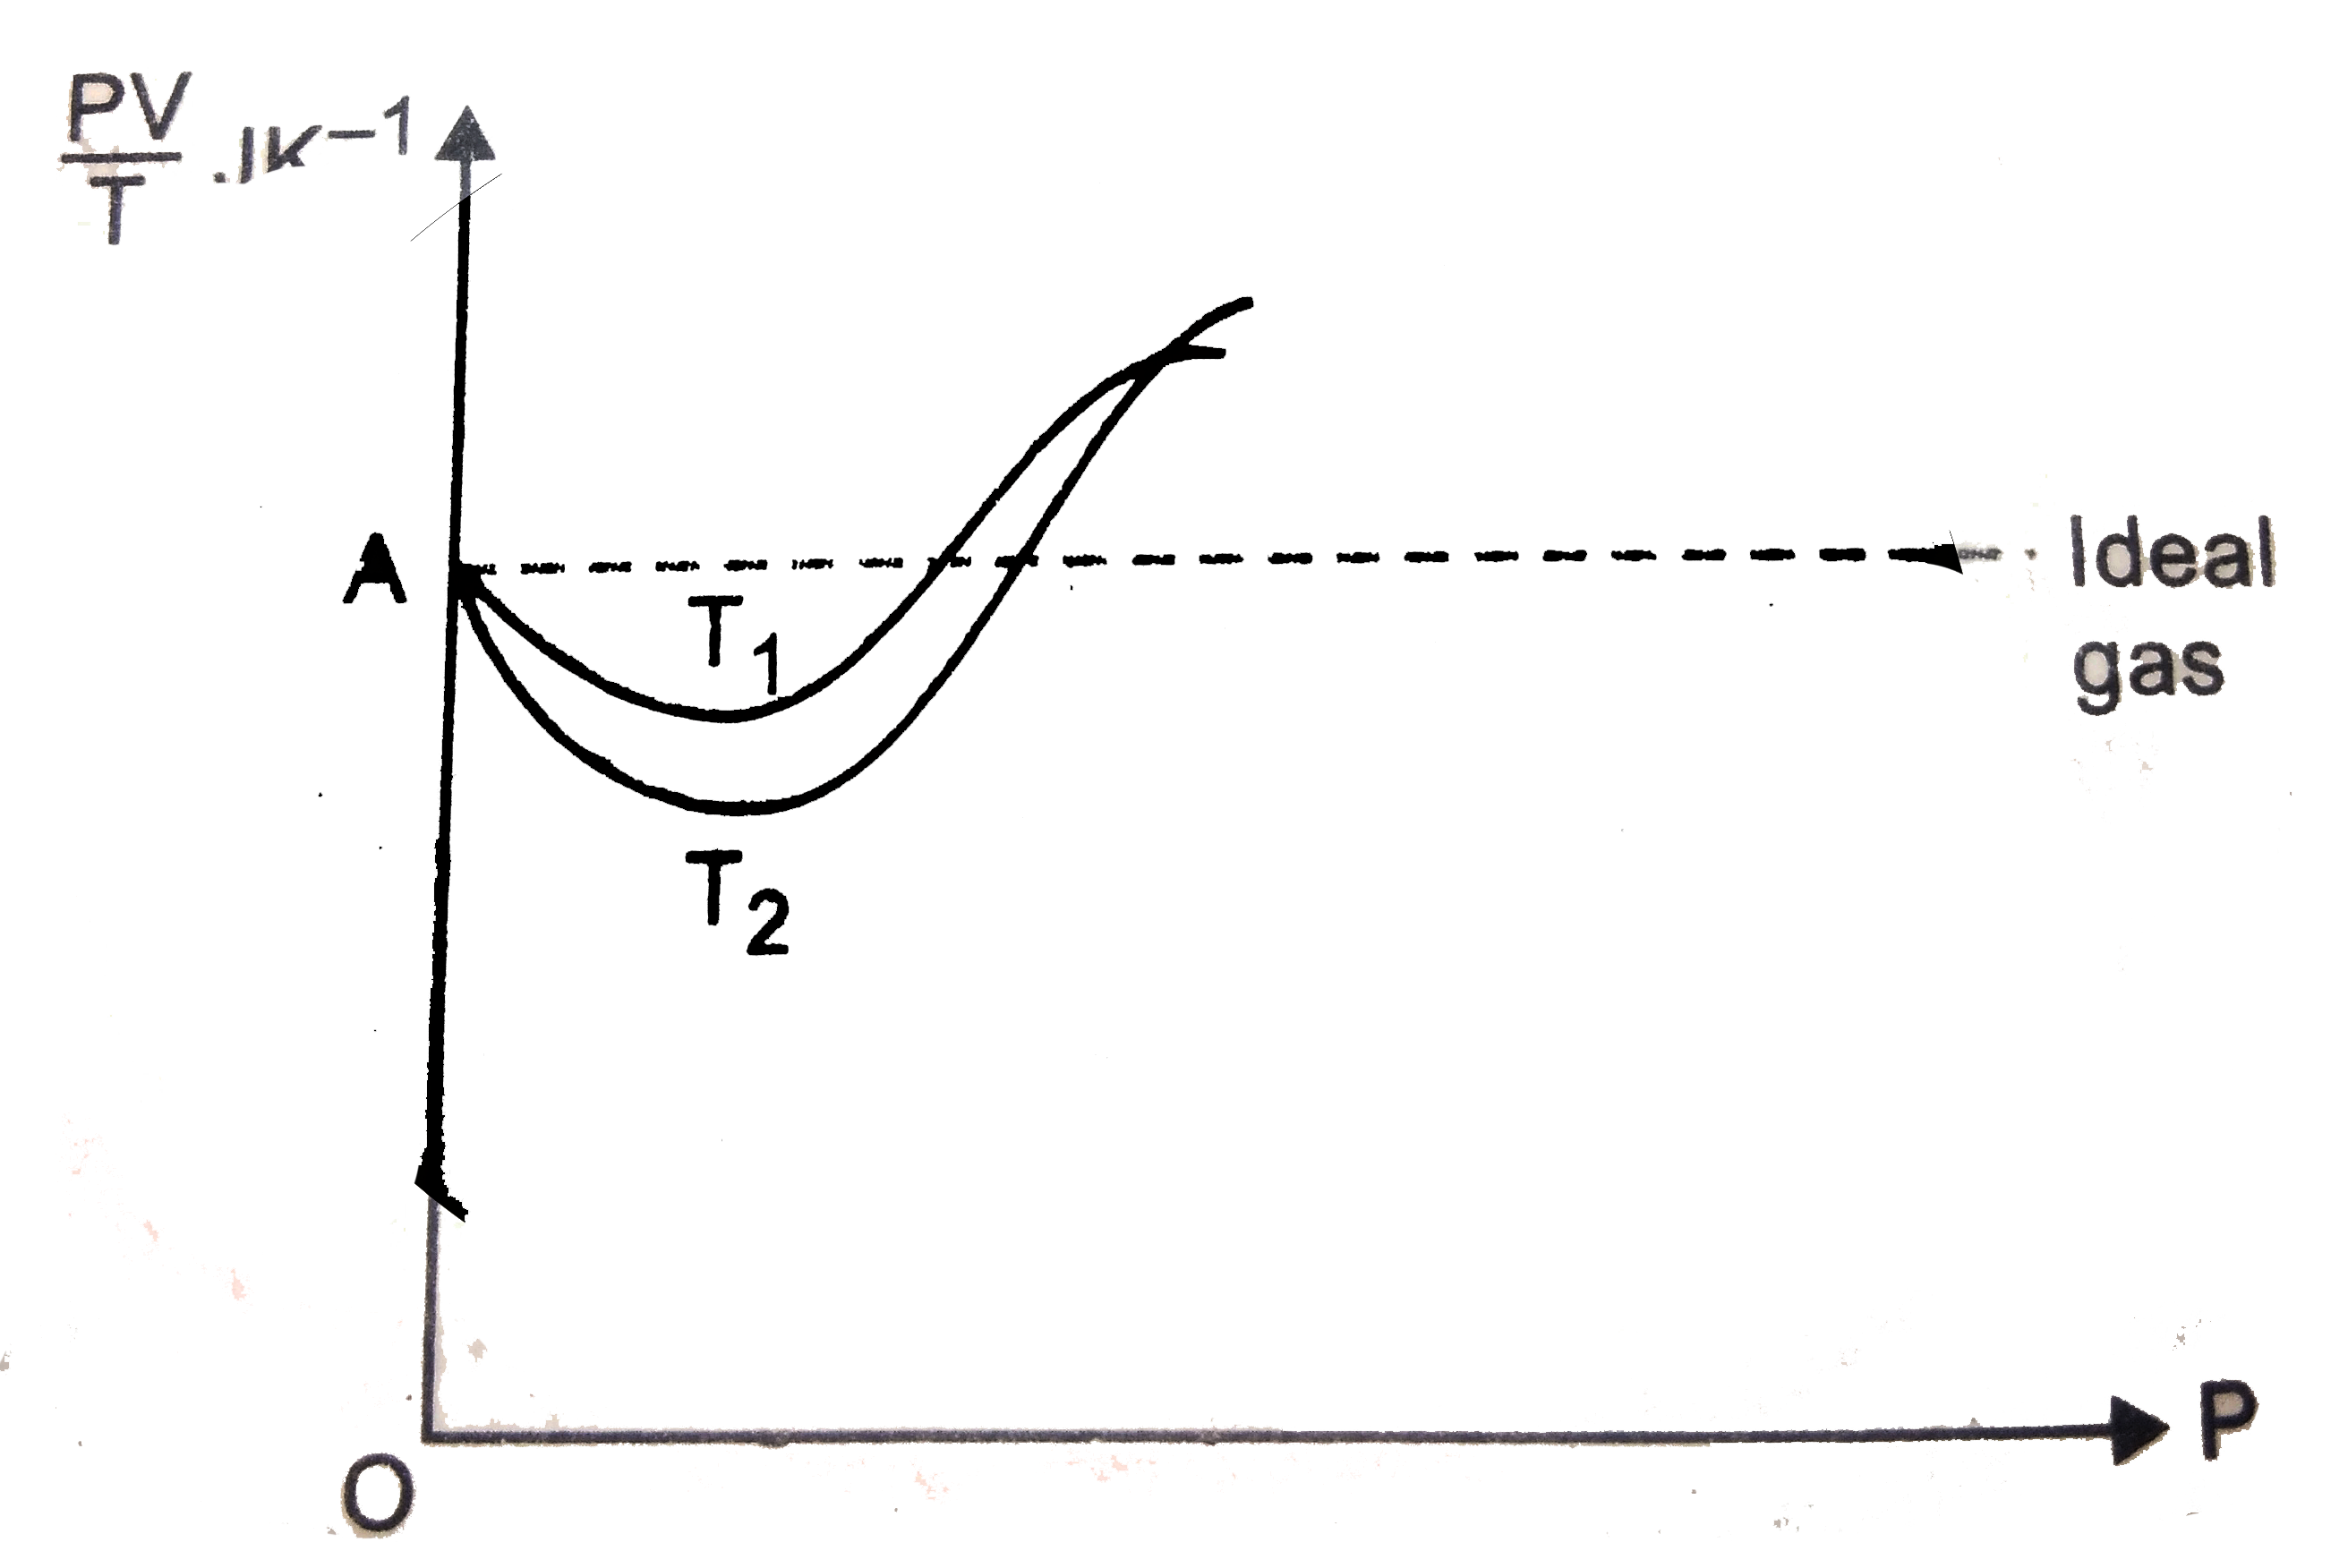
04:47View SolutionGiven is the graph between PVT and P for 1 gm of oxygen gas at two different temperatures T1andT2 Fig. Given, density of oxygen =1.427kgm−3. The value of (PV)/(T) at the point A and the relation between T1andT2 are respectively :
 01:31View Solution
The stress-strain graph for a metallic wire is shown at two different temperature, T_(1) and T_(2) which temperature is high T_(1) or T_(2) ?
03:27View SolutionThe p-V diagrams of same mass of a gas are drawn at two different temperatues T_(1) and T_(2) Explain whether T_(1)gtT_(2)gt or T_(2)gtT_(1).
04:00View SolutionFigure shows graphs of pressure vs density for an ideal gas at two temperatures Tt and T2
View Solutionदो पिण्ड विभिन्न तापों T1 व T2 पर हैं । यदि उन्हें उष्मीय संपर्क में लाया जाये, तो आवश्यक नहीं वे औसत ताप (T1+T2)/2 पर स्थिर हों । क्यों?
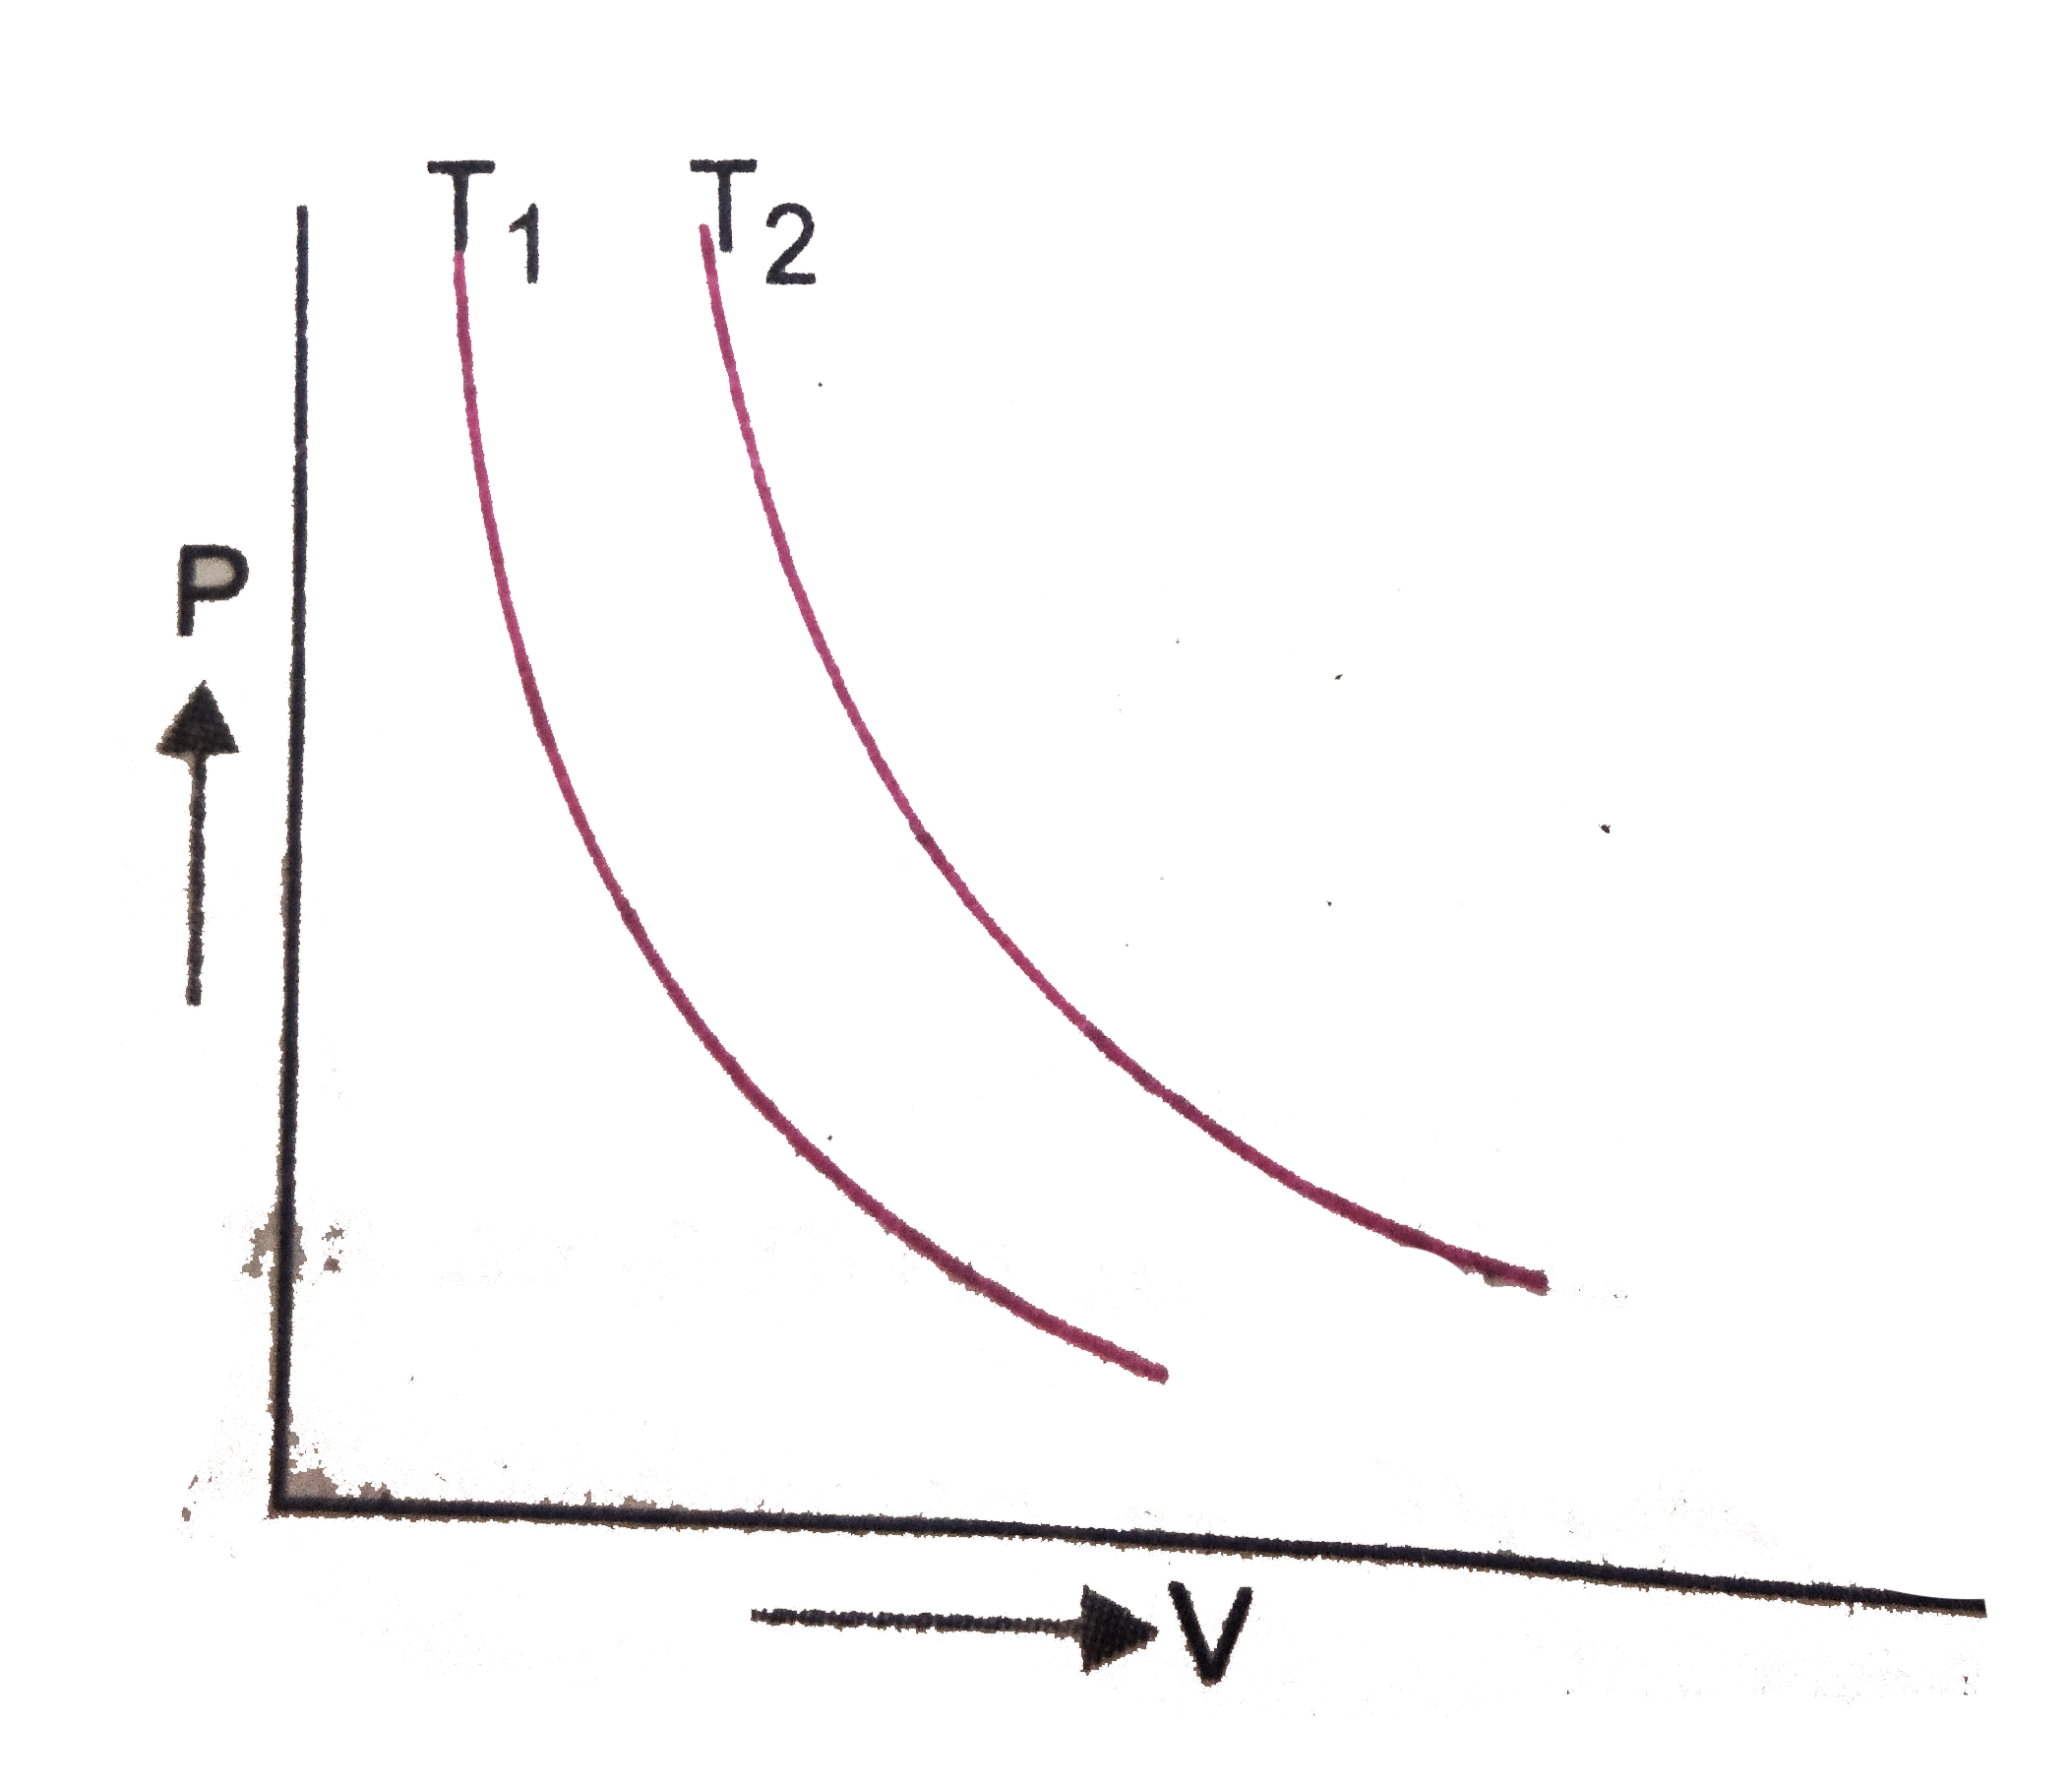
03:04View SolutionIsothermal curves for a given mass of gas are shown at two different temperture T1andT2 in Fig. State whether T1>T2orT2>T1. Justify your answer.
 02:38View Solution
The following graph respresent the pressure versus number density for ideal gas at two different temperature T1andT2. The graph implies ................. .
05:06View Solutionनिम्न चित्रों में T1 तथा T2(T2>T1) ताप पर कृष्ण वस्तु हेतु ऊर्जा वितरण दर्शाये गये हैं, कौन सा ग्राफ सही है
04:15View SolutionIf two bodies at different temperatures T1 and T2 are brought in thermal contact, the mean temperature T1+T22. When
03:51View Solution

