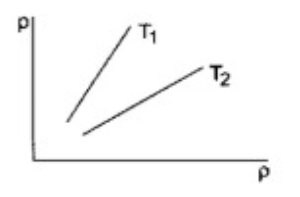
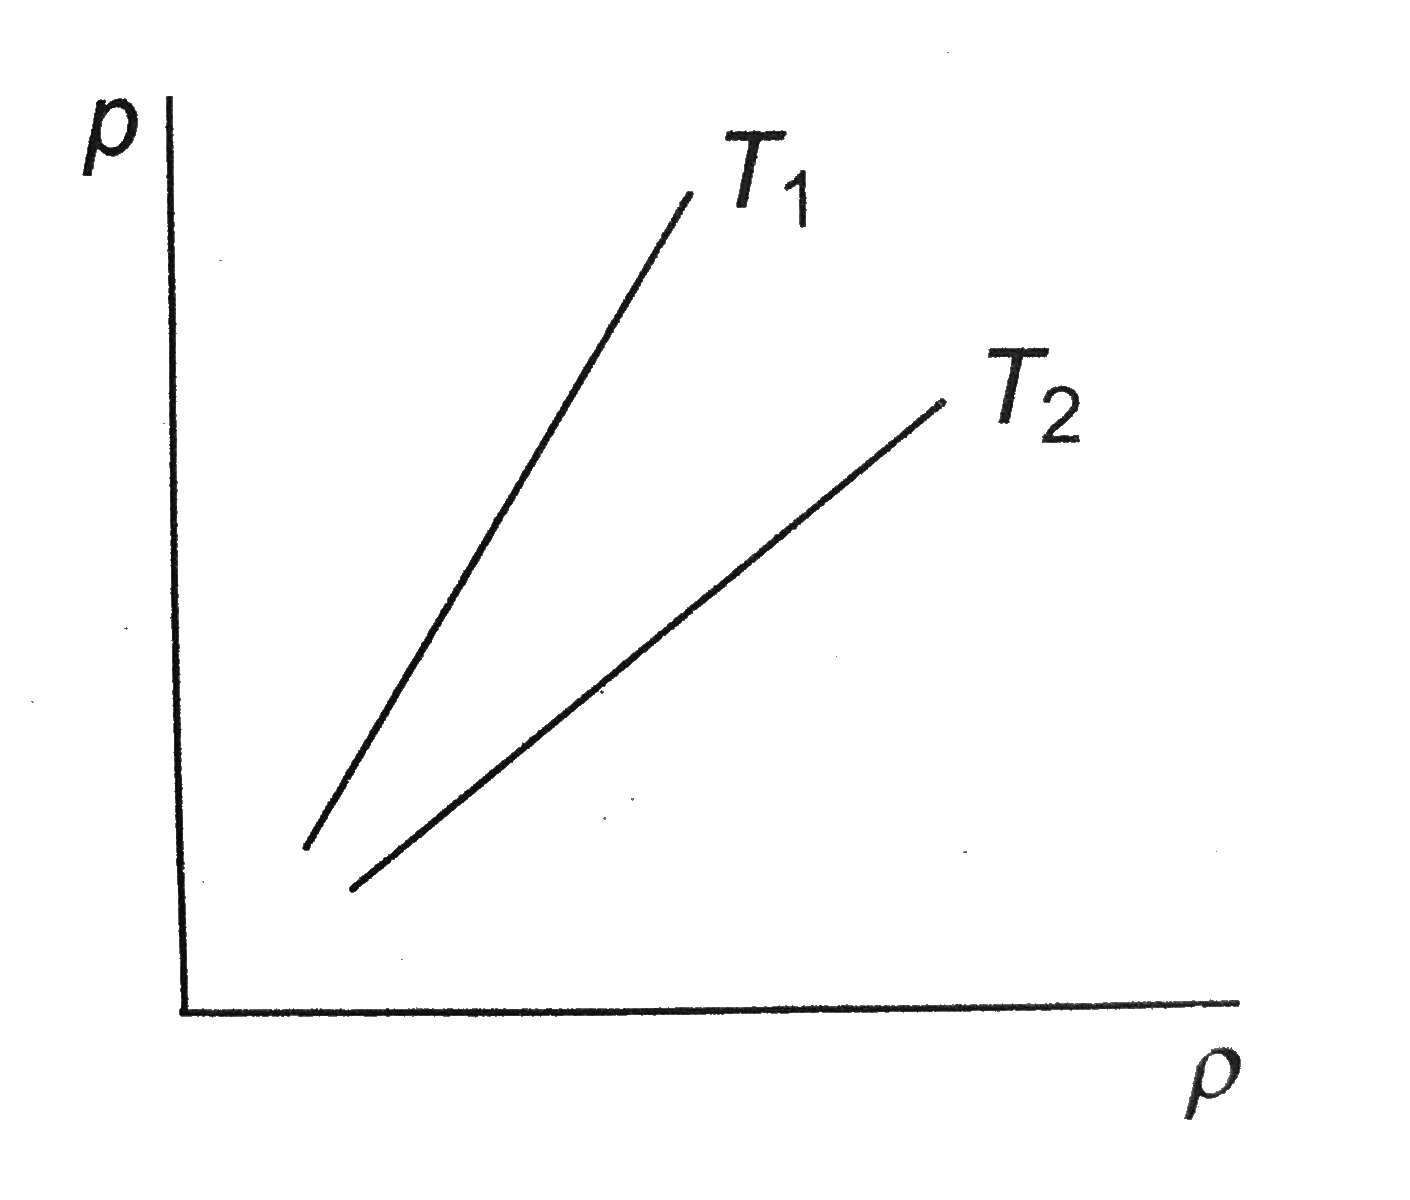
The following graph respresent the pressure versus number density for ideal gas at two different temperature T1andT2. The graph implies ................. .Solution in Tamil
T1=T2
T1>T2
T1<T2
connot be determined
The correct Answer is:B
Step by step video, text & image solution for The following graph respresent the pressure versus number density for ideal gas at two different temperature T_(1) and T_(2). The graph implies ................. . by Physics experts to help you in doubts & scoring excellent marks in Class 11 exams.
Topper's Solved these Questions
- BOOK - FULL MARKSCHAPTER - KINETIC THEORY OF GASESEXERCISE - Textual Evaluation Solved (II. Short Answer Question)13videos
KINETIC THEORY OF GASES
- BOOK - FULL MARKSCHAPTER - KINETIC THEORY OF GASESEXERCISE - Textual Evaluation Solved (III Long Answer Question)8videos
KINETIC THEORY OF GASES
- BOOK - FULL MARKSCHAPTER - KINETIC THEORY OF GASESEXERCISE - Addtional Numerical Problems10videos
KINETIC THEORY OF GASES
- BOOK - FULL MARKSCHAPTER - KINEMATICSEXERCISE - ADDITIONAL QUESTIONS SOLVED (LONG ANSWER QUESTIONS)10videos
KINEMATICS
- BOOK - FULL MARKSCHAPTER - LAW OF MOTION EXERCISE - ADDITIONAL QUESTIONS SOLVED (SHORT ANSWER QUESTIONS (3 MARKS & NUMERICALS))16videos
LAW OF MOTION
Similar Questions
What is the microscopic origin of pressure?
01:55View SolutionWrite down the postulates of kinetic theory of gases.
02:14View SolutionIf the rms speed of hydrogen molecules at 300K is1930ms−1. Then what is the rms speed of oxygen molecules at 1200K.
03:02View SolutionExplain the types of motion with example
01:39View SolutionA block of mass 500 g is at rest on a horizontal table. What steady force is required to give the block a velocity of 200cms−1 in 4 s?
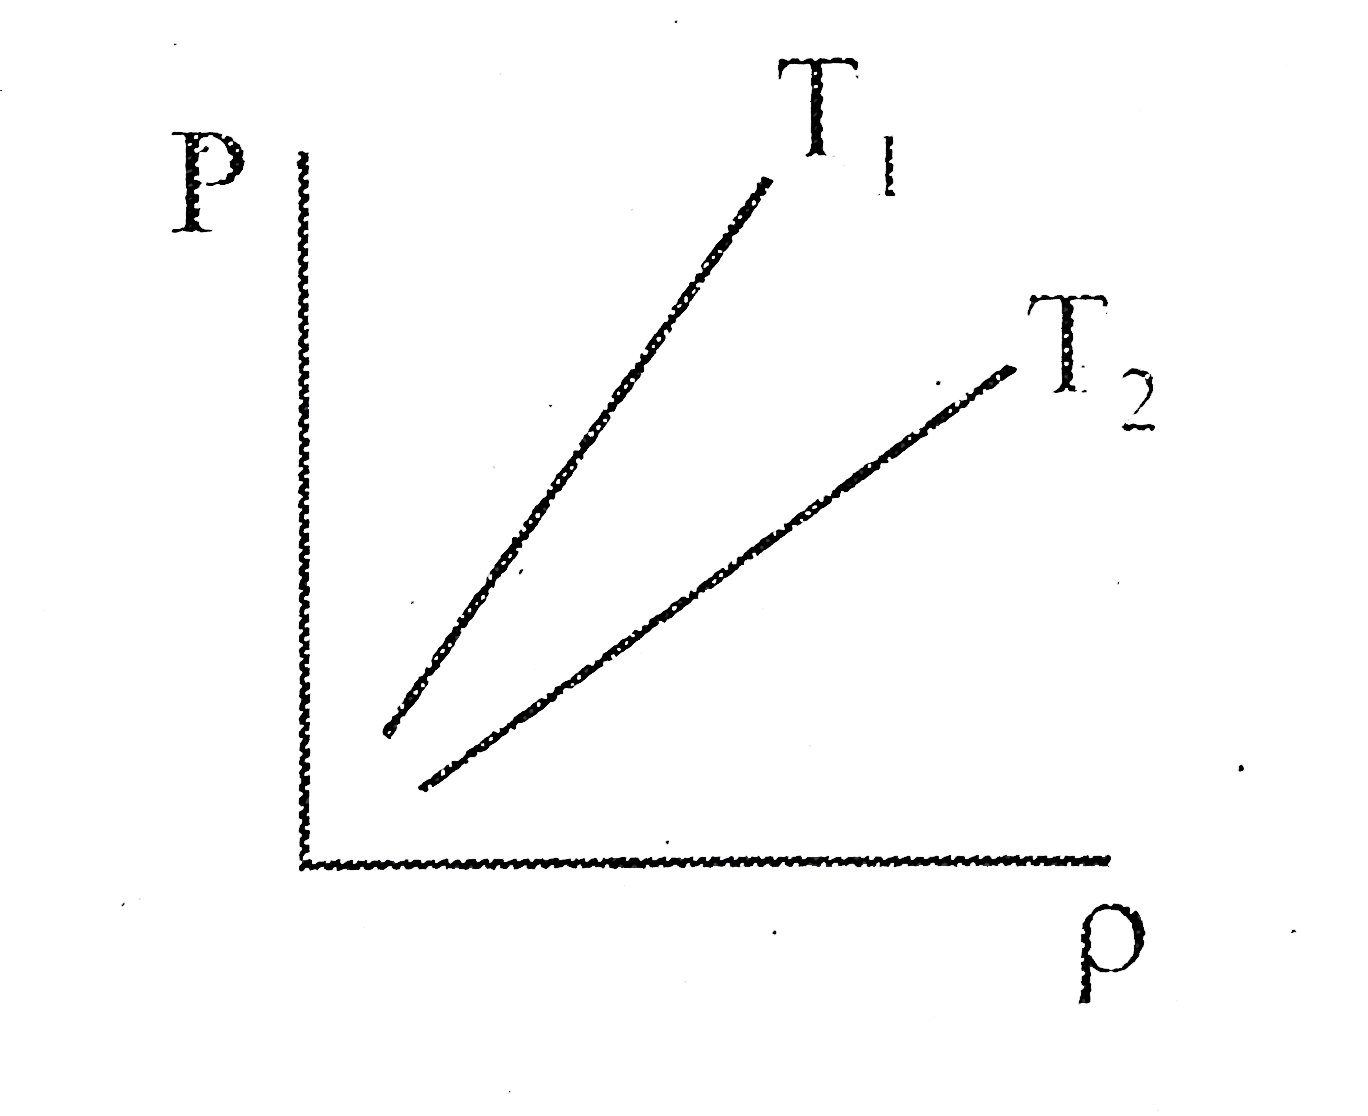
01:07View SolutionShows graphs of pressure vs density for an ideal gas at two temperaturesT1andT2
 01:48View Solution
Pressure versus temperature graph of an ideal gas as shown in Fig. Corresponding density (rho) versus volume (V) graph will be
02:36View SolutionFigure shows graphs of pressure vs density for an ideal gas at two temperature T1andT2. Which of the following is correct?
 01:27View Solution
Figure shows graphs of pressure versus density for an ideal gas at two temperatures T_(1) and T_(2) Which is correct ? .
02:50View SolutionThe stress-strain graph for a metallic wire is shown at two different temperature, T_(1) and T_(2) which temperature is high T_(1) or T_(2) ?
04:15View SolutionFigure shows graphs of pressure vs density for an ideal gas at two temperatures Tt and T2
03:51View SolutionFigure shows graphs of pressure vs density for an ideal gas at two temperature T1 and T2 . Which of the following is correct ?
 03:01View Solution
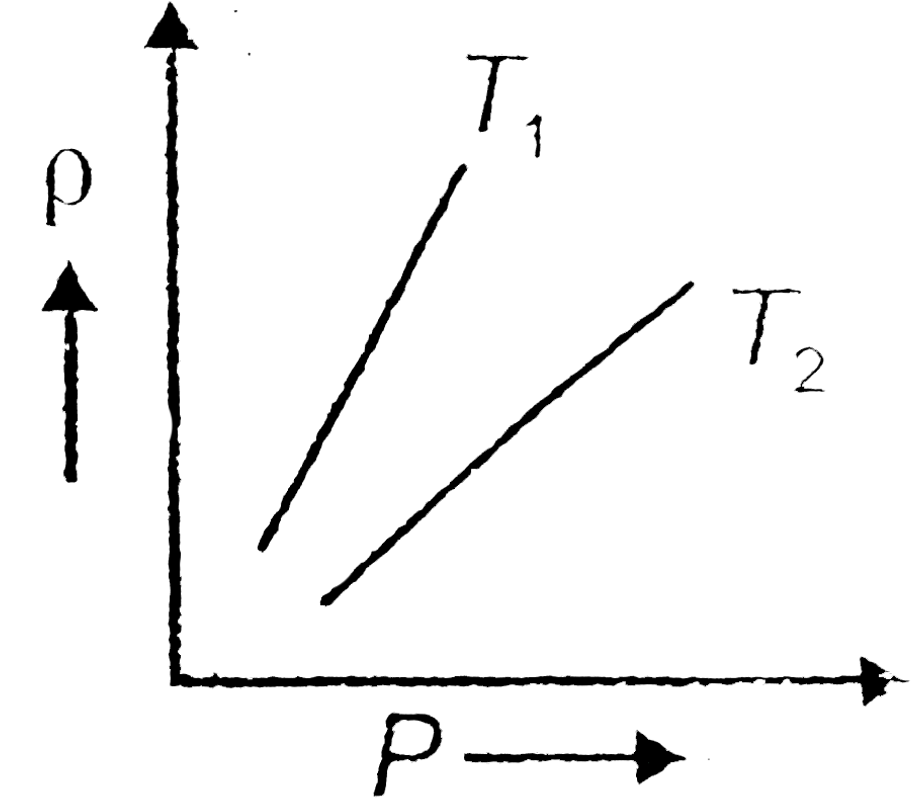
The density (ρ) versus pressure (P) graphs of a given mass of an ideal gas is shown at two temperatures T1andT2. Then relation between T1andT2 may be
 05:03View Solution
At two different temperature T_(1) and T_(2), (T_(2) gt T_(1)) , draw two PV-P graphs for a definite amount of an ideal gas.
02:19View SolutionThe stress-strain graph for a metallic wire is shown at two different temperature, T_(1) and T_(2) which temperature is high T_(1) or T_(2) ?
03:14View Solution

