The resistance t R of a conductor varies with temperature t as shown in the figure. If the variation is represented by Rt=R0[1+αt+βt2], then
![The resistance t R of a conductor varies with temperature t as shown in the figure. If the variation is represented by R(t) = R(0)[1+ alphat +betat^(2)], then](https://d10lpgp6xz60nq.cloudfront.net/physics_images/ERRL_PHY_NEET_V02_C19_E01_564_Q01.png)
α and β are both negative
α and β are both positive
α is positive and β is negative
α is negative and β are positive
The correct Answer is:B
Step by step video, text & image solution for The resistance t R of a conductor varies with temperature t as shown in the figure. If the variation is represented by R_(t) = R_(0)[1+ alphat +betat^(2)], then by Physics experts to help you in doubts & scoring excellent marks in Class 12 exams.
Topper's Solved these Questions
- BOOK - ERRORLESS CHAPTER - CURRENT ELECTRICITYEXERCISE - Kirchhoff s Law, cells8videos
CURRENT ELECTRICITY
- BOOK - ERRORLESS CHAPTER - CURRENT ELECTRICITYEXERCISE - Different Measuring Instruments1videos
CURRENT ELECTRICITY
- BOOK - ERRORLESS CHAPTER - COMMUNICATION SYSTEMEXERCISE - S E T14videos
COMMUNICATION SYSTEM
- BOOK - ERRORLESS CHAPTER - ELECTRO MAGNETIC INDUCTIONEXERCISE - SET20videos
ELECTRO MAGNETIC INDUCTION
Similar Questions
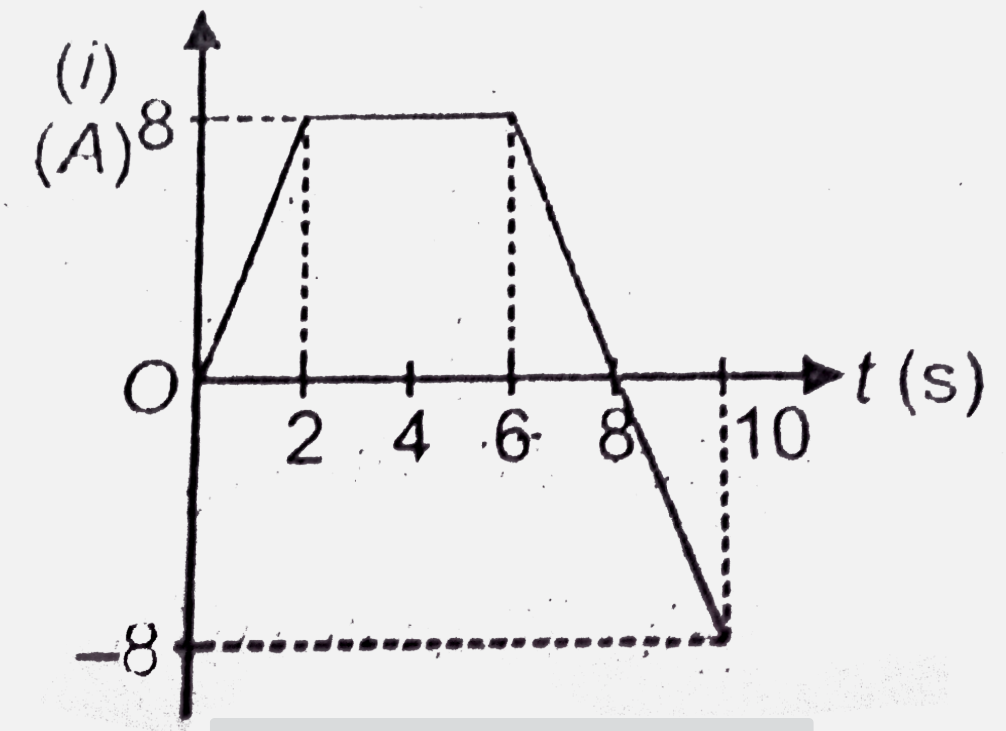
The current I through a conductor varies with time t as shown in figure. The average electric current during t=0 to t=10 s will be
 View Solution
A plarinum resistance thermometer is condtructed which resds ,00 at ice point and 1000 at steam point. Let tpde¬etemoeratureonthissca≤and≤ttde¬ethetemperatureonametcuryonamercurythemomentersca≤.Theresistanceoftheplat∈umcoilvareswithtasR_1 = R_0 (1+alphat + betat^2).DeriveanexpressionfortheresistanceasafunctionofT_p.
View Solution
Knowledge Check
- Question 1 - Select One
Choose the most appropriate option.
The resistance R of a conductor varies with temperature t as shown in figure. If the variation is represented by Rt=R0(1+αt+βt2).
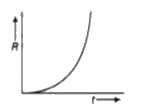
ThenAαandβ bothe negativeBα is positive and β is negativeCαandβ both are positiveDα is negative and β is negative - Question 2 - Select One or More
The ednsity (ρ) of an ideal gas varies with temperature T as shown in figure. Then
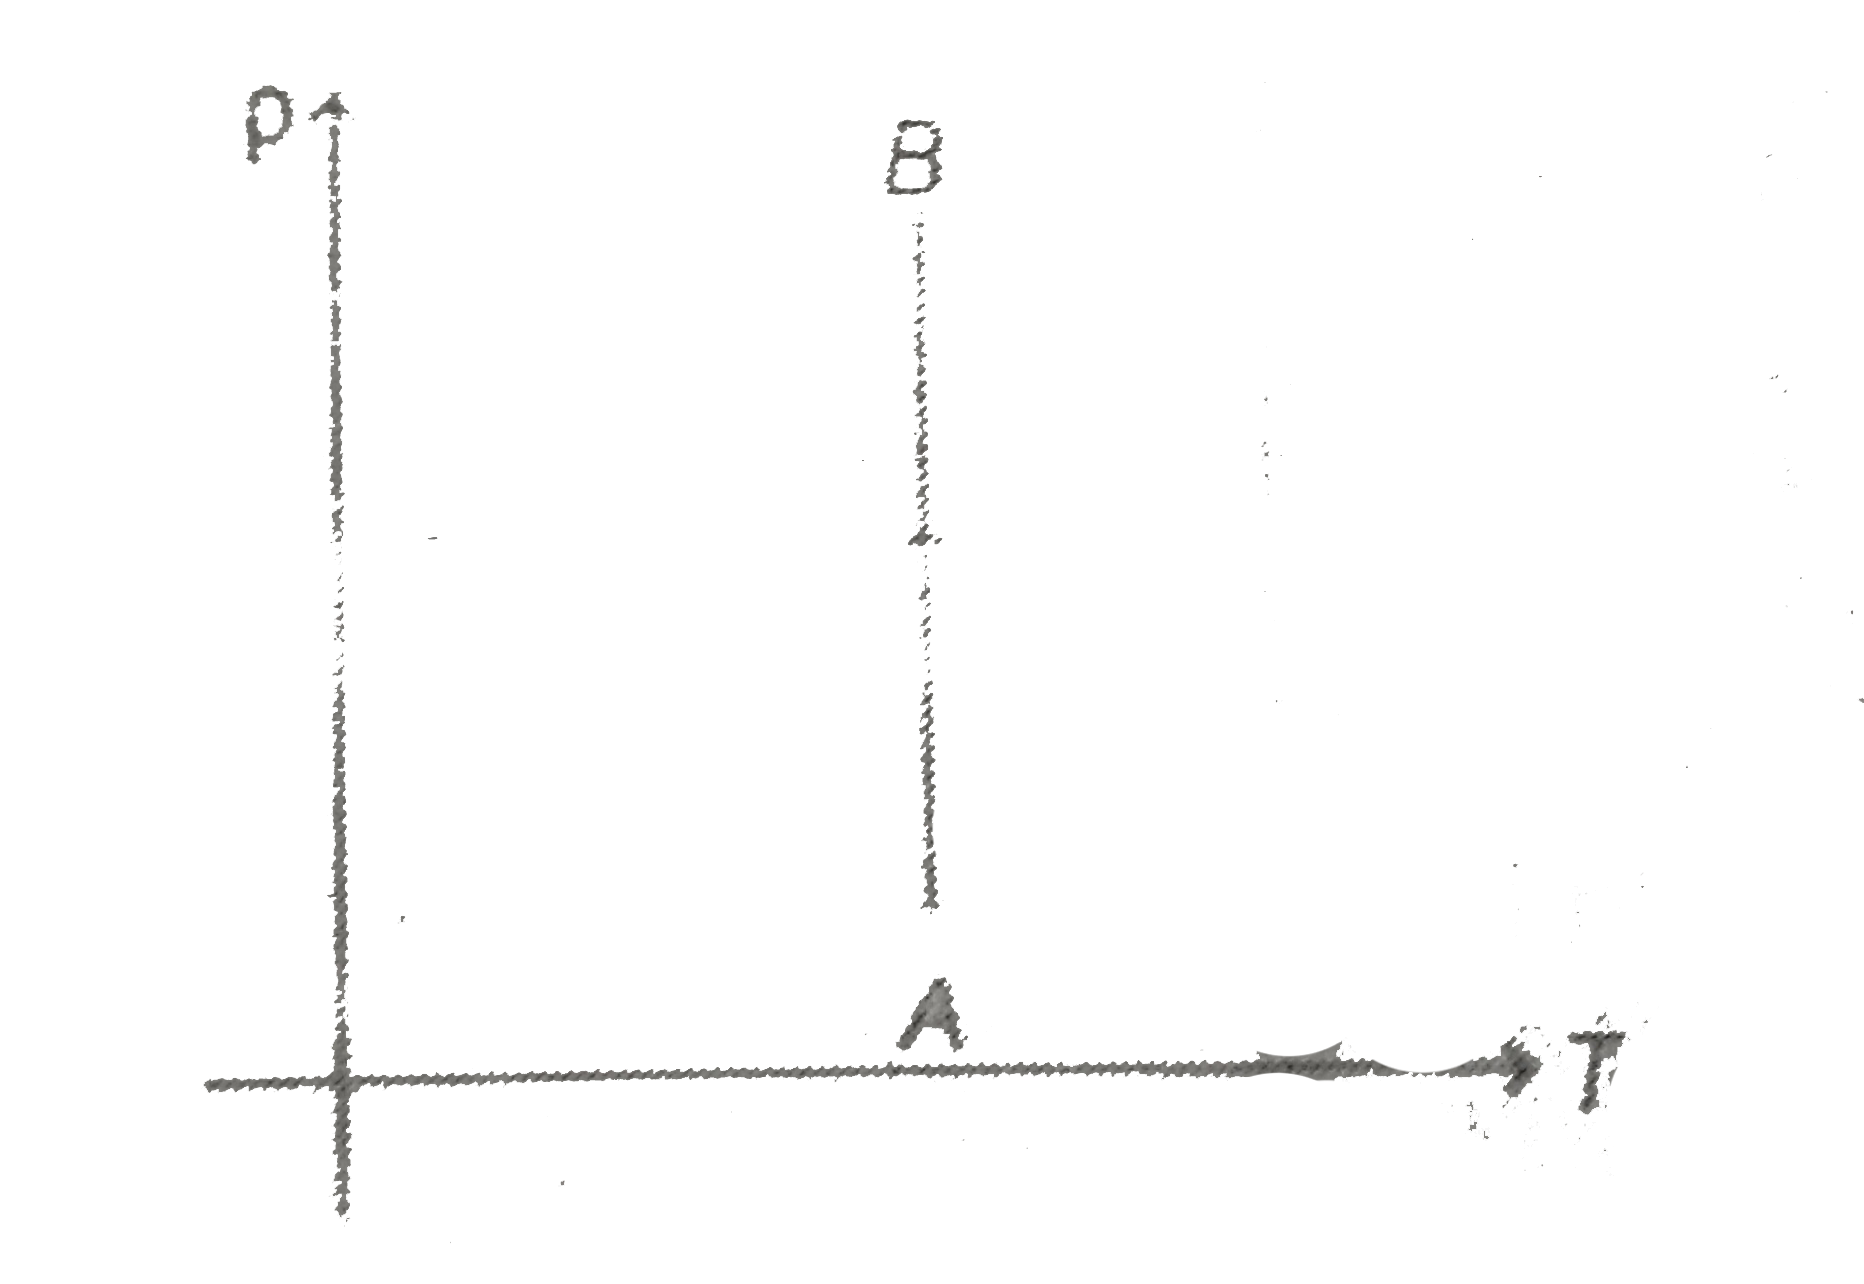 Athe product of P and V at A is equal to the product of P and V at BBpressure at B is greater than the pressure at ACwork done by the gas during process AB is negativeDthe change in internal energy from the A to B is zero
 - Question 3 - Select One
The V - I graphs for a conductor at temperature T1andT2 are shown in the figure (T2−T1) is proportional to
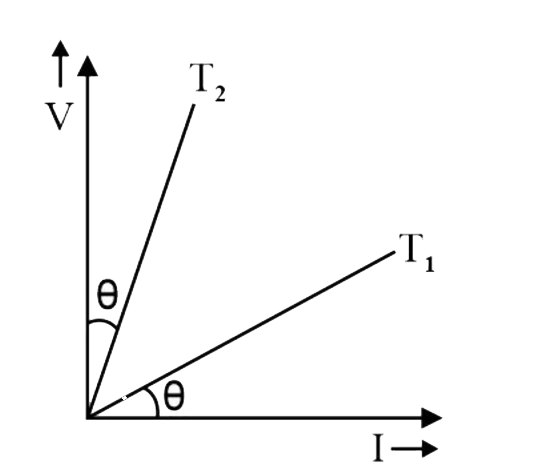 AtanθBsinθCcot2θDcos2θ
The V−i graph for a conductor at temeratures T1 and T2 are as shown in the figure. (T2−T1) is alphaortional to.
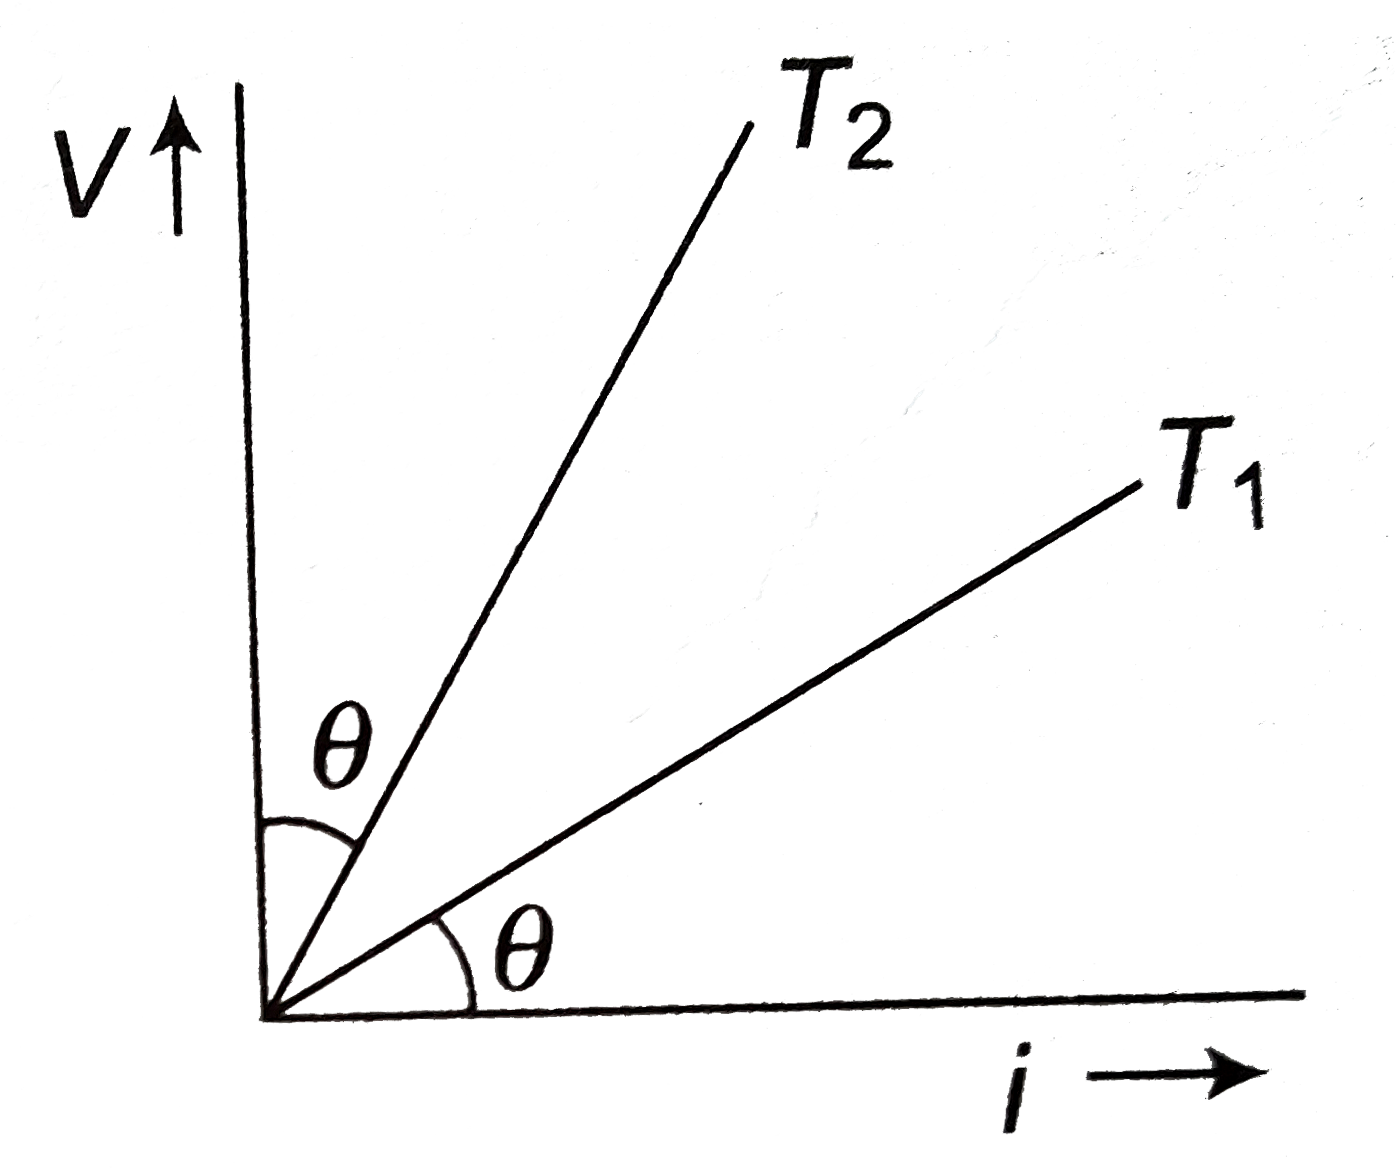 .View Solution
The V - i graph for a conductor at temperature T1 and T2 are as shown in the figure. (T2−T1) is proportional to
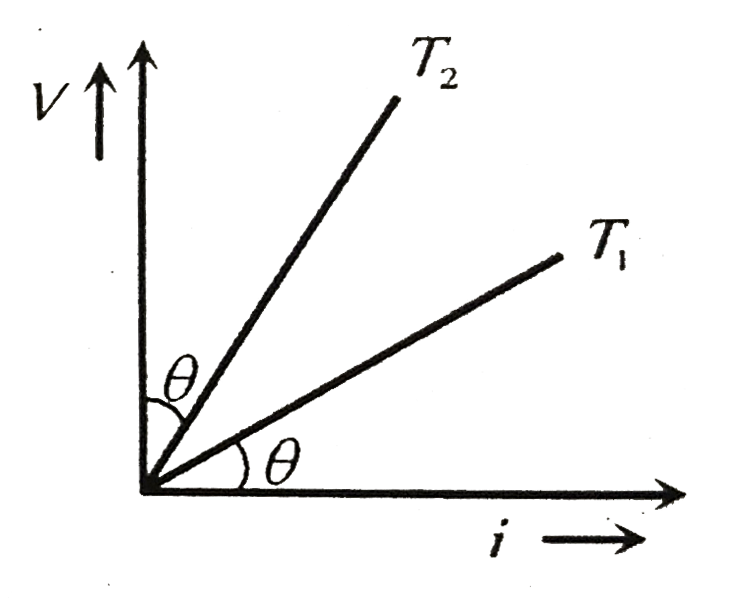 View Solution
The voltage V and current I graph for a conductor at two different temperatures T1 and T2 are shown in the figure. The relation between T1 and T2 is
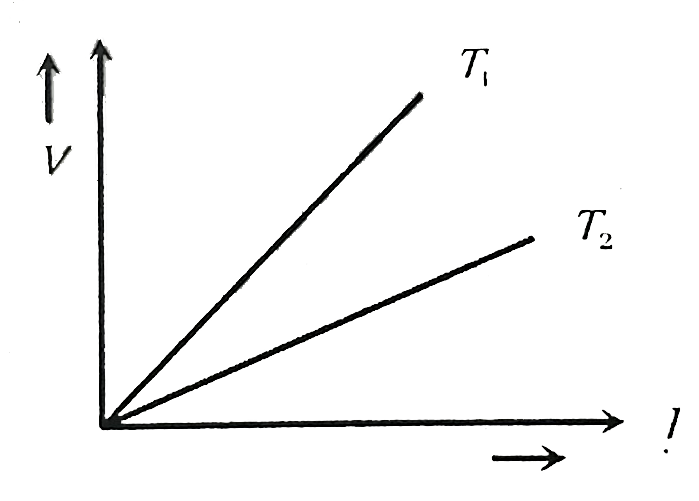 View Solution
The voltage V and current I v graphs for a conductor at two different temperatures T1andT2 are shown in the figure. The relation between T1andT2 is
 View Solution
The V-l graph for a conductor at temperatures T1 and T2 are as shown in the figure. The term T2−T1 is proportional to
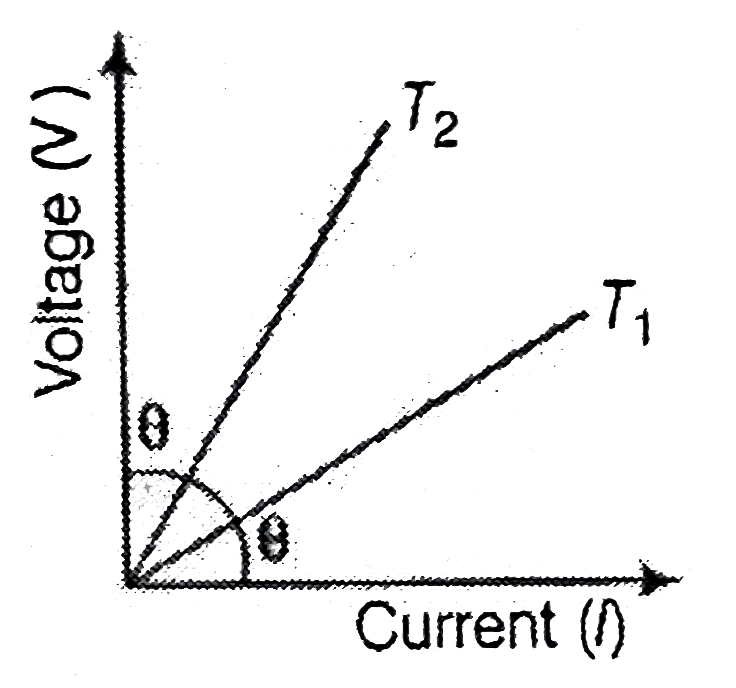 View Solution

